Oil India | Daily | Structural BreakoutAfter months of consolidation, Oil India has broken above a key supply zone with strength.
This move signals a trend shift, provided price sustains above the breakout level.
🔍 Technical Highlights:
• Long base → strong expansion
• Horizontal resistance taken out
• Volume supports the breakout
📌 Status: Breakout done, retest awaited
👉 Strength on dips > chasing highs
⚠️ Educational view only. Not a buy/sell call.
#OilIndia #BreakoutStock #PriceAction #TechnicalAnalysis #IndianStocks #SwingTrading #TrendBreakout
Community ideas

SOLARIND 30% upside possible in next 6-8 Months.SOLARIND 30% upside possible in next 6-8 Months.
Fundamentals:
Company has reduced debt.
Company has delivered good profit growth of 35% CAGR over last 10 years.
Technicals:
Stock has been correcting from high of 17800 Since 7 Months.
Looks like the bottom should be formed near 11800-12500 region taking the stock back to last highs of 17800+
LTP - 13200
Target - 18000+
SL - 11500
Timeframe - 6-8 Months
Happy Investing.

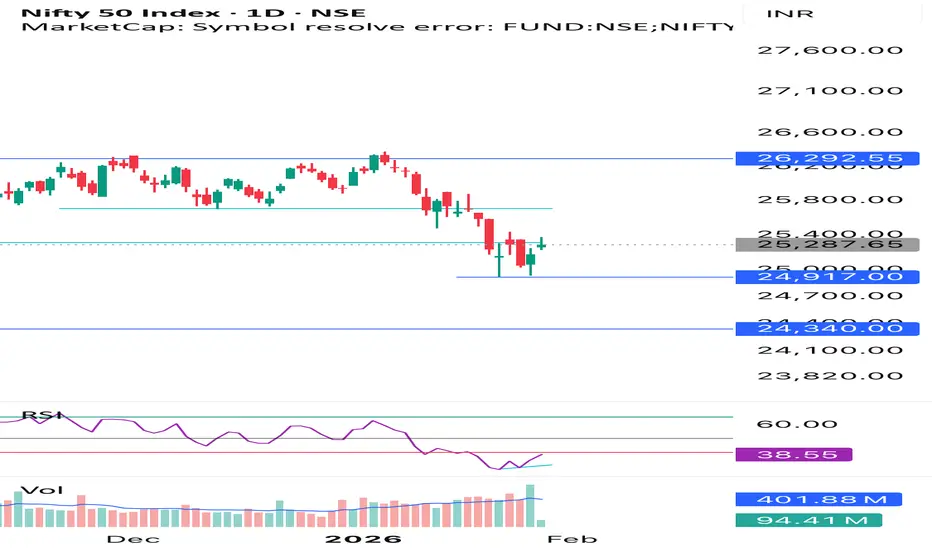
Nifty Base FormationNifty is forming at Good Base with small RSI divergence. A close above 40 RSI and 10 EMA in nifty may result in a new short term upward trend
XAUUSD - H1 Gold structurally bullishXAUUSD – H1 Gold remains structurally bullish near all-time highs| Lana ✨
Gold is extending its bullish momentum for a second consecutive session and continues to trade near all-time highs. Price action remains constructive, with the market holding above key structure while deciding between continuation or a deeper pullback into value.
📈 Market Structure & Trend Context
The short-term and medium-term structure remains bullish, with price respecting the ascending channel.
The recent push above previous highs confirms strong demand, but current price action also shows signs of consolidation near ATH.
This behavior is typical after an impulsive rally, where the market pauses to build acceptance or rebalance liquidity before the next directional move.
As long as price holds above the rising structure, the bullish thesis remains valid.
🔍 Key Technical Zones to Watch
ATH Reaction Zone: 5080 – 5110
This is a sensitive area where price may consolidate, fake out, or briefly reject before choosing direction.
Primary Pullback / Buy Zone: 5000 – 5020
A key structural level aligned with prior resistance-turned-support and the midline of the bullish channel.
Secondary Support (Deeper Pullback): 4920 – 4950
A stronger value area if volatility increases or liquidity is swept below the channel.
Upside Expansion Zone: 5180 – 5200+
If price accepts above ATH, this becomes the next upside objective within the channel.
🎯 Trading Scenarios (H1 Structure-Based)
Scenario 1 – Continuation Above ATH:
If price consolidates above 5080–5110 and shows acceptance, gold may extend toward 5180–5200. This scenario favors patience and confirmation rather than chasing immediate breakouts.
Scenario 2 – Pullback Into Structure (Preferred):
A pullback toward 5000–5020 would allow the market to rebalance liquidity and offer a higher-quality continuation setup. Holding this zone keeps the bullish structure intact.
Scenario 3 – Deeper Correction:
If price loses the primary support, the 4920–4950 zone becomes the next key area to watch for buyer response and trend defense.
🌍 Macro Context (Brief)
Gold continues to benefit from heightened geopolitical risks and ongoing trade uncertainty, reinforcing its role as a safe-haven asset.
At the same time, market attention is shifting toward the outcome of the two-day FOMC policy meeting on Wednesday, which may introduce volatility and short-term repricing.
This backdrop supports gold structurally, while also increasing the likelihood of sharp intraday swings around key levels.
🧠 Lana’s View
Gold remains bullish, but near ATH levels, discipline matters more than conviction.
Lana prefers buying pullbacks into structure, letting price confirm, and avoiding emotional trades during headline-driven volatility.
✨ Respect the structure, stay patient near the highs, and let the market come to your levels.

XAUUSD – Bullish Continuation, ATH Expansion Still in PlayGold continues to trade within a strong bullish channel, maintaining its ATH expansion structure. The recent pullback is corrective in nature and shows clear signs of liquidity absorption rather than distribution.
On the macro side, sustained USD weakness, safe-haven flows, and a still-cautious Fed outlook keep gold supported at elevated levels.
➡️ This environment favors trend continuation, not top-picking.
Structure & Price Action
H1 structure remains bullish with Higher Highs and Higher Lows intact.
The recent drop has respected key demand zones and the ascending trendline.
No bearish CHoCH confirmed → downside moves remain corrective.
Price is rebalancing after an impulsive leg, preparing for the next expansion.
Key takeaway:
👉 Pullbacks are opportunities to position with the trend, not signs of reversal.
Trading Plan – MMF Style
Primary Scenario – BUY the Pullback
Focus on patience and structure confirmation.
BUY Zone 1: 5,045 – 5,020
(Rebalance area + intraday demand)
BUY Zone 2: 4,985 – 4,960
(Trendline confluence + deeper liquidity)
➡️ Only execute BUYs after bullish reaction (rejection wicks / structure hold).
➡️ Avoid chasing price at highs.
Upside Targets (ATH Extension):
TP1: 5,106
TP2: 5,198 (upper extension zone)
Alternative Scenario
If price holds firmly above 5,106 without a meaningful pullback, wait for a break & retest to join continuation BUYs.
Invalidation
A confirmed H1 close below 4,960 would weaken the bullish structure and require a reassessment.
Summary
Gold remains in a controlled ATH expansion phase. As long as structure and demand zones hold, the path of least resistance stays to the upside.
The MMF approach remains unchanged: buy pullbacks, follow structure, and let the trend do the work.

ATH Breakout Pullback: Smart Money Reloading at Demand Zone?Price has corrected from an all-time high and is now revisiting a high-quality demand zone that played a key role in breaking previous highs. This is not a random pullback — this is a structurally important retest. Let’s decode what the chart is really saying using pure Supply & Demand and Price Action.
📊 Higher Timeframe & Intermediate Trend Context
The weekly structure remains firmly bullish. Price has already achieved something critical: it broke and closed above the previous all-time high. This single fact changes the entire narrative.
When a market makes a fresh all-time high, it confirms:
• Strong institutional participation
• Absence of historical supply overhead
• A higher probability of continuation over deep reversal
The current move is best understood as a corrective pullback within a dominant higher-timeframe uptrend, not trend reversal.
📦 Demand Zone Logic: Why This Area Matters 🧠
The demand zone currently in play is not just any zone — it is the origin of the rally that led to the all-time high breakout. That gives this zone exceptional importance.
Key observations:
• This zone generated a powerful follow-through move
• It successfully absorbed supply and pushed price into price discovery
• Previous all-time high was broken after leaving this zone
Such zones often act as institutional reload zones, where large players look to re-enter positions during corrections.
🧩 Zone Structure & Strength
• The base is clean and well-defined
• The leg-out was explosive, signaling urgency from buyers
• Very limited basing candles, which increases imbalance
• First meaningful return after the breakout, enhancing freshness
This combination significantly improves the credibility of the zone.
🧠 Market Psychology Behind the Pullback
After an all-time high, weaker hands tend to book profits aggressively, mistaking correction for reversal. Meanwhile, stronger hands wait patiently for price to return to value.
📐 Trade Logic & Risk–Reward Perspective 🎯
The trade idea on the chart is structured around a 1:3 risk-to-reward ratio, which aligns well with:
• Higher timeframe Uptrend
• Strong demand location
• Favourable asymmetry between risk and potential reward
⚠️ Risk Awareness & Execution Discipline ⚖️
Even the best demand zones can fail. No setup is 100% reliable. Always define risk first, respect invalidation, and avoid emotional decision-making. Capital protection is more important than being right.
📌 Final Takeaway 🧭
higher-timeframe uptrend, all-time high breakout, and a controlled pullback into a good demand zone. Now, price action inside this area will decide the next move — reaction matters more than anticipation.
“Big trends are built on deep patience and precise execution.” 🔥📊
Thank you for your support, your likes & comments. Feel free to ask if you have questions.
This analysis is for educational purposes only and not intended as a trading or investment recommendation. I am not a SEBI registered analyst.

Gold Trading Strategy for 28th January 2026🟡 GOLD ($) TRADING PLAN
📊 TREND TRADING (Intraday)
📈 BUY SETUP
🟢 Condition:
➡️ Buy above the high of 30-min candle
➡️ Candle must close above $5244
🎯 Targets:
💰 $5255
💰 $5266
💰 $5277
🛑 Stop Loss:
🔻 Below the low of the breakout candle
📉 SELL SETUP
🔴 Condition:
➡️ Sell below the low of 1-hour candle
➡️ Candle must close below $5125
🎯 Targets:
💰 $5115
💰 $5105
💰 $5095
🛑 Stop Loss:
🔺 Above the high of the breakdown candle
⚡ SCALPING STRATEGY
🔻 SELL SCALPING (Resistance – $5244)
❌ Price tests $5244 zone
❌ 15-min candle rejection observed
📍 Entry:
➡️ Sell below the low of rejected 15-min candle
🛑 Stop Loss:
🔺 Above the high of rejected candle
⏱️ 5–10 points max or trail SL
📌 Trade Management:
🔄 Trail stop once price moves in favor
🔺 BUY SCALPING (Support – $5125)
✅ Price tests $5125 zone
✅ 15-min candle rejection observed
📍 Entry:
➡️ Buy above the high of rejected 15-min candle
🛑 Stop Loss:
🔻 Below the low of rejected candle
⏱️ 5–10 points max or trail SL
📌 Trade Management:
🔄 Trail stop once price moves in favor
⚠️ DISCLAIMER
🚨 This is not investment advice.
📉 Trading in commodities involves high risk.
💸 Past performance does not guarantee future results.
🧠 Trade only with proper risk management.
📌 Always consult your financial advisor before trading.
❗ Author is not responsible for any profit or loss.

indian market option trading indicatoroption Trading view both call and put in same chart
a indicator showing call and put on same chart for trading in options of indian market
visit to get indicator

METROBRAND at Major Demand ZoneMETROBRAND is trading inside a well-defined range for months, with price repeatedly respecting both resistance and support zones.
The upper trendline continues to act as supply, while the horizontal base around 1000–1050 has consistently attracted buyers.
Once again, price has returned to this major demand zone — a level that has historically triggered strong reactions.
From here:
• A hold and bounce keeps the broader structure intact
• A clean breakdown would signal a shift in trend and open lower levels
This is not a random price area — it’s a key decision zone where smart money activity is usually visible.

Nifty50 analysis(28/1/2026).CPR: overlapping + descending cpr: consolidation day.
FII: -3,068.49 Sold
DII: 8,999.71 bought.
Highest OI: too soon to tell
Resistance:25500.
Support : 24900.
conclusion:
My pov:
1.yesterday clearly DII support with 9000cr. today a positive almost 300 point gap. this gap will not sustain.
2.price will drift towards yesterdays high or today cpr only then price goes upward.
3.wait for the price come to your range so you can buy at bottom.
What IF:
1.if price breaks 24900 and closed in day candle then overall trend continues.
2.if the gap sustained from openning then 25600 will be the resistance .
psychology fact:
A setbacks as the result of minor, controllable, situations that have nothing to do with them personally.
note:
8moving average ling is blue colour.
20moving average line is green colour
50moving average line is red colour.
200moving average line is black colour.
cpr is for trend analysis.
MA line is for support and resistance.
Disclaimer:
Iam not Sebi registered so i started this as a hobby, please do your own analysis, any profit/loss you gained is not my concern. I can be wrong please do not take it seriously thank you.

NIFTY Levels for Today
Here are the NIFTY's Levels for intraday (in the image below) today. Based on market movement, these levels can act as support, resistance or both.
Please consider these levels only if there is movement in index and 15m candle sustains at the given levels. The SL (Stop loss) for each BUY trade should be the previous RED candle below the given level. Similarly, the SL (Stop loss) for each SELL trade should be the previous GREEN candle above the given level.
Note: This idea and these levels are only for learning and educational purpose.
Your likes and boosts gives us motivation for continued learning and support.

BANKNIFTY Levels for Today
Here are the BANKNIFTY’s Levels for intraday (in the image below) today. Based on market movement, these levels can act as support, resistance or both.
Please consider these levels only if there is movement in index and 15m candle sustains at the given levels. The SL (Stop loss) for each BUY trade should be the previous RED candle below the given level. Similarly, the SL (Stop loss) for each SELL trade should be the previous GREEN candle above the given level.
Note: This idea and these levels are only for learning and educational purpose.
Your likes and boosts gives us motivation for continued learning and support.

#NIFTY Intraday Support and Resistance Levels - 28/01/2026A gap-up opening in Nifty 50 reflects a positive overnight sentiment, likely driven by global cues or short-covering from lower levels. However, even after the gap-up, the index is still trading within a well-defined range, which means today’s move will be highly level-based rather than a straight trending day unless a strong breakout is seen.
Market Structure & Key Zones
The 25200–25250 zone is acting as a crucial pivot area for the session. This zone has repeatedly worked as both support and resistance in the recent past, making it a decisive region for intraday direction.
If Nifty holds above 25250, it signals strength and confirms that buyers are willing to defend higher levels.
Failure to sustain above this zone may drag the index back into the lower support band.
Bullish Scenario (Above 25250)
If price sustains above 25250, long positions can be considered with a bullish bias.
Upside targets are placed at:
25350 – first resistance and intraday booking zone
25400 – minor supply area
25450+ – strong resistance and previous rejection zone
A clean break and sustain above 25450 can further strengthen bullish momentum, but near these levels, profit booking is expected. Hence, partial exits and trailing stop-loss are advised.
Bearish Scenario (Below 25200)
If the index rejects the 25250–25200 zone and slips below 25200, bearish momentum can build up quickly. In such a case, short positions become favorable with downside targets at:
25100 – first support
25050 – intraday demand zone
25000 – major psychological and technical support
A decisive breakdown below 25000 would weaken the structure further and may invite panic selling, though bounce attempts can also emerge from this level due to its psychological importance.
Trading Approach for the Day
Despite the gap-up opening, Nifty is still not in a clear trend. The index needs price acceptance above resistance to continue upward. Until then, expect volatile, two-way moves around key levels.
Best approach for today:
Avoid chasing the gap
Trade only after confirmation near support/resistance
Book partial profits at each target
Keep strict stop-losses due to whipsaw risk
Overall, the bias remains cautiously positive above 25250, while below 25200 the tone turns weak. Discipline and level-based execution will be the key to navigating today’s session successfully.

#BANKNIFTY PE & CE Levels(28/01/2026)A gap-up opening in Bank Nifty indicates a positive start to the session, supported by short-covering and fresh buying interest from lower levels. The index has opened above the immediate intraday support zone, which suggests that bulls are attempting to regain control after recent consolidation. However, despite the gap-up, the market is still trading within a broader range, so confirmation through price sustain is crucial before assuming a strong trending move.
From a technical structure point of view, the 59050–59100 zone is acting as a major demand and decision area. Holding above this region keeps the bullish bias intact for the intraday session. If Bank Nifty sustains above 59050, buying Call options becomes favorable, with upside targets placed near 59250, followed by 59350, and then 59450+. These levels correspond to previous supply zones and minor swing highs, where profit booking or partial exit should be considered due to potential resistance.
A stronger bullish continuation will only be confirmed if the index manages to break and sustain above 59550. Above this level, momentum buying can accelerate, opening the path towards 59750, 59850, and eventually 59950+, which is a major resistance area marked by previous rejections. This zone is critical, as failure to cross it decisively may again push the index back into consolidation or minor correction.
On the downside, 59450–59400 is the first intraday support. A breakdown below this zone may trigger short-term weakness, making Put options attractive with targets around 59250, 59150, and 59050. If selling pressure increases and Bank Nifty slips below 58950, the structure turns weaker, and further downside targets open up towards 58750, 58650, and 58550, which are stronger demand zones from where bounce-back attempts can emerge.
Overall, the gap-up opening reflects positive sentiment, but the market is still trading near crucial resistance bands. Traders should avoid chasing the gap and instead focus on price acceptance above key levels. A sustained move above resistance confirms bullish strength, while rejection from higher zones can quickly lead to a pullback. Maintaining strict stop-losses, booking partial profits near targets, and trading strictly based on levels will be essential due to expected volatility around these zones.


SBICARDS : Everyone Gave Up… That’s When Bases Are Born📊 SBI Cards & Payment Services Limited – Weekly Technical Analysis
Timeframe: Weekly
CMP: ~₹771
Trend Context: Larger base formation after extended correction
Structure: ABC corrective wave + potential Cup & Handle completion
🔍 Big Picture Structure (What’s Really Happening)
SBI Cards earlier witnessed strong selling from an extended retracement / supply zone (113%–127%), which is a classic area where:
Long-term holders book profits
Institutions reduce exposure
Late breakout buyers get trapped
This led to a controlled ABC correction, not a breakdown of the long-term structure.
📘 Markets correct to reset positioning, not to punish everyone.
📐 Why the Marked Levels Matter (Trading Psychology Explained)
🟦 ABC Completion / Demand Zone: ₹720 – ₹770
This is the most important zone on the chart.
🧠 Why price can react here:
Sellers from higher levels have largely exited
Value buyers step in near prior accumulation areas
Shorts start covering as downside momentum fades
👉 This zone represents fear exhaustion, where selling pressure typically dries up.
📌 It also aligns with a potential “handle” completion of a larger Cup & Handle pattern.
🔴 Invalidation / Risk Level: ₹690 (Day Close Below)
Breakdown below this level damages base structure
Psychology shifts from “buying dips” to “capital protection”
Confidence erosion can invite fresh selling
📉 Below ₹690, downside risk increases sharply.
🔑 Upside Levels & Targets (Why They Matter)
🟠 First Target Zone: ₹990 – ₹1,020
Prior supply memory
Trapped traders look to exit here
Profit booking likely on first approach
📘 Markets often hesitate where pain was previously created.
🟢 Second Target: ₹1,127
Larger pattern projection
Psychological round-number magnet
Momentum & FOMO participation zone
📈 Acceptance above ₹1,020 can accelerate price toward this zone.
🟢 Bullish Scenario (Primary Probability)
If price:
Holds above ₹720–770
Forms a base or higher low on weekly chart
Then:
Gradual recovery toward ₹990–1,020
Break & sustain → ₹1,127
Confirms base-to-expansion transition
📘 Strong bases often look boring before they explode.
🔴 Bearish Risk Scenario
If price:
Closes below ₹690
Then:
Base structure weakens
Buyers step aside
Market searches for deeper liquidity zones
📉 This reflects loss of confidence, not just technical damage.
🎓 Educational Takeaways
Corrections end where fear peaks, not where hope feels strong
Fibonacci & pattern zones work because crowds react together
Bases form quietly; breakouts are loud
The best opportunities feel uncomfortable at entry
🧠 Emotion Map of This Chart
Zone Dominant Emotion
Highs Greed & Euphoria
Decline Denial
Base zone Fear vs Opportunity
Breakout Relief & Momentum
Targets FOMO
📘 Charts are stories of crowd psychology, not just price.
🔮 Price Outlook (Educational Projection)
Above ₹770: Base confirmation improves
Above ₹1,020: Momentum revival
Upside targets: ₹1,127
Below ₹690: Caution, structure weakens
🧾 Conclusion
SBI Cards appears to be transitioning from correction to base formation.
The ₹720–770 zone is a decision area that can decide whether the stock moves into a new accumulation phase or slips into deeper weakness.
📌 Big moves are born from boring bases.
⚠️ Disclaimer
This analysis is for educational purposes only.
I am not a SEBI registered analyst. Markets involve risk, and I can be wrong.
Please consult your financial advisor before making any trading or investment decisions.

Market Outlook & Trade Setup – Wednesday, 28th January 2025🔹 NIFTY
* Previous Close: 25,175
* Expected Range: 25,000 – 25,200
🔹 SENSEX
* Previous Close: 81,857
* Expected Range: 81,500 - 82,000
🌍 Global & Market Sentiment
* DJIA: -408 | S&P: +28
💰 Institutional Activity (Cash Market)
* FII: Net Sellers: - ₹ 3068 Cr
* DII: Net Buyers: + 9000 Cr
🔥 Events this Week: US --- Trump Speech & FED Rate announcement
📌 Sectoral Focus
Metal, PSU Bank, Pvt Bank
👉 Commodities in Focus: Gold, Silver
💯 Important Quarterly Results: BEL, Maruti, SBI Life, L&T, ACC
📈 Trade smart. Manage risk. Stay disciplined.

Gold in Decision Zone – GAP Reaction Defines Next MoveMarket Context (Fundamentals → Flow)
Recent sessions continue to be driven by elevated geopolitical and macro uncertainty. Risk sentiment remains fragile as markets reassess global political tensions and their implications for trade, energy routes, and monetary stability.
As a result:
USD remains under pressure, lacking strong follow-through buying.
Equities show signs of fatigue near highs.
Gold continues to attract defensive flows, keeping the broader bullish structure intact.
This environment supports trend continuation, but not without technical pullbacks.
Technical Structure (H1–H4)
Gold is trading within a well-defined ascending channel.
Multiple BOS (Break of Structure) confirm the bullish trend.
The recent impulsive leg created a bullish GAP / imbalance.
Price is now reacting near the mid-channel decision zone, where continuation vs. deeper retrace is decided.
➡️ Trend is bullish, but location matters.
Key Levels to Watch
Current resistance: 5,080 – 5,100
GAP / reaction zone: 5,020 – 5,000
Major demand (FVG): 4,960 – 4,940
Invalidation: H1 close below 4,940
Scenarios (If – Then)
Scenario 1 – GAP Holds (Primary Bias)
If price holds above 5,000
Buyers defend the imbalance
→ Continuation toward 5,120 – 5,180 within the channel.
Scenario 2 – Deeper Pullback (Healthy Correction)
If price loses 5,000
Expect a retrace into 4,960 – 4,940 FVG.
Bullish reaction here keeps the higher-timeframe trend intact.
Only a clean break and acceptance below 4,940 would weaken the bullish structure.
Summary
Gold is not topping — it is pausing at a decision zone. In a risk-sensitive environment, pullbacks are opportunities, not threats.

DXY : Decisive Move ComingDXY is stuck in a range for long and ascending triangle type formation can be seen on weekly charts. Any break either upside or downside can bring a big move and sharp move

UPDATE on previous EURUSD BULLISH IDEA!The price has claimed the highs which was a major level I marked and presented at :- 1.19206.
The TRADE IDEA is COMPLETE!
Congratulations to whoever took this.

REVERSED but will it sustain!? As we can see NIFTY did reversed exactly as analysed in our previous analysis as it was trading at important demand zone and a psychological level but the reversal wasn’t strong enough hence we may see weakness continuing in the index if fails to sustain itself above the psychological level so plan your trades accordingly and keep watching everyone.

#BANKNIFTY 1HR Hello Friends 👋
This Is The Key Level's Of Banknifty. Mark This Level's On Your Chart & Keep Eyes On Bullish Side View 📊

Gold Analysis & Trading Strategy | January 27–28Gold Analysis & Trading Strategy | January 27–28
🔥Congratulations to all members who followed our trading signals.
The long positions opened around 5050 have successfully captured over 500+ pips in profit!👏👏👏
✅ 4-Hour Chart (H4) Analysis
From the 4-hour timeframe, gold remains within a clear bullish structure. Price continues its previous stair-step rally, consistently forming higher highs and higher lows, confirming that the medium-term uptrend is still intact.
The moving averages (MA5 / MA10 / MA20) maintain a strong bullish alignment, with MA20 steadily sloping upward and providing dynamic support. Price continues to trade above these key moving averages, indicating that buyers remain in control of the market.
However, after testing the recent high near 5110, upside momentum has started to slow. Recent candles show smaller bodies and more upper wicks, while the upper Bollinger Band is flattening and the band width is narrowing. This suggests that the market is transitioning from a strong trending phase into high-level consolidation.
This behavior is more likely a healthy technical correction and position rotation after the rally, rather than a trend reversal. As long as price holds above the key support zone at 5020–5050, the bullish structure remains valid, and pullbacks should still be treated as buying opportunities.
✅ 1-Hour Chart (H1) Analysis
On the 1-hour timeframe, short-term price action has clearly shifted into a sideways consolidation phase. Price has tested the resistance above 5110 multiple times without a decisive breakout, while higher lows continue to form below. Overall, gold is trading repeatedly within the 5070–5110 range, forming a typical high-level range-bound or box consolidation structure.
The moving averages are gradually flattening and intertwining, with price frequently crossing above and below them, indicating weakening short-term momentum and a transition into a corrective phase.
This type of tight consolidation near the highs is usually a continuation pattern within a broader trend. It suggests accumulation and momentum building rather than distribution. Therefore, unless key supports break, the short-term bias remains slightly bullish.
From a trading perspective, it is more favorable to buy near support or follow breakout moves, rather than chasing price in the middle of the range.
🔴 Resistance Levels
• 5095–5110
• 5130–5150
🟢 Support Levels
• 5070–5080
• 5045–5050
• 5020–5010
✅ Trading Strategy Reference
🔰 Strategy 1: Buy on Pullbacks (Primary Plan ✅)
📍 Entry 1: 5050–5045
📍 Entry 2: 5020–5010
🎯 TP1: 5095
🎯 TP2: 5110
🎯 TP3: 5130+
🔰 Strategy 2: Breakout Buy (Momentum Plan)
📍 Entry: Break and hold above 5110
🎯 TP1: 5130
🎯 TP2: 5150
⛔ SL: Below 5095
🔰 Strategy 3: Short Setup (Only if breakdown ❌)
Short positions should only be considered if:
• Price breaks below 5020
• The H4 structure weakens
• Moving averages turn bearish
Otherwise, avoid counter-trend shorts.
✅ Trend Summary
Gold remains bullish on the H4 timeframe and is consolidating on H1.
The current move represents a high-level correction rather than a reversal.
👉 Buy the dips, avoid chasing shorts, and wait for either support or breakout entries.
