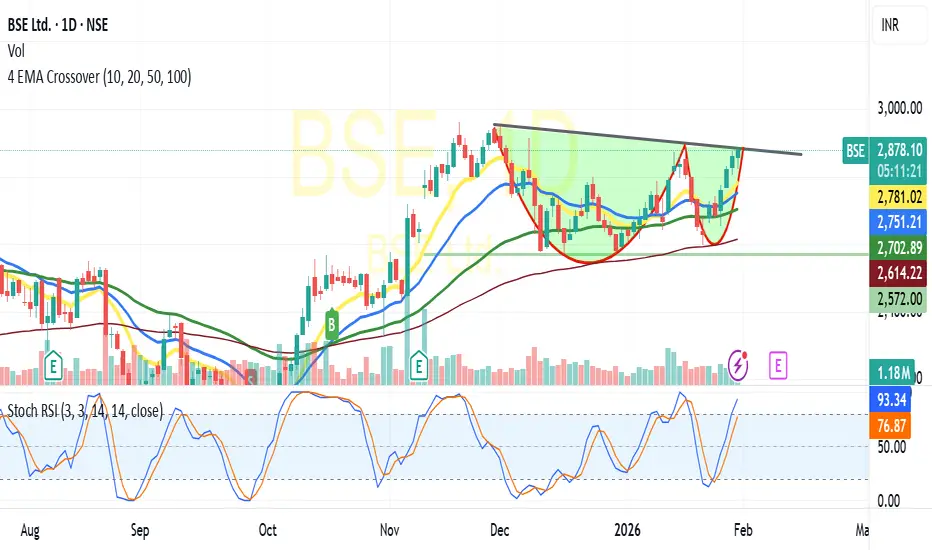
Smart Money Secrets in Trading1. What Is Smart Money?
The term “smart money” refers to capital controlled by investors with the most knowledge, resources, and influence in the market. Unlike retail traders who rely on news headlines, gut feelings, or basic technical indicators, smart money entities often have:
Advanced Research – Access to data analytics, machine learning models, and macroeconomic reports that retail traders can’t afford.
Liquidity Power – Ability to move billions of dollars into or out of markets.
Insider Insights – Not illegal insider trading, but a network of analysts, lobbyists, and industry connections that help them anticipate shifts earlier.
Sophisticated Tools – Proprietary algorithms, HFT (High-Frequency Trading) systems, and volume analysis.
When smart money flows into an asset, it often precedes strong trends. Conversely, when it exits, the trend weakens. Spotting these shifts is the cornerstone of trading like institutions.
2. Why Following Smart Money Matters
Most retail traders face three challenges:
They are late. By the time news is published, smart money has already acted.
They are emotional. Fear and greed drive poor decisions.
They are undercapitalized. Limited funds mean smaller risk tolerance and forced exits.
Smart money, on the other hand, has time, patience, and size on its side. They often accumulate positions when the market is quiet and distribute them when hype peaks. If retail traders learn to read footprints left by institutions, they can avoid being trapped and instead ride the waves created by these giants.
3. Smart Money Psychology
Before diving into strategies, it’s crucial to understand how smart money thinks differently:
Accumulation vs. Distribution: Institutions quietly build positions (accumulation) when prices are low and sentiment is negative. Later, they sell (distribution) when retail enthusiasm is high.
Liquidity Hunting: Big players need liquidity to enter and exit. They often push prices into zones where retail traders place stop-loss orders, triggering forced selling or buying, which provides liquidity for institutions.
Contrarian Nature: Smart money often takes positions opposite to the crowd. If everyone is bullish on a stock, institutions might be preparing to sell.
This mindset explains why retail traders often feel “the market is against them.” In reality, they are just on the wrong side of institutional strategies.
4. Smart Money Strategies in Action
a) Wyckoff Method
Richard Wyckoff’s market theory is one of the earliest frameworks for analyzing smart money moves. It breaks market cycles into accumulation, markup, distribution, and markdown.
Accumulation: Institutions quietly buy. Prices stay in a range.
Markup: Price breaks out as buying accelerates.
Distribution: Institutions sell to latecomers.
Markdown: Prices collapse as supply overwhelms demand.
Recognizing these phases helps traders align with institutional activity instead of being victims of it.
b) Volume Profile and Order Flow
Smart money activity often shows up in volume spikes at key price levels.
High Volume Nodes: Suggest accumulation/distribution zones.
Low Volume Nodes: Indicate areas where price moves quickly (little resistance).
Using tools like Volume Profile, Order Flow Charts, or Footprint Charts allows traders to identify where institutions are active.
c) Stop-Loss Hunting
Ever noticed your trade gets stopped out before the price reverses in your favor? That’s not coincidence. Institutions deliberately push prices into stop-loss zones to trigger retail exits, giving them the liquidity to enter positions. Recognizing liquidity pools (clusters of retail stops) helps traders anticipate these moves.
d) Options and Derivatives
Smart money often uses options to hedge or accumulate exposure without moving the underlying asset visibly. For example, unusual options activity (UOA) often precedes big stock moves. Tracking options volume and open interest provides clues about institutional expectations.
e) Dark Pools
Institutions often trade in “dark pools”—private exchanges where large orders are hidden from the public order book. While retail traders can’t see these trades in real time, monitoring dark pool data feeds can reveal where institutions are accumulating or unloading.
5. Indicators of Smart Money Activity
How can a retail trader detect smart money flow? Here are practical signals:
Unusual Volume – Sharp spikes in trading volume without corresponding news often signal institutional activity.
Price Action at Key Levels – Repeated defense of support/resistance zones often shows accumulation or distribution.
Commitment of Traders (COT) Reports – For commodities and forex, COT reports reveal institutional positions.
Options Activity – Large trades in far-dated contracts signal expectations of future moves.
Insider Buying/Selling – Public filings (like Form 4 in the US) show what company executives are doing with their shares.
Market Breadth Divergence – If a few large-cap stocks push indices higher while the majority lag, smart money may be distributing.
6. Smart Money Secrets Retail Traders Overlook
Secret 1: News Is Noise
By the time retail traders act on CNBC headlines, smart money has already positioned. Institutions often use news events to exit positions while retail crowds rush in.
Secret 2: Patience Pays
Smart money is not chasing quick profits—they wait weeks or months to build positions. Retail traders who overtrade often lose by being too impatient.
Secret 3: Fake Moves Before Real Moves
Markets often create false breakouts or sharp wicks to trick retail traders into the wrong direction. These are engineered by big players to grab liquidity.
Secret 4: Scaling In and Out
Institutions never place all their capital at once. They accumulate in layers to avoid moving the market. Retail traders often go “all in” and get wiped out.
Secret 5: Risk Management Is Non-Negotiable
The true secret of smart money isn’t just knowing where to trade—it’s knowing how much to risk. They survive losing streaks by controlling position size and leverage.
Conclusion
Smart money isn’t a mysterious cabal manipulating markets—it’s simply capital managed by those with deeper knowledge, bigger resources, and stronger discipline. Their secrets are not inaccessible; they’re patterns and behaviors visible to those who know where to look.
By understanding accumulation/distribution, liquidity hunting, volume footprints, options flow, and institutional psychology, retail traders can stop fighting the market and instead surf the waves created by the giants.
The real secret, however, is not in any single indicator—it’s in the mindset: patience, discipline, risk management, and the ability to think like an institution rather than a gambler. Once traders internalize this, they transition from being part of the crowd to moving in sync with the real power behind the markets.
Community ideas
Futures and Options (F&O) Trading:1. The Origins of Derivatives and F&O Trading
Derivatives are not new inventions. Their history can be traced back centuries:
Ancient Mesopotamia (2000 BC): Farmers and merchants used contracts to lock in prices of crops to avoid uncertainties.
Japan (17th century): The Dojima Rice Exchange in Osaka became one of the first organized futures markets.
Chicago Board of Trade (1848): The U.S. developed standardized futures contracts for agricultural commodities.
Over time, derivatives expanded beyond commodities into financial assets such as stocks, indices, and currencies. India entered the derivatives market in 2000, when the National Stock Exchange (NSE) introduced index futures on the Nifty 50. Soon after, single-stock futures and options followed. Today, India is one of the largest F&O markets in the world by trading volume.
2. Understanding the Basics of F&O
2.1 What are Futures?
A futures contract is a legal agreement to buy or sell an asset at a predetermined price on a specified future date.
Key points:
Futures are standardized contracts traded on exchanges.
They require margin money (a fraction of the total value) instead of full payment upfront.
Settlement can be in cash or delivery (depending on the market).
Futures are used both for hedging (risk management) and speculation (profit opportunities).
Example:
If a trader expects Reliance stock (currently ₹2,500) to rise, they may buy a futures contract at ₹2,520 expiring in one month. If Reliance rises to ₹2,700, the trader profits ₹180 per share without owning the stock.
2.2 What are Options?
An option is a contract that gives the buyer the right (but not the obligation) to buy or sell an asset at a predetermined price before or on expiry.
Call Option: Right to buy the asset.
Put Option: Right to sell the asset.
The buyer pays a premium to the seller (also called the option writer).
Example:
Nifty is at 20,000. A trader buys a 20,100 Call Option for a premium of ₹100. If Nifty rises to 20,400, the call is worth ₹300, giving a net profit of ₹200. If Nifty falls, the trader loses only the premium (₹100).
2.3 Futures vs. Options
Aspect Futures Options
Obligation Both parties obligated Buyer has right, not obligation
Upfront cost Margin (5–15% of contract) Premium (non-refundable)
Risk Unlimited Limited to premium (for buyer)
Popularity Hedging, arbitrage, speculation Speculation, hedging, income strategies
3. Structure of F&O Trading in India
3.1 Market Segments
Index Derivatives: Nifty 50, Bank Nifty, Sensex.
Stock Derivatives: Futures and options on large-cap and liquid stocks.
Currency Derivatives: USD/INR, EUR/INR, GBP/INR, JPY/INR.
Commodity Derivatives: Gold, silver, crude oil, agricultural products (on MCX/NCDEX).
3.2 Contract Specifications
Lot Size: Minimum quantity per contract (e.g., 25 shares for Reliance).
Expiry Date: Typically last Thursday of every month.
Margin Requirements: Initial margin, mark-to-market margin.
Settlement: Cash settlement is common in India for stock futures/options.
4. The Purpose of F&O Trading
Hedging: Protects against adverse price movements.
Example: An airline hedges fuel cost via crude oil futures.
Speculation: Traders bet on price direction for profit.
Example: Buying Nifty calls expecting a rally.
Arbitrage: Exploiting price differences between cash and derivative markets.
Example: Buying stock in cash market and selling futures at higher price.
Leverage: Allows trading larger positions with limited capital.
5. Advantages of F&O Trading
Risk Management: Ideal tool for hedging.
Leverage: High return potential with limited capital.
Liquidity: High volumes, especially in index derivatives.
Diverse Strategies: Flexibility to design risk-return profiles.
Price Discovery: Derivatives reflect collective market expectations.
6. Risks and Challenges
Leverage Risk: Amplifies both profits and losses.
Complexity: Requires advanced knowledge of pricing, strategies, and Greeks.
Time Decay (for options): Premium erodes as expiry approaches.
Volatility Risk: Sudden swings can wipe out capital.
Emotional Discipline: Traders often fail due to fear and greed.
7. Option Greeks – The Core of Options Trading
Options pricing is influenced by several factors called the Greeks:
Delta: Sensitivity to price changes in the underlying.
Gamma: Rate of change of delta.
Theta: Time decay of option premium.
Vega: Sensitivity to volatility.
Rho: Sensitivity to interest rates.
A successful options trader must understand and apply these Greeks in strategy building.
8. Popular Strategies in F&O Trading
8.1 Futures Strategies
Long Futures: Buy futures when expecting rise.
Short Futures: Sell futures when expecting fall.
Spread Trading: Buy one futures contract, sell another.
8.2 Options Strategies
Covered Call: Hold stock + sell call for income.
Protective Put: Buy put to hedge stock position.
Straddle: Buy call + put at same strike for volatility.
Strangle: Buy out-of-money call + put for cheaper volatility play.
Iron Condor: Sell OTM call and put, buy further OTM options to limit risk.
Conclusion
F&O trading is both an art and a science. It blends mathematics, psychology, and market dynamics into one of the most exciting areas of modern finance. For some, it is a tool of risk management; for others, it is a vehicle for wealth creation.
While futures and options provide unmatched flexibility, their leverage and complexity make them double-edged swords. Success requires education, discipline, strategy, and risk management.
In India and worldwide, F&O markets will continue to evolve, powered by technology, globalization, and growing investor participation. For traders and investors willing to learn, adapt, and respect risk, F&O trading can be an incredibly powerful journey.
Maruti Suzuki . Multi time frame analysisThe price is forming a very narrow range consolidation between 15300 and 15360 in the one-hour time frame. The price can give a breakout from here or test the trend line before moving up.
In the daily time frame, we can see double top resistance around the 15370 and 15388 zones.
Using this analysis, when we look at the 15-minute chart, safe entry will be when the price sustains above the double top or during a pullback when the price takes support around 15200.
Scenario 1: Buy above 15390 with the stop loss of 15330 for the targets 15440, 15490, 15540, 15590, and 15660.
Scenario 2: Buy above 15200 with the stop loss of 15140 for the targets 15260, 15320, 15380, 15440, and so on.
Always do your analysis before taking any trade.
Step-by-Step Guide to Crafting a Winning Trading PlanStep 1: Define Your Trading Goals
The foundation of any trading plan begins with clarity. What do you want to achieve?
Financial Goals: Are you trading to build long-term wealth, generate short-term income, or diversify your portfolio?
Return Expectations: Do you expect 10–15% yearly returns like a conservative investor, or are you aiming for aggressive 50–100% gains with higher risk?
Lifestyle Goals: Do you want trading to be a full-time career, a side hustle, or just a way to grow savings?
👉 Example:
Rohit, a part-time trader, sets a goal to earn 15% annually by swing trading stocks. His focus is on consistency, not hitting lottery-style wins. This goal shapes his strategy and risk limits.
Key takeaway: Be realistic. Setting unattainable goals leads to frustration and reckless decisions.
Step 2: Choose Your Trading Style
Your lifestyle, time availability, and personality should define your trading style. The main types are:
Scalping: Ultra-short-term trades, lasting seconds or minutes. Requires speed, focus, and advanced tools.
Day Trading: Multiple trades within a day, no overnight positions. Best for those who can monitor markets closely.
Swing Trading: Positions held for days to weeks. Suitable for part-timers.
Position Trading/Investing: Long-term trades based on fundamentals and macro trends.
👉 Example:
If you have a full-time job, swing trading or position trading may suit you. If you can dedicate 6–8 hours daily, day trading could work.
Key takeaway: Don’t copy someone else’s style. Align your trading style with your time and personality.
Step 3: Select Your Market and Instruments
Markets are vast. A winning plan focuses on a specific set of instruments:
Stocks/Equities – Suitable for both beginners and professionals.
Futures & Options – For leverage and hedging, but carry higher risks.
Forex – Highly liquid, global 24/5 market.
Commodities – Gold, silver, crude oil for diversification.
Cryptocurrencies – Highly volatile, but opportunities exist for skilled traders.
👉 Example:
Meera decides to specialize in Indian equities and Nifty50 futures instead of spreading across forex and crypto. This sharp focus makes her more skilled in her chosen area.
Key takeaway: Specialization beats generalization in trading.
Step 4: Risk Management Rules
No trading plan is complete without risk management. This protects your capital and ensures longevity.
Risk per Trade: Never risk more than 1–2% of your total capital in one trade.
Position Sizing: Adjust trade size based on account size and stop-loss distance.
Stop-Loss: Predetermine exit levels to prevent catastrophic losses.
Diversification: Don’t put all your capital in a single stock or sector.
Drawdown Limits: Decide how much of your capital you’re willing to lose before stopping trading (e.g., 10–15%).
👉 Example:
If you have ₹5,00,000 capital, risking 1% means you can lose only ₹5,000 per trade. If your stop-loss is ₹50 away, your position size should be 100 shares (₹5,000 ÷ ₹50).
Key takeaway: Risk management ensures survival—the #1 rule in trading.
Step 5: Develop Entry and Exit Strategies
A trading plan must clearly define when to enter and exit trades.
Entry Criteria
Technical indicators (RSI, MACD, Moving Averages, Volume Profile).
Chart patterns (Head & Shoulders, Breakouts, Pullbacks).
Fundamental triggers (earnings reports, economic data).
Exit Criteria
Profit targets (e.g., 2:1 risk-reward ratio).
Trailing stop-loss to lock in profits.
Time-based exit (close trade if target not hit in X days).
👉 Example:
Raj trades breakouts. His plan: Enter above resistance with 2:1 risk-reward. Stop-loss below support. Exit if the stock fails to break in 3 days.
Key takeaway: A defined strategy prevents emotional, random decisions.
Step 6: Trading Psychology and Discipline
Even the best plan fails if you lack emotional control.
Stick to the Plan: Don’t override your rules based on gut feelings.
Avoid Overtrading: More trades ≠ more profits. Quality over quantity.
Detach from Money: Think in terms of percentages, not rupees/dollars.
Accept Losses: Losses are part of the game. Don’t chase revenge trades.
👉 Example:
Anita sets 3 trades per day as her maximum. Even if she feels she can take more, she respects her limit to avoid overtrading.
Key takeaway: Discipline is the bridge between planning and profits.
Step 7: Record Keeping and Journaling
A trading plan is incomplete without a trading journal.
Record:
Entry/exit prices
Reason for trade
Outcome (profit/loss)
Emotions felt during trade
👉 Example:
Over 3 months, a trader notices most of his losses come from trades taken outside his strategy. Journaling reveals weak spots.
Key takeaway: Journaling turns mistakes into lessons.
Step 8: Review and Improve the Plan
Markets evolve—so should your plan.
Weekly Reviews: Check if trades followed your rules.
Monthly Reviews: Analyze win rate, risk-reward, and profits.
Quarterly Adjustments: Update strategies if market conditions change.
👉 Example:
A trader’s breakout strategy worked in trending markets but failed in sideways markets. Reviewing allowed him to add a range-trading method.
Key takeaway: Flexibility ensures your plan stays relevant.
Common Mistakes Traders Make When Planning
Overcomplicating the plan with too many indicators.
Ignoring risk management while chasing profits.
Copying another trader’s plan without customization.
Setting unrealistic expectations.
Not reviewing performance regularly.
Conclusion: Turning Your Plan into Profit
A trading plan is more than a document—it’s your personal trading compass. It defines your goals, trading style, risk tolerance, and strategy. More importantly, it keeps emotions in check and brings consistency.
The steps are simple but powerful:
Define goals.
Choose style.
Select instruments.
Manage risk.
Build entry/exit rules.
Control emotions.
Keep records.
Review and improve.
Every professional trader has a plan. Every failed trader ignores one. If you want long-term success, commit to your trading plan, refine it with experience, and let it guide every move.
Sub Brokers in India1. Introduction
The Indian stock market has witnessed remarkable growth in the last two decades, driven by rising investor participation, technological advancements, regulatory reforms, and growing awareness of financial instruments. With millions of new investors opening demat accounts every year, the need for intermediaries who can help bridge the gap between stock exchanges, brokers, and retail clients has become stronger.
While full-service brokers and discount brokers have taken center stage, another critical segment—sub brokers—continues to play a vital role in expanding the reach of capital markets, particularly in semi-urban and rural areas. Sub brokers serve as connectors between brokers and investors, making financial markets more inclusive and accessible.
This essay provides a comprehensive description of sub brokers in India trading, exploring their role, responsibilities, evolution, regulatory framework, benefits, challenges, and future prospects.
2. Who is a Sub Broker?
Definition
A sub broker is an intermediary who is not a direct trading member of stock exchanges like NSE (National Stock Exchange) or BSE (Bombay Stock Exchange) but acts on behalf of a registered stockbroker to assist investors in trading and investing activities.
They essentially work as franchise partners or authorized representatives of larger brokers, helping clients open demat accounts, execute trades, and access investment products.
Key Features
They are agents of main brokers but deal directly with clients.
They help with trading in equities, derivatives, commodities, mutual funds, IPOs, and other products.
They earn a commission on the brokerage generated by their clients.
Sub brokers are particularly active in tier-2 and tier-3 cities, expanding the market penetration of stockbrokers.
3. Evolution of Sub Brokers in India
The sub-broker concept has evolved significantly over time:
1990s – Early Expansion
With economic liberalization, stock market participation began to rise.
Sub brokers emerged as local representatives for brokers, connecting investors to exchanges.
2000s – Rapid Growth
Technological platforms (like ODIN) allowed sub brokers to service clients better.
Franchisee models gained traction, with brokers like Sharekhan, Angel Broking, and India Infoline expanding aggressively through sub brokers.
2010s – SEBI Regulations Tighten
SEBI increased oversight to curb malpractices.
Online brokers emerged, reducing dependency on physical sub brokers.
2020s – Digital Era & Decline in Traditional Sub Brokers
Discount brokers like Zerodha, Upstox, and Groww disrupted the industry with low brokerage and direct online platforms.
Many sub brokers shifted to becoming Authorized Persons (APs) under SEBI regulations.
4. Regulatory Framework
Sub brokers in India are governed by SEBI (Securities and Exchange Board of India) and stock exchanges like NSE, BSE, and MCX.
Key Regulations
Registration Requirement
Sub brokers had to register with SEBI earlier.
Post-2018, SEBI discontinued fresh sub broker registrations, and all were migrated to the Authorized Person (AP) model.
Authorized Person (AP) Model
Sub brokers now operate as APs under a stockbroker’s license.
APs need approval from the stock exchanges (not SEBI directly).
Eligibility Criteria
Minimum age: 18 years.
Must be a citizen of India.
Educational qualification: Preferably 12th pass.
Clean financial background (no defaults or fraud cases).
Compliance & Code of Conduct
Sub brokers must follow KYC (Know Your Customer) norms.
They cannot misrepresent investment opportunities.
They must act in clients’ best interests.
5. Roles and Responsibilities of Sub Brokers
Sub brokers perform multiple critical roles in India’s trading ecosystem:
1. Client Acquisition
Introduce new clients to the stock market.
Build trust and long-term relationships with investors.
2. Account Opening Support
Assist clients in opening demat and trading accounts.
Help with documentation, KYC compliance, and onboarding.
3. Trade Execution
Place buy and sell orders on behalf of clients through the broker’s platform.
Guide clients about different market segments (equity, derivatives, commodities).
4. Advisory Services
Provide insights on stocks, IPOs, and mutual funds.
Educate investors about risks and opportunities.
Although they are not registered advisors, many sub brokers act as informal guides.
5. Local Market Expansion
Brokers leverage sub brokers to penetrate smaller towns.
Sub brokers act as brand ambassadors for the broker in their region.
6. Customer Support
Resolve client issues regarding trading platforms, fund transfers, and settlements.
Offer personalized service that online-only brokers often lack.
6. Business Model of Sub Brokers
The sub-broker model is essentially a revenue-sharing partnership between the stockbroker and the sub broker.
Revenue Generation
Sub brokers earn commissions on brokerage fees charged to clients.
Typical sharing ratio: 60:40 or 70:30, where sub brokers keep 60–70% of the brokerage revenue.
Cost Structure
Initial franchise fees to the broker (₹50,000 – ₹3,00,000 depending on brand).
Infrastructure setup (office, computers, internet, staff).
Ongoing operational costs.
Example
If a client generates brokerage of ₹10,000 in a month:
Sub broker share (70%) = ₹7,000
Broker share (30%) = ₹3,000
7. Advantages of Being a Sub Broker
Low Entry Barrier – Compared to becoming a full-fledged broker, the cost and compliance burden is lower.
Established Brand Support – Sub brokers leverage the brand, technology, and research of large brokers.
High Earning Potential – With a good client base, sub brokers can earn substantial monthly income.
Flexibility – Can operate in chosen geographical regions.
Growing Market – Rising financial literacy ensures continued demand for intermediaries.
8. Challenges Faced by Sub Brokers
Competition from Discount Brokers
Low-cost platforms like Zerodha and Groww reduce reliance on intermediaries.
Regulatory Shifts
Migration from sub broker to AP model created uncertainty.
Technology Upgradation
Need to continuously invest in digital platforms and stay updated.
Client Expectations
Investors expect real-time service and accurate advice.
Misguiding clients can lead to loss of reputation.
Margin Pressure
With declining brokerage rates, earning potential is squeezed.
Famous Brokers and Sub Broker Networks in India
Some leading brokerage houses with large sub broker/authorized person networks include:
Angel One (Angel Broking) – One of the largest franchise networks.
Sharekhan – Known for its strong sub broker model.
ICICI Direct – Leverages bank branches and APs.
Motilal Oswal – Strong research-backed franchise business.
IIFL Securities – Popular in tier-2 and tier-3 towns.
Conclusion
Sub brokers in India have been the backbone of stock market penetration for decades. From being local representatives of big brokers in the 1990s to evolving as Authorized Persons in today’s digital era, they continue to play a vital role in democratizing market access.
While competition from discount brokers and regulatory changes have reshaped their landscape, sub brokers who embrace technology, diversify into multiple financial products, and focus on personalized advisory will thrive in the future.
The Indian capital market is still in its growth phase, and sub brokers will remain a bridge between financial institutions and retail investors, particularly in untapped regions.
Part 2 Trading Master ClassTypes of Options: Calls and Puts
There are only two fundamental types of options:
Call Option – Gives the right to buy the underlying asset at the strike price.
Example: Nifty is at 20,000. You buy a call option with a strike of 20,100. If Nifty rises to 20,400, you can buy at 20,100 and profit.
Put Option – Gives the right to sell the underlying asset at the strike price.
Example: Infosys is at ₹1,500. You buy a put option with a strike of ₹1,480. If Infosys falls to ₹1,400, you can sell at ₹1,480 and profit.
So, calls = bullish bets; puts = bearish bets.
Key Terminologies in Option Trading
To understand options, you must master the vocabulary:
Strike Price → Pre-decided price where option can be exercised.
Premium → Price paid by the option buyer to the seller.
Expiry Date → Last day the option can be exercised.
In-the-Money (ITM) → Option already has intrinsic value.
At-the-Money (ATM) → Strike price is equal to current market price.
Out-of-the-Money (OTM) → Option has no intrinsic value.
Lot Size → Options are traded in lots, not single shares. For example, Nifty lot = 50 units.
Relative Strength Index (RSI) in Trading1. Introduction to RSI
The financial markets operate on the constant tug-of-war between buyers and sellers. Traders have long sought tools to identify when markets are likely to reverse or continue trending. Among the most widely used technical indicators is the Relative Strength Index (RSI), a momentum oscillator developed to measure the speed and magnitude of recent price movements.
The RSI is not just a number; it’s a psychological mirror of the market, showing when traders may be overenthusiastic (overbought) or overly fearful (oversold). Since its introduction in 1978 by J. Welles Wilder Jr., RSI has become a cornerstone of technical analysis, used by retail traders, institutional investors, and even algorithmic systems across stocks, forex, commodities, and crypto.
2. History & Origin of RSI
RSI was introduced in Wilder’s famous book “New Concepts in Technical Trading Systems” (1978), alongside other indicators like the Average True Range (ATR) and Parabolic SAR. Wilder, a mechanical engineer turned trader, believed in quantifying market psychology.
Before RSI, momentum indicators existed, but they lacked a standardized scale. Wilder’s breakthrough was normalizing momentum into a range between 0 and 100, making it universally applicable and easier to interpret. Over time, RSI’s simplicity and adaptability allowed it to transcend asset classes, from Dow Jones stocks in the 80s to Bitcoin and Ethereum today.
3. Mathematical Formula & Calculation
The RSI formula is:
𝑅
𝑆
𝐼
=
100
−
(
100
1
+
𝑅
𝑆
)
RSI=100−(
1+RS
100
)
Where:
RS (Relative Strength) = Average Gain / Average Loss (over a set period, usually 14)
Steps:
Calculate the average of “up closes” and “down closes” for 14 periods.
Divide average gain by average loss = RS.
Plug RS into the RSI formula to scale between 0–100.
Example:
Average Gain = 1.5%
Average Loss = 0.75%
RS = 1.5 / 0.75 = 2
RSI = 100 – = 66.6
Thus, RSI = 67 indicates bullish momentum but not yet overbought.
4. Understanding RSI Levels
Above 70 → Overbought (possible correction)
Below 30 → Oversold (possible rebound)
Around 50 → Neutral (balance between buyers & sellers)
Some traders adjust:
80/20 levels for stronger trends
60/40 levels in trending markets (RSI may not touch extremes often)
RSI levels act as zones of probability, not absolute buy/sell signals.
5. RSI in Different Market Conditions
Trending Markets: RSI can remain overbought (>70) or oversold (<30) for extended periods. For example, in strong bull runs, RSI may hover around 70–80.
Ranging Markets: RSI oscillates smoothly between 30 and 70, making it excellent for mean-reversion strategies.
Volatile Markets: RSI signals can be whipsawed, requiring filters like moving averages or multiple timeframe confirmations.
6. RSI Trading Strategies
a) Overbought & Oversold Strategy
Buy when RSI < 30 (oversold) and price shows reversal.
Sell when RSI > 70 (overbought) and reversal signs appear.
Works best in sideways markets.
b) Divergence Strategy
Bullish Divergence: Price makes lower lows, RSI makes higher lows → reversal likely upward.
Bearish Divergence: Price makes higher highs, RSI makes lower highs → reversal likely downward.
c) RSI Swing Rejections
A method Wilder emphasized:
Bullish: RSI goes below 30, bounces back, rejects a second drop, then crosses above previous high.
Bearish: RSI goes above 70, falls, rejects second rise, then breaks lower.
d) RSI Trendlines & Breakouts
Traders draw trendlines on RSI itself, treating it like a price chart. Breakouts often lead price action.
e) RSI + Moving Averages
Use RSI to confirm MA crossovers. Example: RSI > 50 when 50-day MA crosses above 200-day MA strengthens bullish trend.
7. RSI for Different Timeframes
Intraday/Scalping (1–5 min): RSI is very sensitive. Traders use shorter settings (7-period RSI).
Swing Trading (1D–1W): Classic 14-period RSI works well. Divergences are powerful.
Long-Term Investing (1M): RSI identifies market cycles; buying when RSI < 30 on monthly charts often captures generational opportunities.
8. Combining RSI with Other Indicators
a) RSI + MACD
MACD confirms trend direction; RSI signals entry/exit.
Example: MACD bullish crossover + RSI near 40–50 = strong buy signal.
b) RSI + Bollinger Bands
RSI overbought + price at upper band → higher reversal probability.
RSI oversold + price at lower band → bounce likely.
c) RSI + Volume Profile
High volume at RSI extremes confirms stronger reversals.
d) RSI + Moving Averages
RSI trending above 50 while price is above MA = bullish confirmation.
Conclusion
The Relative Strength Index (RSI) remains one of the most effective momentum oscillators in trading history. From J. Welles Wilder’s manual calculations in the 70s to modern-day algorithmic applications, RSI has proven its adaptability.
Its power lies not in blindly buying at 30 or selling at 70, but in understanding context, divergences, swing rejections, and market psychology. While it has limitations in trending markets, when combined with other tools, RSI becomes a formidable ally.
For traders, RSI is more than a number. It’s a window into collective human behavior, showing how emotion, momentum, and probability interact to move markets. Whether you’re day-trading forex, swing-trading stocks, or investing in crypto, RSI remains a timeless guide to navigating uncertainty.
Explosive Volume Breakout StocksHello Traders!
Today’s session we have an explosive breakout on record volumes. The setup is not only backed by price action but also confirmed by multiple technical indicators such as RSI, Bollinger Bands, SuperTrend, VWAP, and BB Squeeze. Let’s decode this in detail 👇
________________________________________________________________________________
________________________________________________________________________________
JBM Auto Ltd (NSE: JBMA)
CMP: 712.95 (+13.92%)
Breakout: Strong 52-week volume breakout with momentum
Key Supports: 660 / 608 / 571
Key Resistances: 749 / 785 / 838
Setup Explanation
JBM Auto delivered a powerful bullish breakout candle backed by 20x volume against its average, confirming strong accumulation. The stock has broken a long-term downtrend with a surge in momentum. This looks like a technically strong breakout setup as per chart patterns, but risks remain. The chart highlights multiple bullish signals: RSI breakout ⚡ shows renewed strength. Bollinger Band breakout 📊 signals volatility expansion. Bullish SuperTrend & VWAP align with upward momentum. BB Squeeze Off 🔥 confirms the end of consolidation and beginning of a trending move. As long as the stock holds above 697–712, momentum is likely to extend towards higher resistances, with 843 as a near-term swing target. A sustained close below 607 would negate the bullish structure.
Latest Update – JBM Auto (JBMA)
JBM Auto is buzzing after its subsidiary JBM Ecolife Mobility secured a $100 million investment from IFC, marking IFC’s largest e-mobility funding in India. The capital will accelerate deployment of over 1,400 electric buses across multiple states, boosting JBMA’s already strong ₹12,900 crore order book. The stock surged ~9–11% on record volumes as the news reinforced confidence in India’s EV and green mobility push.
While momentum is strong, analysts also flag elevated valuations, thin margins, and execution risks, making it important for traders to watch key levels closely.
Investment Outlook & Conclusion
Bullish Case – The stock has given a 52-week breakout with 20x average volumes. If momentum sustains, it may attempt levels of ₹749 → ₹785 → ₹815 → ₹838 → ₹843.
Bearish Case – A sustained slip below ₹622 could weaken the structure and open downside risk.
Momentum Case – Current price action with heavy volumes indicates a short-term momentum phase. However, this is a high-risk, high-reward scenario suitable only for aggressive swing setups.
Perspective – Short-term structure is positive, while long-term outcomes will depend on execution of EV bus orders, government policy support, and maintaining profitability margins.
📊 STWP Trade Analysis – JBM Auto (JBMA)
👉 In my chart study, I have marked ₹732.80 as an entry level with ₹621.95 as an invalidation level.
👉 If the stock dips towards ₹627–607 (Pullback Zone), I will treat it as a conservative re-entry with tighter risk.
Invalidation Level: A sustained move below ₹607 will negate my bullish view.
⚠️ This is my swing trading approach as long as supports hold, shared only for learning how I structure trades. It is not a buy/sell recommendation.
________________________________________________________________________________
________________________________________________________________________________
⚠️ Disclaimer – Please Read Carefully
The information shared here is meant purely for learning and awareness. It is not a buy or sell recommendation and should not be taken as investment advice. I am not a SEBI-registered investment advisor, and all views expressed are based on personal study, chart patterns, and publicly available market data.
Trading — whether in stocks or options — carries risk. Markets can move unexpectedly, and losses can sometimes exceed the money you have invested. Past performance or past setups do not guarantee future results.
If you are a beginner, treat this as a guide to understand how the market works — practice on paper trades before risking real money. If you are experienced, always assess your own risk, position sizing, and strategy suitability before entering trades.
Consult a SEBI-registered financial advisor before making any real trading decision. By engaging with this content, you acknowledge full responsibility for your trades and investments.
💬 Found this useful?
🔼 Give this post a Boost to help more traders discover clean, structured learning.
✍️ Drop your thoughts, questions, or setups in the comments — let’s grow together!
🔁 Share with fellow traders and beginners to spread awareness.
👉 “If you liked this breakdown, follow for more clean, structured setups with discipline at the core.”
🚀 Stay Calm. Stay Clean. Trade With Patience.
Trade Smart | Learn Zones | Be Self-Reliant 📊
SENSEX 1D Time frame📉 Current Market Snapshot
Closing Price: ₹81,904.70
Day's Range: ₹81,641.38 – ₹81,992.85
52-Week High: ₹85,978.25
52-Week Low: ₹71,425.01
Previous Close: ₹81,548.73
Market Cap: ₹1,63,02,221 crore
P/E Ratio: 22.7
Dividend Yield: 1.18%
Price-to-Book Ratio: 4.35
1-Year Return: +0.47%
5-Year Return: +16.1%
10-Year Return: +12.2%
All-Time High: ₹85,978.25 (Sep 2024)
VWAP: ₹81,758.95
Volume: 12,856,963 shares
ATR (14): ₹5.72
Part 1 Candle Stick PatternIntroduction to Options
Financial markets offer multiple instruments to trade: equities, futures, commodities, currencies, bonds, and derivatives. Among derivatives, options stand out as one of the most flexible and powerful tools available to traders and investors.
An option is not just a bet on direction. It’s a structured contract that can protect a portfolio, generate income, or speculate on volatility. Unlike buying stocks, where profits are straightforward (stock goes up, you gain; stock goes down, you lose), option trading allows for non-linear payoffs. This means you can design trades where:
You profit if the market goes up, down, or even stays flat.
You control large exposure with limited capital.
You cap your risk but keep unlimited potential reward.
Because of this flexibility, options have become an essential part of modern trading strategies across the world, from Wall Street hedge funds to Indian retail investors trading on NSE’s F&O segment.
What are Options? Basic Concepts
At its core, an option is a contract between two parties:
Buyer of the option → Pays a premium for rights.
Seller (writer) of the option → Receives the premium but takes on obligations.
Definition
An option is a financial derivative that gives the buyer the right, but not the obligation, to buy or sell an underlying asset at a predetermined price (called strike price) on or before a certain date (expiry date).
Underlying assets can be:
Stocks (Infosys, Reliance, Apple, Tesla)
Indices (Nifty, Bank Nifty, S&P 500)
Commodities (Gold, Crude oil)
Currencies (USD/INR, EUR/USD)
Types of Options: Calls and Puts
There are only two fundamental types of options:
Call Option – Gives the right to buy the underlying asset at the strike price.
Example: Nifty is at 20,000. You buy a call option with a strike of 20,100. If Nifty rises to 20,400, you can buy at 20,100 and profit.
Put Option – Gives the right to sell the underlying asset at the strike price.
Example: Infosys is at ₹1,500. You buy a put option with a strike of ₹1,480. If Infosys falls to ₹1,400, you can sell at ₹1,480 and profit.
So, calls = bullish bets; puts = bearish bets.
AA+ Atul Auto Opportunity or a TRAP 📈 Cup & Handle Formation
This stock had a major fall from ₹850 (Aug 2024) to ₹410 (Mar 2025).
Since then, for almost 7 months (Mar–Sep), it remained range-bound.
✅ Last week, it finally gave a Breakout with the Highest Volumes – confirming strength.
Trade Levels:
🔹 LTP: ₹525
🔹 Buy on dips: till ₹475
🔹 Stop Loss (CLB): ₹415
🔹 Targets: ₹700 / ₹750 (to be reviewed once achieved)
⚠️ Note: Stick to levels, follow discipline & use TSL (Trailing Stop Loss) once targets start approaching.
Let’s stay hopeful that the move continues as per our expectations! 📈
💡 Liked the idea?
Then don’t forget to Boost 🚀 it!
For more insights & trade ideas,
📲 Visit my profile and hit Follow
Warm regards,
Naresh G
SEBI Registered Research Analyst
💬 Comment below if you want me to analyse any stock for you 🔍
ACME Solar - Cup & Handle Patter + IPO StrategyACME Solar is heading for a 75% jump from current price. Following are the factors:
Technical Analysis:
1. IPO Strategy - The price has crossed the high of its price post listing
2. Volumes during the fall was low and now it has started picking
3. Complex Cup & Handle pattern breakout
Fundamental Analysis:
1. First Independent Power Producing Company in India
2. Super Strategic locations in India
3. Increasing profits year on year
4. Recent 3k cr loan by SBI for its project
Keep following @Cleaneasycharts for more such stocks as we provide "Right Stocks at Right Time at Right Price"
Cheers!!
JM FINANCIAL LTD ANALYSISImagine a stock that went nowhere for 8 years, trapping capital and frustrating investors. Now, imagine that same stock breaking out of that decade-long range, hitting an all-time high, and showing explosive strength while the market chops.
This is the story of JM FINANCIAL LTD, and it's why it's my Chart of the Week.
The Analysis - The current price is ₹180, and the technical picture is compelling. Here's what I see:
🟢The Multi-Year Breakout: This isn't just any breakout. JM Financial has overcome a massive 8-year resistance zone.
Stocks that emerge from such long consolidations often have the fuel for extended, powerful trends.
🟢Textbook Retest: After making a new All-Time High, the stock has pulled back to retest the very resistance it just broke.
This is a classic "resistance-turned-support" setup, offering a well-defined entry point.
🟢Clear Relative Strength: While many stocks faltered in recent volatility, JM Financial has held firm. This resilience is a hallmark of a potential market leader. Its character has fundamentally changed from dormant to dynamic in just the last 3 months.
🟢Institutional Footprints: A crucial catalyst is the recent increase in FII (Foreign Institutional Investor) stakes.
When big money starts showing interest after a long period of quiet, it's a signal we must respect.
My personal take- I've watched this stock before. We even featured it in a previous COW, but the trade didn't work out. It lacked strength and we exited for a good loss. The market told us it wasn't ready.
Now, the evidence has changed dramatically. The strength is undeniable.
My trade plan- This setup offers a favorable Risk/Reward ratio right now because the stock is not over-extended.
🟢My Stop-Loss: My risk is clearly defined with a stop at ₹152.81.
🟢My Target: I'm anticipating an initial move of 35-40%, after which I will look to trail my stop to capture a potentially larger trend.
This is a high-conviction setup where technical strength, institutional interest, and a clear change in character are all aligning.
The Secret of Liquidity Grab – Why Price Hunts Highs Before FallHello Traders!
Have you ever noticed how the market first breaks a recent high, traps breakout traders, and then suddenly reverses? This is not random, it’s called a liquidity grab .
Understanding this concept can completely change how you see price action.
1. What is a Liquidity Grab?
Liquidity means orders in the market, stop losses, buy orders, sell orders.
When price hunts a previous high or low, it triggers stop losses and pending orders. This creates a sudden burst of liquidity.
Institutions use this liquidity to enter or exit large positions without causing slippage.
2. Why Price Hunts Highs Before Falling
At previous swing highs, many breakout traders place buy orders and short sellers place stop losses.
When the price spikes above that level:
Breakout traders enter long positions.
Short sellers’ stop losses get triggered (buy orders).
This creates a pool of buying liquidity. Once institutions have sold into this buying pressure, price often reverses sharply.
3. Why This Matters for Retail Traders
Most retail traders get trapped during these liquidity grabs.
They either chase breakouts too late or panic exit at the wrong time.
By recognizing this pattern, you can avoid being the liquidity and instead trade with the smart money.
4. How to Use This in Trading
Wait for the Grab: Don’t rush into a breakout. Wait to see if price quickly reverses after taking out a high/low.
Confirm With Volume: A liquidity grab often shows a sudden spike in volume followed by an opposite move.
Look for Rejection Candles: Pin bars, engulfing candles, or sharp wicks at highs/lows confirm the trap.
Rahul’s Tip:
Next time you see price breaking a high, don’t get excited. Ask yourself, is this a real breakout or just a liquidity grab? Waiting a little longer often saves you from being trapped.
Conclusion:
Liquidity grabs are the hidden traps of the market. Price doesn’t move randomly, it seeks liquidity first.
By understanding this, you can avoid becoming the victim and instead align yourself with the institutions.
If this post gave you clarity on liquidity grabs, like it, share your thoughts in the comments, and follow for more smart price action insights!
Apollo Micro System Again Upmove Apollo Micro Systems Earlier given near 250. Now Gain it's going Up after Taking Retracement. It's good sign. We can Enter at Cmp With 3 -5 % Stoploss.
It's in High Momentum.
Want to Learn more - how to Catch Such Stocks. Visit my Tradingview Profile .
Entry near 300 tgt 320 - 330 - 350 .
SL 5%
BAJFINANCE - BEARISH PREDICTIONAs BAJFINANCE is rising as of now above a 1000 mark, this is barely a liquidity sweep taking place and big institutions entering into sell on a larger scale. After this liquidity sweep is over, BAJFINANCE will start declining and a major decline is anticipated.
BAJFINANCE has several order blocks pending at weekly and monthly levels to be mitigated.
A short position is BAJFINANCE futures (maybe Nov) can be initiated on 15-Sep-2025 with a stop loss a little over closing of 12-Sep-2025 high.
TARGETS ARE GIVEN IN THE CHART.
📉 THIS CHANNEL IS ONLY FOR EDUCATIONAL PURPOSES.
Disclaimer: I am Not a SEBI registered analyst. I just share my positions to do paper trading and no where its a recommendation! Please do your own analysis before taking any trade.
AXISBANK is likely finishing Wave 4 around the channel baseAxis bank currently trading in the bottom of Rising Channel, Which is the possible termination point of wave 4. If Wave 4 holds around ₹1,050–1,080, then possible Target on upside (wave 5) will be arround 1350 & 1450 ( As per Fibonacci Extension)with a stoploss of 1010Rs.
Wave count
Wave 1: Started in 2020, ended Oct 2021.
Wave 2: Corrective pullback into 2022.
Wave 3: Strong impulsive rally start July 2022 & ended in July 2024.
Wave 4: Current correction in 2024–2025, touching the lower boundary of channel.
If valid, Wave 5 is pending, Which will move the stock in 1350 to 1450 Range
It's not a buy or sell recommendation ...For education only
Rate Gain - Short term Target 695/700=> Rate Gain, perfect trendline breakout as well as neckline (Resistance) breakout seen.
=> Now, it is ready to take retracement and the retracement level will be the FVG Area (between 565 & 589)
=> For best risk/reward, we can wait and take entry at the retracement level for the target 695/700
=> Stoploss is around 525
== EDUCATIONAL PURPOSE ONLY ==