#BANKNIFTY PE & CE Levels(02/02/2026)Bank Nifty is expected to open with a slightly positive gap, but the overall structure still reflects weakness after the sharp sell-off seen in the previous session. The index has decisively broken below the important 59050–58950 support zone, which earlier acted as a strong demand area. This breakdown has shifted the short-term trend clearly on the bearish side, and the gap-up opening should be treated more as a pullback rather than a trend reversal unless key levels are reclaimed.
From a technical perspective, the fall from the 59550–59600 region confirms strong supply at higher levels. The current price action is forming lower highs and lower lows on the 15-minute timeframe, indicating sustained selling pressure. Any bounce toward 58950–59050 is likely to face resistance, as this zone now turns into a supply area. If Bank Nifty fails to hold above this range after the opening, fresh selling pressure can re-emerge quickly.
On the downside, the immediate support lies near 58550–58450. A break below 58450 can accelerate the bearish momentum further, opening the gates for deeper targets around 58250, 58150, and potentially 58050. These levels are critical intraday and positional supports, and increased volatility can be expected if they are tested. As long as the index remains below 59000, bears will continue to have an upper hand.
On the upside, only a strong and sustained move above 59050 can provide some relief to the bulls. If Bank Nifty manages to reclaim and hold above 59050–59100, a short-covering bounce toward 59250, 59350, and 59450+ is possible. However, such a move should be confirmed with follow-through buying; otherwise, it may turn into a selling-on-rise opportunity.
Overall, despite the slightly gap-up opening, the market context remains cautious to bearish. Traders should avoid aggressive long positions near resistance zones and focus more on sell-on-rise or breakdown-based strategies. Strict risk management is essential, as volatility is expected to stay elevated after the recent sharp move. Patience during the opening minutes and confirmation of price action near key levels will be crucial for safer trades.
Community ideas

NIFTY : Trading levels and Plan for 02-Feb-2025Trend View : Sideways
🚀 Scenario 1: GAP UP Opening (100+ Points)
(Opening near / above 25,000)
🧠 Psychology
A gap up after a sharp fall usually signals short covering, but higher levels still carry strong supply pressure.
🟢 Bullish Plan
🔵 If price sustains above 25,010 on a 15-min closing basis
🔵 Expect upside towards 25,252
🔵 Momentum continuation only if 25,252 is broken with volume
🔴 Rejection Plan
🔴 Failure to sustain above 25,010
🔴 Expect pullback towards 24,847 – 24,695 (No-Trade Zone)
📌 Why this works
Gap-up moves fail if buyers are weak. Sustaining above resistance confirms real demand.
➖ Scenario 2: FLAT Opening
(Opening between 24,750 – 24,900)
🧠 Psychology
Flat opens after a sell-off indicate confusion and balance. Market first tests both sides for liquidity.
🟢 Upside Plan
🔵 Acceptance above 25,010
🔵 Targets: 25,252
🔵 Suitable for low-risk call spreads
🔴 Downside Plan
🔴 Breakdown below 24,695
🔴 Price may drift towards 24,611 → 24,531
📌 Special Note
🟠 24,695 – 24,847 is a No-Trade Zone
🟠 Avoid trades here unless price breaks decisively
🔻 Scenario 3: GAP DOWN Opening (100+ Points)
(Opening near / below 24,611)
🧠 Psychology
Gap down reflects fear-based selling. Smart money waits to see whether supports attract buyers or fail.
🟢 Bounce Setup
🔵 If 24,531 – 24,611 zone holds
🔵 Expect technical bounce towards 24,847 → 25,010
🔴 Breakdown Setup
🔴 Clean break below 24,531
🔴 Downside opens till 24,377
📌 Why this works
Strong supports either give sharp bounces or fast breakdowns—clarity comes with confirmation.
🛡️ Risk Management Tips for Options Traders
🟢 Trade only after first 15-min candle closes
🟢 Prefer defined-risk spreads in volatile markets
🟢 Avoid trading inside No-Trade Zones ❌
🟢 Risk maximum 1–2% capital per trade
🟢 Book partial profits near next resistance/support
🟢 Discipline > Prediction 📌
🧾 Summary & Conclusion
📌 Market remains volatile and reactive
📌 25,010 & 24,611 are the most important intraday levels
📌 Avoid trades in 24,695 – 24,847 zone
📌 Let price confirm direction, not emotions 📈
⚠️ Disclaimer
This analysis is strictly for educational purposes only.
I am not a SEBI registered analyst.
Please consult your financial advisor before taking any trades.
Market investments are subject to risk.

EUR/JPY Long: Riding the Momentum After Clean BOS The price action on EUR/JPY is currently displaying strong bullish momentum on the M15 timeframe. After a period of consolidation, the pair has successfully achieved a Break of Structure (BOS) to the upside, signaling a transition from a range-bound environment to an active uptrend.

XAUUSD GOLD Analysis on ( 01 Feb 2026)#XAUUSD UPDATEDE
Current price - 4894
If price stay below 5070, then next target 4700,4500 and above that 5400
Plan;If price break 4900-5000 area,and stay below 4950,we will place sell order in gold with target of 4700,4500 & stop loss should be placed at 5070

platinum to the 4000 if supported at 2030-2100platinum to the 4000 if supported at 2030-2100 based on fibonacci levels

Silver if consolidaes near 75 then next target 170-200if silver consolidates near 75 which it should, then next target will be around 170 to 200 based on fibonacci levels.

gold support at 4550-4600 for the target of 6200-6500gold should take support around 4550-4600 as per fibonacci and then if it consolidates at this level then potential next target is 6200-6500

CGPOWER: Major Rebound or Supply Trap?CGPOWER has staged a stunning recovery from recent lows, fueled by a robust Q3 Earnings beat and a massive 62% YoY jump in its order backlog (now at ₹15,753 Cr!).
While the fundamentals are firing, the technicals are at a crossroads.
📉 The "Supply Wall" Challenge
The Zone: 581 – 591
This is a historical supply zone where the stock has faced rejection multiple times. The stock hit an intraday high of 582.75 today, exactly where the "sellers' camp" begins.
Despite the rally, major brokerages like Nomura have slightly trimmed targets due to copper price inflation, which might keep the "Supply Zone" active in the short term.
🎯 Trading Roadmap
Bullish Case: A decisive daily close above 591 clears the historical overhead supply. If sustained, we are looking at a fast-track target toward 635+.
Bearish Case: If price fails to break 591 and starts showing weakness while going below 582 (rejection candles), expect a retracement to 556.
🛠 Action Plan
Support Level: Bulls remain in control as long as we hold above 574 (a bull mindset).
A confirmatory "full swing" short only opens up below 574 although short can be initiated at 582.

Decisive Levels Ahead in DELHIVERY :Breakout or Breakdown?DELHIVERY has rallied strongly from the recent low of 376 and is now approaching a decisive resistance zone at 428 – 431.50.
🔹 Bullish Setup:
A sustained move and hold above 431.50 will confirm strength.
Upside Target: 444
🔹 Bearish Setup:
Rejection from 428 – 431.50 followed by trading below this zone with volume will indicate weakness.
Downside Target: 408
⚠️ Important Level:
423 is a key psychological and intraday support level and should be closely monitored for price reaction.
👉 Price behaviour near 428 – 431.50 will decide the next directional move. Trade with volume confirmation.

KAYNES above 3427 – Breakout or Pullback?KAYNES Technology India has strong long-term earnings growth and good profit and revenue growth over recent years, supported by expanding electronics & EMS market trends.
The stock trades with a relatively high P/E but is backed by a firm order book and industry relevance.
Despite recent volatility and technical sell signals, some brokerages maintain positive long-term growth outlooks, and key quarterly results are due soon.
The stock has bounced off the recent low near 3300 after forming a double bottom, and is now approaching a historically important resistance zone at 3517–3568. Price action around this area will likely define the next directional move.
Bearish Scenario:
If KAYNES gets rejected at 3517–3568 and fails to hold, we could see a pullback toward 3427 — an important psychological and short-term support level, and the closest invalidation point for the bulls. If trades further down below 3427 then next target 3335
Bullish Scenario:
If price breaks above and sustains above 3568, that could unlock further upside with a target around 3690.
3427 will be a major pivot, bulls are likely to defend it strongly, and a clean break below with follow through selling would confirm bearish strength.
I am not sebi registered financial advisor.

XAUUSD "BULLISH" BIAS IDEA.Symbol + Timeframes: XAUUSD — HTF (Daily) & ITF (H4)**
Bias: Bullish (as long as price holds above key support zone)
Structure: – Higher lows intact on HTF
– Intermediate pullbacks LIQUIDATING "fomoing" retailers.
Key Levels: – Support: – 4629.989
And if it breaks , the confluential block at - 4633.96 and marked important swing low at - 4267.383.
– Invalidation: daily candle close below 4267.383
Context: – Price reacting to confluence (fair value gap + structural support + confluential block)
– Dollar bearish pullback adds supporting context
Plan: – Look for corrective pullback to support for continuation setups at smaller timeframe to frame trades, I've marked the path
– Targets based on structural levels
This is analysis, not trade advice.

MCX NSE/BSE(STOCK) EQUITY, GREAT BUYING OPPROTUNITY."a great dip occurred, and i have been waiting eagerly to buy at this price following the stock split. this is an excellent opportunity to purchase and target a sale price between 3,000 and 3,110. if you are a long-term buyer, you can hold for three to four years and potentially see your investment double, triple, or even quadruple in value. keep an eye on gold, silver, and other metal trading trends."

More fall coming below 24800As we can see NIFTY fell strongly which was well analysed in our post but now it has also broken our important demand zone making it even weaker hence we may expect NIFTY to fall further towards 24400-24200 respectively in coming trading sessions so plan your trades accordingly and keep watching everyone.

Gold Analysis & Trading Strategy | February 2✅ Recently, gold has experienced significantly amplified volatility due to the combined impact of news catalysts and market sentiment. Within one month, gold surged approximately $1,300, only to drop nearly $800 in the last two trading days of the month. This extreme price action once again highlights that in a high-volatility environment, respecting the market and strictly managing risk is far more important than simply predicting direction.
✅ From the monthly chart structure, a long upper-shadow bullish candle has formed, indicating strong selling pressure above and a technical need for a phase of pullback and correction. However, a pullback does not equal a trend reversal. To confirm a true trend reversal, price must effectively break below the key structural level at 4300. Before that happens, the higher probability scenario is prolonged high-level consolidation, allowing time and price to correct the previous overextended rally. The sharp rise at the beginning of the week clearly deviated from technical rhythm, while the weekend’s sharp drop was essentially a technical correction of that irrational surge. No matter how strong the bullish trend appears, price will eventually return to structure and cycle.
✅ If the recent pace of decline continues, this pullback could theoretically reach a 20% correction. Looking back to gold’s rally from $1,045 in 2015, every major correction since then has remained within this range. Based on the recent high of 5,596, a 20% pullback projects to around 4,480 — an area that would represent a highly attractive medium-term positioning zone. Trading requires bold assumptions and cautious verification, and the final outcome must be validated by the market over time.
🔴 Resistance: 5100–5110
🟢 Support: 4530–4580
✅ Trading Strategy Reference:
In the current high-volatility environment, it is recommended to use a scaled entry approach combined with strict risk control, avoiding emotional chasing of price.
🔰 Short Strategy (Sell on Rebound)
👉 Entry Zone: 5100–5105, build short positions in batches
🎯 Target 1: 4900
🎯 Target 2: 4700
🎯 Extended Target: 4535 (if breakdown occurs)
📍 Logic:
This area represents a short-term structural resistance zone. If price rebounds and shows rejection here, it offers an opportunity to participate in the corrective move.
🔰 Long Strategy (Buy on Pullback)
👉 Entry Zone: 4535–4550, build long positions in batches
🎯 Target 1: 4700
🎯 Target 2: 4900
🎯 Extended Target: 5000 (if breakout occurs)
📍 Logic:
This zone is close to a strong stage support area. If price stabilizes after retracing into this region, it offers a technical rebound opportunity.
✅ Risk Control Reminders
👉 Use scaled entries; avoid heavy single-point positions
👉 Strictly set stop losses to control drawdown risk
👉 In extreme volatility, rhythm management is more important than profit expectations
👉 The more violent the market, the more discipline and restraint are required.

Ujjivan Small Finance cmp 62.35 by Weekly Chart view since listeUjjivan Small Finance cmp 62.35 by Weekly Chart view since listed
- Support Zone 54.50 to 61.50 Price Band
- Resistance Zone 64 to ATH 68 Price Band
- Bullish Rounding Bottoms by Support Zone neckline
- Bullish Cup and Handle within the 2nd Rounding Bottom
- Falling Resistance Trendlines Breakout seems well sustained
- Volumes spiking and well above the average traded quantity
- Rising Price Channel has been well respected and also sustained
- High Target probable by Bullish Chart setup with Support Zone Breakout earlier Resistance Zone

BTCUSDT MOST CRITICAL SUPPORT TO HOLD BTC is at a very critical support around 77K. If BTC shows strong buying volume and bounces from this level, we can expect a relief rally from here. However, if this support breaks down, further downside is likely, and altcoins may see deeper corrections.

NIFTY- Intraday Levels - 2nd Feb 2026If NIFTY sustain above 25778 then above this bullish then 24971/92 then 25022/37 then again a strong range 25087/114 or 25174 above this more bullish then above this wait more levels marked on chart
If NIFTY sustain below 24732 below this bearish then around 24682/52 below this more bearish then 24511/487 very strong level 24405/381 or 24340/28 this is extremely strong range as this was the low made on 8th Aug 2025 and gave a rally of 8+%. Unless it opens below this or breakes with big candle it will not be easy for market to go below this, below this more bearish below this wait
Consider some buffer points in above levels.
Please do your due diligence before trading or investment.
**Disclaimer -
I am not a SEBI registered analyst or advisor. I does not represent or endorse the accuracy or reliability of any information, conversation, or content. Stock trading is inherently risky and the users agree to assume complete and full responsibility for the outcomes of all trading decisions that they make, including but not limited to loss of capital. None of these communications should be construed as an offer to buy or sell securities, nor advice to do so. The users understands and acknowledges that there is a very high risk involved in trading securities. By using this information, the user agrees that use of this information is entirely at their own risk.
Thank you.

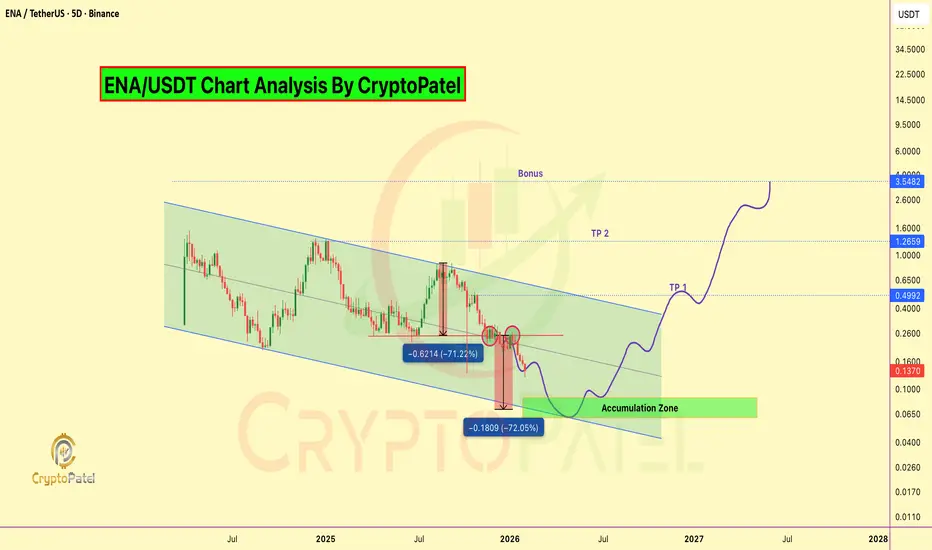
$100M Private Sale at $0.40... Now CMP Trading at $0.135$100M Private Sale at $0.40... Now Retail Can Buy at $0.135. First Time Retail Gets Better Entry Than VC
#ENA Is Trading Inside A Long-Term Descending Channel On The HTF Chart Since 2024.
Price Has Completed A Deep Multi-Leg Correction And Is Now Testing A Major Demand Zone At Channel Support.
Current Technical Structure:
✅ Descending Channel Intact
✅ ~92% Down From ATH
✅ Price Near Lower Channel Support
✅ Strong Accumulation Zone: $0.08–$0.06
✅ H&S Bearish Target For Long Term Accumulation is $0.07
✅ ~66% Below Private Investor Price (VC Discount Zone)
✅ Trump's World Liberty Financial Bought ~$5.15M ENA At ~$0.891 (Now ~$0.135 → ~85% Drawdown / ~$4.37M Unrealized Loss)
CryptoPatel Targets: $0.50 / $1.26 / Bonus $3+
As Long As ENA/USDT Holds Above The Accumulation Zone, A Relief Rally And Trend Reversal Remain Probable.
Why It Could Pump
✅ EURONEXT:USDE is now 3rd Largest Stablecoin ($5.8B)
✅ Fee Switch Coming Q1 2026 - stakers Get Protocol Revenue
✅ Building Own Blockchain
✅ Institutional Product (iUSDe) Launching Soon
✅ Major TradFi Backing
⚠️ Risks to Watch
❌ Heavy token unlocks until 2028
❌ Down 85% from ATH
❌ Similar model concerns to Terra/Luna
❌ Depends on positive funding rates
Invalidation & Risk Note: This is a high-risk, high-reward setup with elevated volatility. Strict risk management is essential.
TA Only. Not Financial Advice. ALWAYS DYOR.
Bitcoin - Inverted C&HBitcoin :
Inverted Cup and Breakdown possibility
Looks weak below 73500
60K looks feasible !

Take Liquidity or Become Liquidity In this video I am talking about a Solid concept / strategy know as Liquidity .
General trends of the markets in terms of index are discussed in this videos and no bias or directions are given

Angel One - Confluence SupportAngel One :
Just Bounced bank from Confluence support
Looks weak below 2200
Triangle breakdown possibility

NIFTY Pullback & Union Budget 2026: 5 Percent correctionNIFTY has now tagged the first meaningful pullback zone from its recent peak. The correction meter touched the 5 percent area intraday on 21st January and closed slightly below that mark. A 5 percent dip is common in strong trends, but the context matters: We are near Union Budget 2026.
Quick stats from NIFTY history (1990 to 2026)
Most years see a meaningful dip: 10 percent or more happened in 31 out of 37 years.
Typical yearly shakeout is not small: median annual max correction is about 16 to 17 percent.
Deep corrections are not rare: 30 percent or more happened in 10 out of 37 years (roughly 1 in 4 years).
Where we are now
From the recent peak near 26,373, NIFTY closed around 25,157, which is roughly a 4.6 percent correction. The intraday low was close to a 5.5 percent correction.
Key correction zones from the same peak
5 percent zone: around 25,055
10 percent zone: around 23,736
15 percent zone: around 22,417
20 percent zone: around 21,099
Why the 5 percent zone matters
This is the first area where many dip buyers typically show up. It often produces a reaction bounce, but that bounce does not always end the correction. The next few sessions are about judging whether the market is stabilizing or simply pausing before another leg down.
What usually happens after a fast 5 percent dip
When NIFTY reaches 5 percent down quickly after making a peak, the market tends to become swingy. A bounce is common, but repeated tests are also common. In those situations, the first 5 percent tag is often the start of a correction phase rather than the final low. That is why it helps to think in zones instead of expecting one perfect entry.
How to use this for buying plans
If your goal is yearly investing and not short-term trading, avoid treating 5 percent as the only buy point. A better approach is staged buying.
Example staged plan:
At 5 percent: start small
At 10 percent: add more
At 15 to 20 percent: add again if the market goes there
This keeps you invested if the market bounces, but also keeps capital for deeper zones if the correction continues.
Budget season: is there a pre-budget rally?
Many traders expect strength before the Budget, but historically it has not been a reliable pattern. In broad terms, the market often behaves more like this: late January is frequently mixed to weak, while early February has shown a better tendency to recover. The practical takeaway is simple: do not assume a pre-budget ramp. Focus on structure and the correction state instead.
What I am watching next
1) Will this correction quickly retreat under 4 percent and hold? That supports the healthy dip scenario.
2) Will bounces fail and pullbacks retest the lows repeatedly? That points to chop and deeper volatility.
3) Are we going to start seeing closes that push the correction beyond 6 to 8 percent? That increases the odds of a rotation toward 10 percent.

SPY Weekly levels ( 2 Feb - 7 Feb 2026)
Here’s weekly levels for SPY —
1) Bull Case — “Acceptance above equilibrium → reclaim upper rail”
Trigger: Hold above 692.18–692.28, then reclaim and accept above 698.48–698.68.
Targets: 704.98
Stretch (only if momentum persists): 711.28
Notes: The 698.5–698.7 zone is the “decision ceiling.” Clean acceptance above it opens the path to 705 first; 711 is only for a strong trend week.
2) Bear Case — “Rejection at equilibrium / failed reclaim”
Trigger: Lose acceptance at 692.18–692.28 (back below equilibrium), then lose 685.68–685.88.
Targets: 679.38
Extension: 672.88 is the “true unwind” zone; below that is outside this week’s map.
Notes: If price keeps getting rejected near 692 and can’t reclaim it, the bias shifts to selling bounces until 685.7–685.9 breaks.
Invalidation
Long thesis weakens on acceptance back below 692.18
Short thesis weakens on acceptance above 698.68
