Belrise - Cup & Handle BreakoutBelrise :
Cup and Handle Breakout in progress
Looks good above 195, currently at All time High
Community ideas

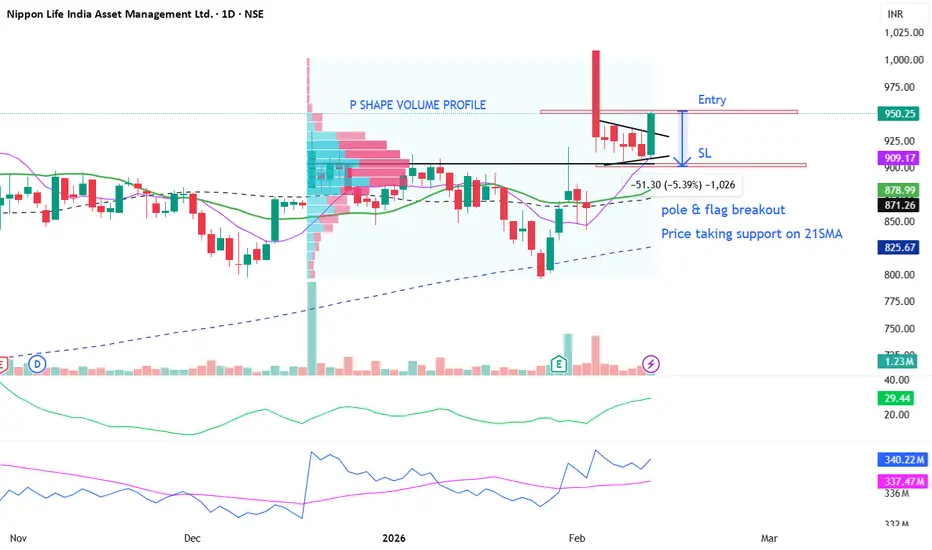
Pole & flag breakoutPrice above 20, 50, 200 SMA.
RSI > 60 in weekly and daily.
price taking support on 21 SMA during formation of Flag.
Here, we are ignoring that large gapup and taking only close price in consideration.
Adx(5) > 20
OBV > 21 & 50 SMA.
Code green !!
Pole & Flag breakoutprice above 20,50 , 200 SMA.
RSI > 60 in weekly and daily.
adx (5) > 25.
OBV crossed 21MA
Code green !!

And the SLUGGISHNESS continues As expected NIFTY remained sideways throughout the day which was very analysed in our previous post and is likely to remain the same until and unless it hits the supply or demand zone or breaks below or above to start a new rally so plan your trades accordingly and keep watching everyone.

NIFTY Levels for Today
Here are the NIFTY's Levels for intraday (in the image below) today. Based on market movement, these levels can act as support, resistance or both.
Please consider these levels only if there is movement in index and 15m candle sustains at the given levels. The SL (Stop loss) for each BUY trade should be the previous RED candle below the given level. Similarly, the SL (Stop loss) for each SELL trade should be the previous GREEN candle above the given level.
Note: This idea and these levels are only for learning and educational purpose.
Your likes and boosts gives us motivation for continued learning and support.
BANKNIFTY Levels for Today
Here are the BANKNIFTY’s Levels for intraday (in the image below) today. Based on market movement, these levels can act as support, resistance or both
Please consider these levels only if there is movement in index and 15m candle sustains at the given levels. The SL (Stop loss) for each BUY trade should be the previous RED candle below the given level. Similarly, the SL (Stop loss) for each SELL trade should be the previous GREEN candle above the given level.
Note: This idea and these levels are only for learning and educational purpose.
Your likes and boosts gives us motivation for continued learning and support.

PCBL: Reversal Structure and Key LevelsThe stock of PCBL has experienced a significant decline from the ₹437 level, followed by a notable recovery from a major support zone, often referred to by traders as a discount or value area. Recent price behaviour indicates the possibility of a trend reversal supported by multiple technical factors.
After a prolonged down move, the stock has reacted strongly from a key bottom support level.
On the weekly chart, the formation of an inverted hammer at this zone adds weight to the expectation of a potential reversal, as this pattern often appears near the end of extended downtrends.
A bullish MACD crossover has been observed on the weekly timeframe, signalling a possible shift in medium‑term momentum. On the daily chart, the RSI has moved above 60, reflecting strengthening bullish sentiment without reaching extremely overbought conditions.
Based on previous price action, an immediate supply zone near ₹341 may act as the first area where sellers could reappear.
Price behaviour around this level will be important for assessing the sustainability of the recent bounce.
Key Levels:
Immediate Supply / Resistance Zone: ₹341
Major Support Zone: ₹255
Disclaimer: This analysis is intended solely for educational and informational purposes. It does not constitute financial advice or a recommendation to buy, sell, or hold any security. Market participants should evaluate risks independently and consult a licensed financial professional before making investment decisions.

NIFTY : Trading levels and Plan for 12-Feb-2026NIFTY Trading Plan – 12 Feb 2026
(Timeframe: 15-Min | Instrument: NIFTY 50 | Educational Purpose Only)
🔑 Key Intraday Levels (From Chart)
🟢 26,156 – Last Intraday Resistance / Supply
🟢 25,993 – Opening Resistance / Pivot
🟠 25,859 – 25,917 – Opening S/R (No-Trade Zone)
🟢 25,749 – Last Intraday Support
🟢 25,677 – Major Breakdown Support
🧠 Market Structure & Price Psychology
NIFTY has shown a strong bullish recovery, forming higher highs & higher lows.
Currently, price is consolidating just below a major supply zone (26,156).
👉 Buyers are in control — but breakout confirmation is pending.
👉 Resistance acceptance = continuation
👉 Rejection = pullback rotation
🚀 Scenario 1: GAP UP Opening (100+ Points)
(Opening near / above 26,000)
🧠 Psychology
Gap up near resistance shows bullish sentiment + short covering, but sellers defend supply zones aggressively.
🟢 Bullish Plan
🔵 Sustaining above 25,993 (15-min close)
🔵 Upside opens towards 26,156
🔵 Acceptance above → Momentum expansion
🔴 Rejection Plan
🔴 Failure near 26,156
🔴 Pullback towards 25,993 → 25,917
📌 Why this works
Breakouts succeed only when price is accepted above supply, not just gap driven.
➖ Scenario 2: FLAT Opening
(Opening between 25,900 – 25,980)
🧠 Psychology
Flat opening inside supply shows indecision & liquidity absorption.
🟠 No-Trade Zone
🔸 25,859 – 25,917
🔸 Expect whipsaws & fake breakouts ❌
🟢 Upside Plan
🔵 Break & hold above 25,993
🔵 Targets: 26,156
🔴 Downside Plan
🔴 Breakdown below 25,859
🔴 Drift towards 25,749
📌 Why this works
Ranges expand after consolidation — patience improves entries.
🔻 Scenario 3: GAP DOWN Opening (100+ Points)
(Opening near / below 25,859)
🧠 Psychology
Gap down signals profit booking, but demand zones attract dip buyers.
🟢 Bounce Setup
🔵 If 25,859 holds
🔵 Expect bounce towards 25,917 → 25,993
🔴 Breakdown Setup
🔴 Clean break below 25,749
🔴 Downside opens towards 25,677
📌 Why this works
Strong supports create either sharp reversals or fast breakdown moves.
🛡️ Risk Management Tips (Options Traders)
🟢 Wait for first 15-min candle confirmation
🟢 Prefer defined-risk spreads in volatile openings
🟢 Avoid trading inside No-Trade Zones ❌
🟢 Risk only 1–2% capital per trade
🟢 Book partial profits at next levels
🟢 Discipline > Prediction 📌
🧾 Summary & Conclusion
📌 NIFTY is bullish but near major resistance
📌 25,993 & 25,859 are key intraday triggers
📌 Break above 26,156 confirms continuation
📌 Trade reaction, not assumption 📈
⚠️ Disclaimer
This analysis is strictly for educational purposes only.
I am not a SEBI registered analyst.
Please consult your financial advisor before taking any trades.
Market investments are subject to risk.

EURUSD Weekly Outlook (SMC + HTF Resistance Confluence)📊 Market Structure Overview
EURUSD is currently trading into a major weekly supply / resistance zone while respecting a long-term descending trendline connecting multiple swing highs. Price has approached this area several times historically and reacted with strong bearish momentum — making it a high-probability reaction zone on the HTF.
🔎 Key Technical Observations
Price is testing a multi-year descending trendline → strong dynamic resistance.
Presence of SMC concepts on chart: BOS / CHoCH and visible FVG zones below current price.
Current rally looks like a liquidity grab into premium pricing within weekly structure.
Equal / relative highs marked — potential buy-side liquidity before reversal.
HTF structure overall remains bearish / corrective, not a confirmed bullish trend reversal.
📍 Trading Plan (Idea — Not Financial Advice)
➡️ Primary Bias: Bearish from weekly resistance.
➡️ Entry Concept:
Wait for lower-timeframe confirmation such as:
Bearish engulfing candle
Pin bar rejection
Market structure shift / CHoCH
➡️ Targets:
First reaction → mid FVG / internal demand
Major target → HTF demand zone around parity region (~1.00 area)
Extended bearish scenario → deeper weekly demand near lower red zone
⚠️ Risk Factors / Invalidation
Strong weekly close above trendline and resistance zone.
Bullish continuation with sustained higher highs + higher lows on HTF.
Macro catalysts (ECB/Fed policy shifts) could accelerate volatility.
🧠 Final Thoughts
This setup aligns with a classic premium sell model — price rallies into HTF supply + trendline confluence before targeting imbalances below. Patience is key: confirmation matters more than prediction.

Gold Squeezing Into Resistance – Breakout Loading?Gold is currently compressing between a rising short-term channel and a broader resistance trendline. Price is holding structure well, and buyers are gradually pushing higher lows into resistance.
What makes this setup interesting is the tightening range. When price compresses like this, it usually leads to expansion. If buyers manage to break and hold above the upper trendline, the upside continuation zone marked on the chart becomes active.
RSI previously showed bearish pressure, but momentum has stabilized and is now recovering. That shift supports the breakout scenario — as long as structure remains intact.
No need to predict aggressively.
If resistance breaks and holds, continuation is valid.
If price drops back below the structure and the marked risk area, the idea is invalid.
Simple structure. Clear risk. Let price confirm.
⚠️ Disclaimer
This analysis is for educational purposes only. Trading involves risk. Always manage position size and follow your own risk management plan.

Dynamic cables run for 9-12 % Dynamic cables looks good in chart and taking support at the bottom.
And the big buildings of volume at the bottom definitely signals a pull of 10% atleast. Keep watch and market the levels.
2 nearby targets are 335 and 345 looking to see in very few days.

Bajaj finance: is retest done or pending?As per chart reading we can see that BAJFIN completed the retest in the market volatility of the last few weeks, be it in budget or US-INDIA trade deal.
it is gearing up for new rally.
have a 10% SL and it can give return more than 50%.
first tareget should be 25% then 38% and last target should be 50% of the current price.
current price : 967
SL: 870
Target 1: 1208
Target 2: 1334
Target 3 (Final target) :1450

PREMIERENE: Bulls Defend 776 Support,Is 805 Next?PREMIERENE is currently showing a classic "volatile consolidation" pattern. After a strong bounce from the 766 level that peaked at 833, the stock faced significant selling pressure today, sliding back to test the strength of its recent recovery.
The price action has narrowed down to a decisive pivot zone between 772.50 and 776 . Today’s session confirmed the importance of this area as the stock managed to find intraday buyers right at this level with sentimental level at 782
Bullish Scenario: If the stock maintains its footing above 776, the immediate target remains 805. A sustained move above this could restart the further momentum towards the recent high of 833.
Bearish Scenario: A breakdown and trade below 772.50 would likely trigger a deeper correction. In this case, the next logical support sits at 738, which aligns with previous structural lows.
Joint Venture & Expansion: The company recently announced a JV with BA Prerna Renewables and has successfully commissioned a new 400 MW solar cell facility in Telangana. This brings their total cell capacity to 3.6 GW, supporting their aggressive ₹11,000 crore expansion plan.
Earnings Momentum: In the latest Q3 FY26 earnings (released Jan 23), Premier Energies reported EPS that exceeded analyst expectations, though revenue slightly lagged.
Institutional Interest: Despite recent volatility, 90% of analysts track the stock with a "BUY" rating, with institutional giants like Quant Mid Cap Fund holding significant stakes.

XAUUSD 4H — Quick Take
Gold is testing the upper boundary of a rising wedge / channel around 5090–5100 after a choppy climb.
Rejection here = likely pullback toward 5020 → 4950 (channel support).
Clean breakout & close above 5140 = continuation toward new highs.
Bias: Short-term correction before continuation unless 5140 breaks.

Bearish Hammer – EMA Confirmation Setup🧭 Overview
The Bearish Hammer pattern appears near the top of an upward move and signals potential buyer exhaustion. When combined with EMA High–Low band alignment, it provides a structured approach to identify early downside pressure.
⸻⸻⸻⸻⸻⸻⸻⸻⸻⸻⸻⸻⸻⸻
📘 Concept
A Bearish Hammer forms after an advance, where price attempts to move higher but faces strong rejection. The long upper wick reflects selling pressure entering the market.
To increase reliability, this setup is combined with the EMA High–Low band:
• The hammer should form above the EMA band.
• The EMA band should not touch the hammer body.
This alignment strengthens bearish bias within the broader structure.
⸻⸻⸻⸻⸻⸻⸻⸻⸻⸻⸻⸻⸻⸻
📊 Chart Explanation
1️⃣ A Bearish Hammer forms near the top of the move, indicating buyer exhaustion.
2️⃣ The candle appears above the EMA High–Low band, supporting bearish alignment.
3️⃣ The hammer’s low acts as the validation line for downside confirmation.
4️⃣ A close below the validation line confirms weakness.
5️⃣ A break above the hammer high acts as the devalidation level and cancels the setup.
⸻⸻⸻⸻⸻⸻⸻⸻⸻⸻⸻⸻⸻⸻
📝 Summary
Bearish Hammer near highs signals early selling pressure.
EMA band alignment improves structure clarity.
Close below the hammer low confirms the setup.
Break above hammer high invalidates the pattern.
⸻⸻⸻⸻⸻⸻⸻⸻⸻⸻⸻⸻⸻⸻
⚠️ Disclaimer
📘 For educational purposes only.
🙅 Not SEBI registered.
❌ Not a buy/sell recommendation.
🧠 Purely a learning resource.
📊 Not Financial Advice.

A reaction at Poi levels necessary to execute this position.Usually these are the levels of the next bull run in crypto but considering current happenings, things might take time or turn ugly.
POI fractal and structure mapping

XAUUSD (Gold Spot) – 1H Chart Analysis & Trade Idea Gold has shifted into a short-term bullish structure after forming a higher low and reclaiming the key support zone. Price is consolidating above the former resistance, which is now acting as support—a typical continuation setup.
Key Levels
Support / Entry Zone: 5,000 – 5,030 (blue zone, prior resistance turned support)
Stop Loss: Below 4,950 (red zone, structure invalidation)
Target: 5,100 – 5,150 (green demand/supply objective)
Trade Idea
Bias: Bullish continuation
Entry: Buy on pullback into the support zone or on bullish confirmation above it
Stop Loss: Below the marked stop-loss zone to protect against a breakdown
Take Profit: Target the upper demand zone for continuation upside
Confluence
Break-and-retest of resistance as support
Higher low formation on H1
Momentum holding above the support line
Risk Management
Maintain disciplined position sizing. If price closes decisively below the support zone, the bullish setup is invalidated.
This idea is based on technical structure and zone analysis. Always manage risk according to your trading plan.

Bharat Forge.. Ready for upmove..Bharat Forge.. Has formed a Cup & handle pattern..
Breakout is expected soon..
If it gives breakout then as per the pattern first target comes at around 1550 to 1560..
Lets see whether market support this sentiment or not ( Fingers Crossed ) :)
Book your profit accordingly..

Bull run might continue in 60 degrees upwardsTrend line breakout but with low volume So, Entry with half qty is good
crossing of the recent highs gives more confirmation to the upside
follow with mentioned target and stoploss

Rejection at Resistance, Short Setup Toward Mid-Range Support Overview
On the 45-minute timeframe, Gold is trading within a broader range structure:
Major Support Zone: 4,600 – 4,670 (strong demand base)
Mid-Range Support / Target Zone: ~4,880 – 4,920
Major Resistance Zone: 5,100 – 5,150 (supply area)
Price recently rallied from the lower support zone (~4,600 area), formed a higher low, and pushed back into the key resistance region around 5,100.
📈 Current Price Action
Price tapped into the 5,100–5,150 resistance zone
Rejection wick and pullback forming
Momentum appears to be slowing near supply
Structure suggests possible lower high formation on this timeframe
This area has previously acted as a distribution zone, making it technically significant.
🎯 Trade Idea Illustrated on Chart
Bias: Short (counter-move within range)
Entry: Near 5,100–5,120 resistance after confirmation (rejection / bearish candle close)
Target: 4,880–4,920 mid-range support zone
Extended Target (if breakdown continues): 4,650 major support
🧠 Why This Setup Makes Sense
Price is reacting at a proven resistance area.
Market is still broadly ranging (not clean breakout structure).
Risk-to-reward favors shorting near supply rather than buying into resistance.
Mid-range inefficiency/support provides a logical first take-profit level.
⚠️ Invalidation
Strong breakout and 45m close above 5,150
Follow-through bullish momentum with acceptance above resistance
If that happens, structure shifts toward continuation rather than rejection.
📌 Summary
Gold is testing a key resistance zone inside a larger range. The chart suggests a potential rejection and pullback toward the 4,900 region before any larger directional decision.

TORNTPOWER: Analyzing the 1489-1509Since October 2025, TORNTPOWER has been on a sustained bullish trajectory, consistently forming higher highs. This momentum reached a boiling point today, February 10, 2026, as the stock surged over 4% to test a historically significant supply zone.
Surging Profits: Torrent Power reported a massive 93% YoY jump in net profit for Q3 FY26, reaching ₹712.16 crore.
Dividend Reward: The Board has declared an interim dividend of ₹15 per share (Record Date: Feb 16).
Expansion Mode: Authorization to raise up to ₹7,000 crore through NCDs signals aggressive growth plans in the renewable and transmission sectors.
Derivatives Surge: We’ve seen a 24% increase in Open Interest (OI) today, indicating that fresh "long" positions are being built by big players as the stock challenges its resistance.
The 1489 – 1509 zone is a historical "supply wall" where sellers have previously overwhelmed buyers.
Scenario A: The Bullish Breakout (Stay Above 1509)
If the price successfully closes and sustains above 1509.25, it confirms that the historical supply has been absorbed.
Entry: Above 1509
Target: 1575
Logic: The 93% profit growth serves as the "fuel" for this breakout, likely attracting institutional buyers.
Scenario B: The Rejection (Stay Below 1489)
If the stock fails to clear this hurdle and remains below 1489, expect a period of "Profit Booking" after the post-earnings rally.
Entry: Short below 1489 (or exit longs)
Target: 1435
Logic: A failure here would form a rejection wick, leading the price back to its immediate support zone.
Valid for 1-4 trading days

XAUUSD GOLD Analysis on (11 Feb 2026)#XAUUSD UPDATEDE
Current price - 5054
If price stay above 5015,then next target 5080 and 5110 and below that 4970
Plan1;If price break 5040-5050 area,and stay above 5050 we will placed buy order in gold with target of 5080 and 5110 & stop loss should be placed at 5115

Syrma Price Aggressively moves after taking inducement and Sweep Previous Structure on Weekly Time Frame .
View Bullish
