XAUUSD (Gold Spot) – 1H Chart Analysis & Trade Idea Gold has shifted into a short-term bullish structure after forming a higher low and reclaiming the key support zone. Price is consolidating above the former resistance, which is now acting as support—a typical continuation setup.
Key Levels
Support / Entry Zone: 5,000 – 5,030 (blue zone, prior resistance turned support)
Stop Loss: Below 4,950 (red zone, structure invalidation)
Target: 5,100 – 5,150 (green demand/supply objective)
Trade Idea
Bias: Bullish continuation
Entry: Buy on pullback into the support zone or on bullish confirmation above it
Stop Loss: Below the marked stop-loss zone to protect against a breakdown
Take Profit: Target the upper demand zone for continuation upside
Confluence
Break-and-retest of resistance as support
Higher low formation on H1
Momentum holding above the support line
Risk Management
Maintain disciplined position sizing. If price closes decisively below the support zone, the bullish setup is invalidated.
This idea is based on technical structure and zone analysis. Always manage risk according to your trading plan.
Community ideas
Bharat Forge.. Ready for upmove..Bharat Forge.. Has formed a Cup & handle pattern..
Breakout is expected soon..
If it gives breakout then as per the pattern first target comes at around 1550 to 1560..
Lets see whether market support this sentiment or not ( Fingers Crossed ) :)
Book your profit accordingly..
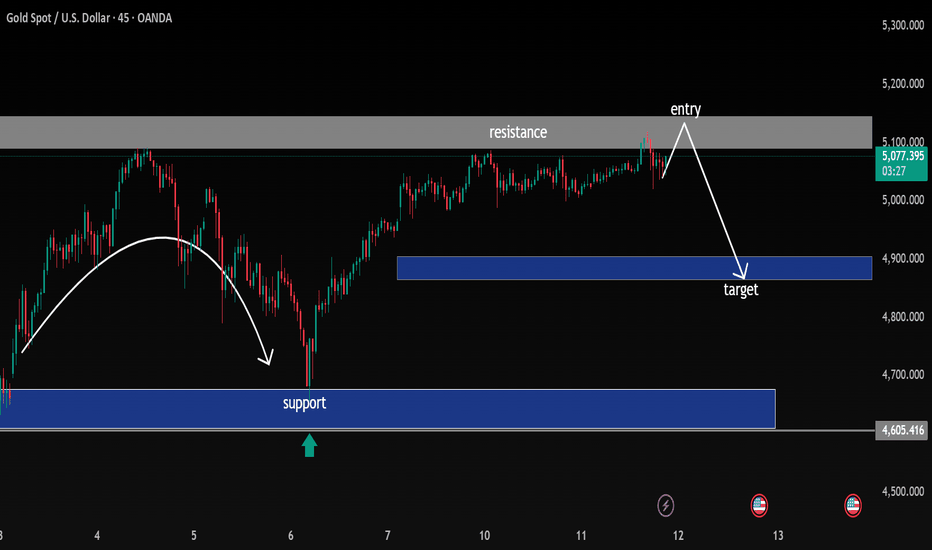
Rejection at Resistance, Short Setup Toward Mid-Range Support Overview
On the 45-minute timeframe, Gold is trading within a broader range structure:
Major Support Zone: 4,600 – 4,670 (strong demand base)
Mid-Range Support / Target Zone: ~4,880 – 4,920
Major Resistance Zone: 5,100 – 5,150 (supply area)
Price recently rallied from the lower support zone (~4,600 area), formed a higher low, and pushed back into the key resistance region around 5,100.
📈 Current Price Action
Price tapped into the 5,100–5,150 resistance zone
Rejection wick and pullback forming
Momentum appears to be slowing near supply
Structure suggests possible lower high formation on this timeframe
This area has previously acted as a distribution zone, making it technically significant.
🎯 Trade Idea Illustrated on Chart
Bias: Short (counter-move within range)
Entry: Near 5,100–5,120 resistance after confirmation (rejection / bearish candle close)
Target: 4,880–4,920 mid-range support zone
Extended Target (if breakdown continues): 4,650 major support
🧠 Why This Setup Makes Sense
Price is reacting at a proven resistance area.
Market is still broadly ranging (not clean breakout structure).
Risk-to-reward favors shorting near supply rather than buying into resistance.
Mid-range inefficiency/support provides a logical first take-profit level.
⚠️ Invalidation
Strong breakout and 45m close above 5,150
Follow-through bullish momentum with acceptance above resistance
If that happens, structure shifts toward continuation rather than rejection.
📌 Summary
Gold is testing a key resistance zone inside a larger range. The chart suggests a potential rejection and pullback toward the 4,900 region before any larger directional decision.
TORNTPOWER: Analyzing the 1489-1509Since October 2025, TORNTPOWER has been on a sustained bullish trajectory, consistently forming higher highs. This momentum reached a boiling point today, February 10, 2026, as the stock surged over 4% to test a historically significant supply zone.
Surging Profits: Torrent Power reported a massive 93% YoY jump in net profit for Q3 FY26, reaching ₹712.16 crore.
Dividend Reward: The Board has declared an interim dividend of ₹15 per share (Record Date: Feb 16).
Expansion Mode: Authorization to raise up to ₹7,000 crore through NCDs signals aggressive growth plans in the renewable and transmission sectors.
Derivatives Surge: We’ve seen a 24% increase in Open Interest (OI) today, indicating that fresh "long" positions are being built by big players as the stock challenges its resistance.
The 1489 – 1509 zone is a historical "supply wall" where sellers have previously overwhelmed buyers.
Scenario A: The Bullish Breakout (Stay Above 1509)
If the price successfully closes and sustains above 1509.25, it confirms that the historical supply has been absorbed.
Entry: Above 1509
Target: 1575
Logic: The 93% profit growth serves as the "fuel" for this breakout, likely attracting institutional buyers.
Scenario B: The Rejection (Stay Below 1489)
If the stock fails to clear this hurdle and remains below 1489, expect a period of "Profit Booking" after the post-earnings rally.
Entry: Short below 1489 (or exit longs)
Target: 1435
Logic: A failure here would form a rejection wick, leading the price back to its immediate support zone.
Valid for 1-4 trading days
XAUUSD GOLD Analysis on (11 Feb 2026)#XAUUSD UPDATEDE
Current price - 5054
If price stay above 5015,then next target 5080 and 5110 and below that 4970
Plan1;If price break 5040-5050 area,and stay above 5050 we will placed buy order in gold with target of 5080 and 5110 & stop loss should be placed at 5115
XAUUSD H1 – Bullish Continuation After Support RetestMarket Overview:
Gold on the 1H timeframe is maintaining a short-term bullish structure after forming a higher low near the 4,700 region and breaking previous consolidation highs. Price is currently trading above the 5,000 psychological level, which is acting as a key demand zone.
Technical Structure:
Clear bullish recovery from the recent swing low.
Break of short-term resistance followed by consolidation.
Strong support zone around 4,980–5,020.
Major resistance positioned near 5,200.
Price recently rejected higher levels and is pulling back toward the marked support zone, suggesting a potential liquidity sweep before continuation.
Trade Idea:
Entry Zone: 5,000–5,030 (support retest)
Stop Loss: Below 4,950 (below structure support)
Target: 5,180–5,220 (resistance / previous supply area)
Bias: Bullish while price remains above 4,950.
A clean bounce from support with bullish confirmation (strong bullish candle or rejection wick) would increase the probability of continuation toward the 5,200 resistance level.
ON retest holds, next push1 First an inverse head and shoulders base, then a rally
2 Then a sell off and a long consolidation, price stopped making new lows
3 Late 2025 broke higher, and it did not fade right away, bullish consolidation followed
4 That consolidation confirms the ascending triangle because the retest held
5 Now price is making another attempt into prior swing highs, this is where acceptance gets tested
6 Chartnes Silent Flow does not predict new highs, it tracks whether trend risk stays contained
7 A drop back into the old range would be the first warning, not a single red candle
XAUUSD (Gold) – 1H timeframe, and the chart is structured
🔎 Market Structure
1️⃣ Overall Bias: Bullish
Price formed a V-shaped recovery from ~4,720.
Higher highs and higher lows are forming.
Price is trading above ALMA (moving average) → short-term bullish momentum.
Currently consolidating above previous resistance → potential breakout continuation.
📊 Key Zones on Your Chart
🟢 Demand Zone (Buy Area)
Around 5,135 – 5,150
Institutional support area.
Marked as BUY zone.
If price pulls back here, it’s a high-probability reaction area.
🔵 Resistance (Now Being Tested)
Around 5,085 – 5,100
Previously rejected price.
Now acting as breakout level.
If price holds above it → bullish continuation confirmed.
🔴 Stop Loss Zone
Around 5,000 – 5,020
Below structure support.
If price breaks this, bullish structure weakens.
📐 Fibonacci Extension Targets
From your fib projection:
🎯 1.618 → ~5,146
🎯 2.618 → ~5,237
🎯 3.618 → ~5,327
🎯 4.236 → ~5,384
Your primary target appears near 5,146 – 5,160, with extended targets above.
💡 Trade Idea (Based on Your Chart)
Option A – Breakout Continuation
Entry: Above 5,090–5,100 after confirmed close
Stop: Below 5,020
Target 1: 5,146
Target 2: 5,237
RR: Good structure-based RR if momentum continues
Option B – Pullback Entry (Safer)
Wait for retrace to:
5,050–5,060 (minor support), OR
5,135 demand zone if deeper pullback
Look for bullish rejection candle
Same upside targets
⚠️ What Would Invalidate This?
Strong bearish candle closing below 5,020
Failure to hold above previous resistance
Momentum divergence forming on 1H
🧠 What This Setup Represents
This is a:
Breakout → Retest → Continuation pattern
combined with Fibonacci extension targeting.
It’s a classic intraday bullish continuation structure.
If you’d like, I can:
Refine it into a scalping plan
Convert it into a swing trade plan
Or calculate exact position sizing based on your risk %**
Just tell me your account size and risk per trade.Create your first imageGot an idea? Try one of our new curated styles and filters or imagine something from scratch.Try nowCaricature TrendCamcorderNeon fantasyNorman RockwellIconicPost-rain sunsetFlower petalsGoldCrayonPaparazziCloudsDepartment photoshootIridescent metal portraitSketchDramaticPlushieRetro animeBaseball bobbleheadDoodle3D glam dollSugar cookieFisheyeInkworkPop artOrnamentArt school
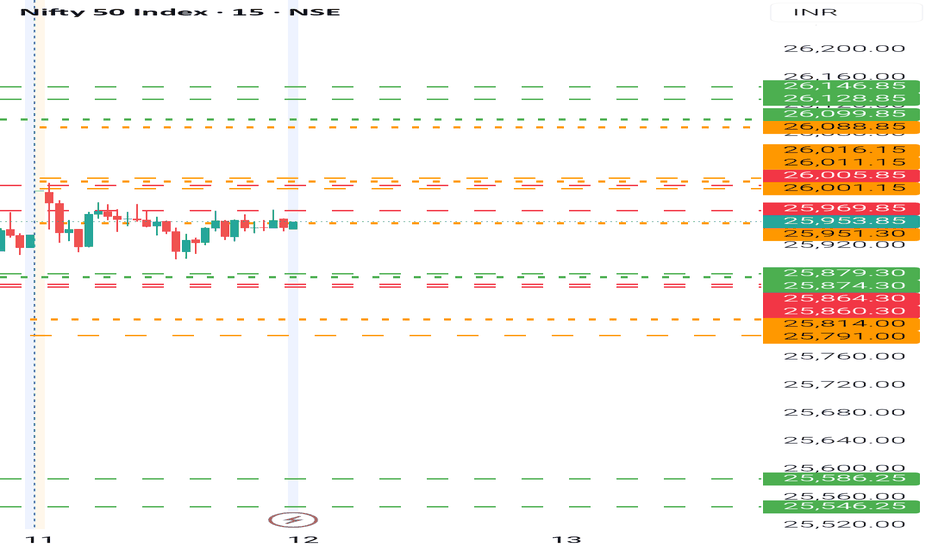
NIFTY- Intraday Levels - 12th Feb 2026If NIFTY sustain above 25969 then 26001/16 above this bullish more levels marked on chart
If NIFTY sustain below 25951/46 below this bearish then around 25879/60 below this re bearish then 25814/25791 below this more bearish below this wait more levels marked on chart
Consider some buffer points in above levels.
Please do your due diligence before trading or investment.
**Disclaimer -
I am not a SEBI registered analyst or advisor. I does not represent or endorse the accuracy or reliability of any information, conversation, or content. Stock trading is inherently risky and the users agree to assume complete and full responsibility for the outcomes of all trading decisions that they make, including but not limited to loss of capital. None of these communications should be construed as an offer to buy or sell securities, nor advice to do so. The users understands and acknowledges that there is a very high risk involved in trading securities. By using this information, the user agrees that use of this information is entirely at their own risk.
Thank you.
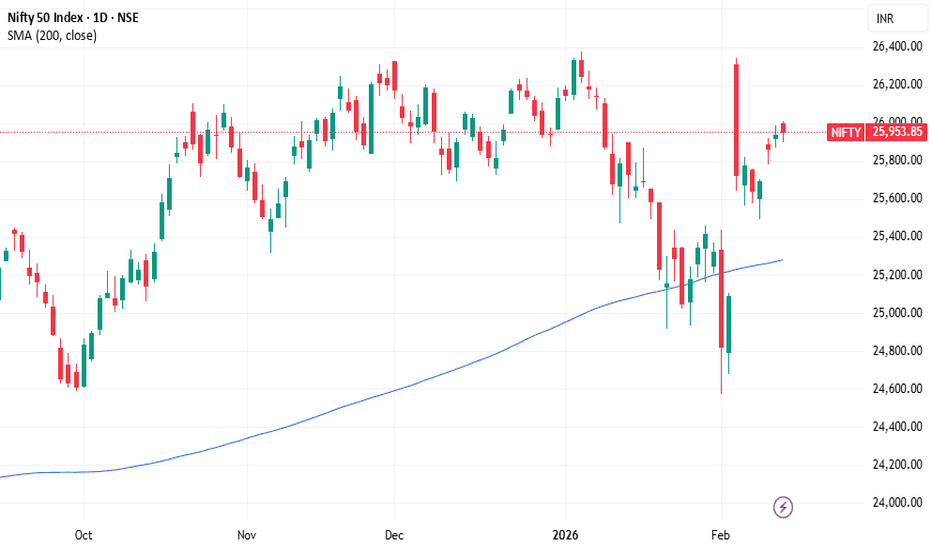
Nifty - Accumulation Before Expansion — One More Buy Chance NSE:NIFTY : Accumulation Before Expansion — One More Buy Chance
Today the sellers’ volume dropped to the lowest point, while trend and momentum both stayed green. You can see that on the chart attached.
That is what classic accumulation looks like just before expansion.
Pivot is up.
Breadth has improved.
Participation is rising.
⚠️ Only the volume label remains red.
In simple words, the market may give one more opportunity to buy tomorrow before the bigger move begins. Be ready.
But remember, the expansion will only start when the volume label turns green. If you want to go long on the index, wait for that confirmation.
Resistance is at 26009.
If we open with a gap above this level, even better — that would show aggression from bulls.
There is also a warning sign.
If volume again stays red tomorrow and the index breaks support at 25892, I will immediately shift to short.
Sector-wise, NSE:CNXAUTO , BSE:POWER , and NSE:CNXENERGY look next in line for momentum expansion.
From these spaces, I am tracking Bajaj Auto, Tata Power, Torrent Power, GIPCL, and TMPV.
📊 Levels at a glance:
Pivot: Rising
Resistance: 26009
Support: 25892
Bullish trigger: Volume turning green
Bearish trigger: Break of support with red volume
Bias: Prepare to buy, but wait for confirmation
Sector focus: Auto, Power, Energy
Stocks in focus: NSE:BAJAJ_AUTO NSE:TORNTPOWER NSE:TATAPOWER , NSE:GIPCL , NSE:TMPV
That’s all I can conclude from the current data.
Take care. Have a profitable tomorrow.
Feb 12 Setup: Consolidative, Not ComplacentFeb 12 Setup: Consolidative, Not Complacent
Nifty sits in the upper half of the 25,500–26,300 rectangle. Bulls hold the edge, but conviction is thin. Gift Nifty indicates a flat-to-green open near 25,970–26,000. Expect a narrow early range. US non-farm payrolls tonight is the only catalyst that matters. 🧵
#Nifty
2/ Technical: Breakout or Fakeout?
Price is above key EMAs. RSI at 58–60, neutral-bullish. MACD positive but histogram cooling. The tape is telling you momentum is intact but tired. 26,000–26,050 is the heavy call OI wall. A clean break here triggers short-covering toward 26,200–26,400. Without it, expect rejection.
#TechnicalAnalysis
3/ The Support Structure You Must Respect
Immediate floor: 25,900–25,850, strong put concentration. Below that, 25,800 is the line in the sand. A decisive close below 25,800 opens 25,700–25,500, where the 50-DMA sits. That is the trend-defining zone. Until then, dips are buyable—but scale, don't slam.
#Derivatives
4/ Derivatives: Resistance Is Visible, Fear Is Not
26,000 is the maximum call OI strike. Sellers are entrenched. PCR remains mildly supportive (>1 in spots). IV is compressed—ATM vol at 10–13%. Low vol in a range-bound regime favours option sellers, not buyers. Gamma is low near ATM. A vol spike requires a US data surprise.
#OptionsMarket
5/ Sector Rotation: Follow the Flow
Autos, healthcare, PSU banks, metals—these are the receiving ends of institutional rotation. IT remains under pressure; AI disruption is now a valuation reset, not a narrative. Do not short defensives aggressively, but do not catch falling knives either.
#StockMarketIndia
6/ US Non-Farm Payrolls: The Exogenous Variable
Tonight's US jobs data is the single biggest risk event. Strong print = risk-on, weak print = global sell-off. Indian IT and USD/INR will react first. Position size appropriately. This is not a night for hero trades. Survival trumps speculation.
#USJobs
7/ FII Flows: The Reversal Must Sustain
FIIs bought ₹820 Cr yesterday. A second consecutive day of buying above ₹1,000 Cr validates the reversal. Without it, this is just a short-covering blip in a longer-term selling trend. Watch the dollar and US yields. They lead, FIIs follow.
#FII
8/ My Bias: Range Expansion Favours the Upside
I am not bearish. I am also not bullish. I am range-bound with an upside tilt. 25,800–26,200 is the high-probability zone for Feb 12. A breakout above 26,050 is tradable with a 26,400 target. A breakdown below 25,800 requires immediate defensiveness. Size conservatively pre-data.
#QuantFinance
BTCUSDT.P – Elliott Wave AnalysisSHORT-TERM TRADE PLAN AS PER ELLIOTT WAVE ANALYSIS:
💰 Current Price: ~67230
🔻 Scenario 1 (Downside):
- 🛒 Buying interest may emerge at Intermediate Wave 2/B Support Zone → 62127 – 63890
- 📉 If deeper correction → Major Wave C Support Zone → 48412 – 53325
🔺 Scenario 2 (Upside):
- ⚠️ Selling pressure likely at Intermediate Wave C Resistance Zone → 76328 – 78091


