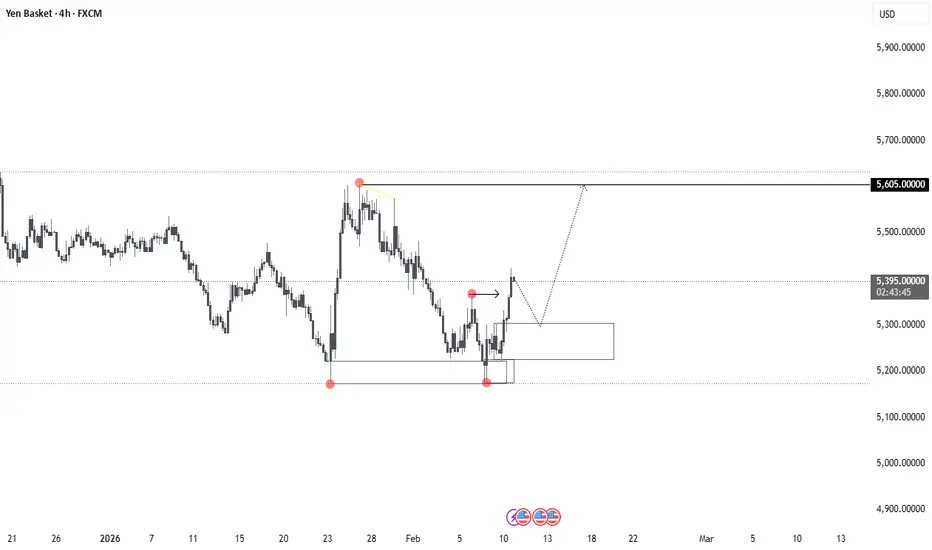
#BANKNIFTY PE & CE Levels(11/02/2026)Bank Nifty is expected to open with a gap-up, indicating positive sentiment at the start of the session. This kind of opening generally brings initial buying interest, but traders should stay alert near the immediate resistance zones as gap-up openings often see early profit booking before a clear direction is established.
On the upside, the 60550–60600 zone is the first crucial support area to hold. Sustaining above this region can trigger fresh long positions, with upside targets placed at 60750, 60850, and 60950+. A stronger bullish continuation will be confirmed only if Bank Nifty moves and sustains above 61050, where positional call buying can aim for higher levels around 61250, 61350, and 61450+.
On the downside, any rejection or failure to hold above 60950–61000 can invite selling pressure. A reversal short setup may emerge near this zone, with downside targets towards 60750, 60650, and 60550. If weakness deepens and the index breaks below 60450–60400, selling momentum could extend further towards 60250, 60150, and 60050, which act as important demand areas.
Overall, despite the gap-up opening, the market may initially remain volatile within defined levels. Traders are advised to wait for price confirmation near key supports and resistances, avoid impulsive entries, and manage risk strictly, as today’s move is likely to be driven by how Bank Nifty behaves around the 60550 and 61050 zones.
Community ideas

Cipla - Positional LongCMP 1342 on 11.02.26
All important levels are marked on the chart.
The range between 1280 and 1330 appears to be a support level. The price is sustaining and consolidating here. If it goes up. may go to the levels of 1425/1480/1550.
The setup fails if the price sustains below 1280-1270.
The above illustration is only for learning and sharing purposes, not a buy or sell recommendation.
All the best.

GBPUSD Analysis on (11 Feb 2026)GBPUSD UPDATEDE
Current price - 1.36450
If price stay above 1.36150,then next target 1.36800 and 1.37000 and below that 1.36000
Plan; if price break 1.36400-1.36450 area and above that 1.36450 area,we will place buy oder in GBPUSD with target of 1.36800 and 1.37000 & stop loss should be placed at 1.36150

Wakefit Innovations - New Zone PossibilityWakefit Innovations :
Breakout from consolidated zone
Sustained breakout from previous resistance (previous rejections)
Now, Need to sustain 208 levels for upmove

ETHUSD: Potential Major Bottom Around $1600 | Time Window 16–21 Market View:
ETH is currently in a deep corrective structure after a sharp sell-off. Price is approaching a key demand zone near $1600, which aligns with historical liquidity and previous reaction areas.
Why it matters:
Strong structural support around $1600
Oversold price behavior after extended down move
Time-based alignment suggesting exhaustion of selling pressure
Time Expectation:
I expect a potential bottom formation between 16–21 February 2026, followed by a relief bounce or consolidation base.
Trading plan (optional line):
Look for confirmation via lower timeframe structure or bullish reversal signals before committing to longs.

Amber - New High PossibilityAmber :
Good Breakout done and currently at resistance
Looks good above 7660, 8000 looks feasible, if 8000 is sustained, all time new high possible

XAUUSD GOLD Analysis on (09 Feb 2026)#XAUUSD UPDATEDE
Current price - 5003
If price stay above 4970,then next target 5050,5090 and below that 4900
Plan1;If price break 5000-4990 area,and stay above 5005 we will placed buy order in gold with target of 5050 and 5090 & stop loss should be placed at 4970

BSE - Trendline BreakoutBSE :
Strong trendline Breakout observed, then gap up and sustained
Stay Long above 3200 with support at 3000

NIFTY Levels for Today
Here are the NIFTY's Levels for intraday (in the image below) today. Based on market movement, these levels can act as support, resistance or both.
Please consider these levels only if there is movement in index and 15m candle sustains at the given levels. The SL (Stop loss) for each BUY trade should be the previous RED candle below the given level. Similarly, the SL (Stop loss) for each SELL trade should be the previous GREEN candle above the given level.
Note: This idea and these levels are only for learning and educational purpose.
Your likes and boosts gives us motivation for continued learning and support.

BANKNIFTY Levels for Today
Here are the BANKNIFTY’s Levels for intraday (in the image below) today. Based on market movement, these levels can act as support, resistance or both
Please consider these levels only if there is movement in index and 15m candle sustains at the given levels. The SL (Stop loss) for each BUY trade should be the previous RED candle below the given level. Similarly, the SL (Stop loss) for each SELL trade should be the previous GREEN candle above the given level.
Note: This idea and these levels are only for learning and educational purpose.
Your likes and boosts gives us motivation for continued learning and support.

XAUUSD Price View with Supply, Demand and Risk ZonesGold price action shows a controlled recovery after a strong bearish move. Earlier, price found solid buying support in the demand zone around 4,650–4,700, where selling pressure reduced and the market stabilised. This zone remains an important support and a key area to watch if price moves lower again.
After the rebound, price started moving higher with higher lows, showing short-term buying strength. However, this move still looks corrective, as price is now approaching a strong supply zone between 5,050 and 5,150. This area has acted as resistance before and may again attract sellers.
The zone around 5,080 appears to be a good area for sellers, as selling pressure can increase near supply. Risk is placed above 5,160, where price would need clear acceptance to continue higher. If price fails to hold near resistance, a pullback is likely.
On the downside, price may move below the 4,900 level if sellers regain control. Further weakness can bring price back toward 4,950 first and then the main demand zone near 4,700. Buyers are expected to become active again near these lower levels.
Overall, the market is trading between clear demand and supply zones. It remains range-bound, and trading decisions are better taken near key support and resistance levels rather than in the middle of the range, where risk is higher and direction is less clear.

Advance Breakout Entry - NRAIL📊 NR AGARWAL INDUSTRIES (NRAIL) - Technical Setup
Current Price: ₹448.00 (+5.58%)
📈 BULLISH OUTLOOK
✅ Stock consolidating after higher high
✅ RSI showing hidden divergence (bullish continuation)
✅ Previous resistance at ₹548 - breakout will confirm next leg up
🎯 TARGETS:
• Target 1: ₹548 (Resistance breakout)
• Target 2: ₹641 (Fib 1.272)
• Target 3: ₹692 (Fib 1.414)
• Grand Swing: ₹760 (Fib 1.618)
🛡️ STOP LOSS: ₹376 (below 0.5 Fib support)
📊 KEY LEVELS:
Support: ₹417 (0.618 Fib), ₹377 (0.5 Fib)
Resistance: ₹548
Risk-Reward: 2.7:1 (to Target 2)
⚠️ DISCLAIMER: This is for educational purposes only, not financial advice. Trading involves risk. Do your own research and consult a financial advisor before investing.
#NRAIL #StockAnalysis #TechnicalAnalysis #NSE

BHEL: Bear Flag on Weekly, Fundamentals Don’t Help EitherBig Picture (Weekly)
BHEL formed a bearish pole and flag on the weekly chart. After a sharp fall, price moved into a rising, overlapping channel — typical corrective behaviour.
Wave X looks completed near 305.9 . As long as price stays below this level, the structure favours another leg down.
Zoom In (1H)
From 305.9 — 240.5 , price unfolded in a clean ABC zigzag , marking (a) of Y .
The current rise is overlapping, slow, and wedge-shaped , suggesting a corrective (b) of Y , not a new trend.
Confluence to note:
Rising wedge formation
0.618 retracement of the entire fall near ~280
Momentum losing steam near resistance
A break below the lower wedge trendline is the trigger for the final (c) of Y decline.
Fundamentals Check
Fundamentals are not supporting upside here:
P/E ~118 — wildly stretched for a PSU with low returns
ROCE ~2–3% — weak capital efficiency
Operating margins ~5.5% — thin and fragile
Free cash flow = inconsistent — spikes, then collapses; not durable
Debt increased sharply in the latest year
In short: price optimism > business reality.
Trade View
Bias: Bearish below 305.9
Entry:
On a 1H breakdown below the rising wedge
Targets:
165 (primary)
150 (extended, if momentum expands)
Invalidation:
Weekly close above 305.9 — bearish view fails
Bottom Line
This is a classic case where structure, lower-timeframe signals, and fundamentals are aligned .
Until proven otherwise, rallies look corrective — not the start of a new bull run.
Disclaimer: This analysis is for educational purposes only and does not constitute investment advice. Please do your own research (DYOR) before making any trading decisions.

if Gape up then liquidity is target if gape down then Tommorow gape up around 25900 will lead to liquidity grab of further lows can be possible if gape down then consolidation can appear.

NIFTY : Trading levels and Plan for 11-Feb-2026📘 NIFTY Trading Plan – 11 Feb 2026
(Timeframe: 15-Min | Instrument: NIFTY 50 | Educational Purpose Only)
🔑 Key Intraday Levels (From Chart)
🟢 26,156 – Higher Timeframe Resistance
🟢 25,917 – Immediate Resistance
🟠 25,859 – 25,917 – Opening Support / Resistance (No-Trade Zone)
🟢 25,776 – Last Intraday Support
🟢 25,677 – Major Breakdown Support
🧠 Market Structure & Price Psychology
NIFTY has shown a steady bullish recovery, forming higher highs & higher lows.
However, price is currently hovering near a supply band + breakout retest zone, indicating:
👉 Buyers are in control — but confirmation above resistance is pending.
👉 Failure to hold support can trigger profit booking pullbacks.
🚀 Scenario 1: GAP UP Opening (100+ Points)
(Opening near / above 25,980)
🧠 Psychology
Gap up reflects bullish overnight sentiment, but fresh longs should only come after resistance acceptance.
🟢 Bullish Plan
🔵 Sustaining above 25,917 (15-min close)
🔵 Upside opens towards 26,156
🔵 Acceptance above → Momentum continuation
🔴 Rejection Plan
🔴 Failure near 26,156
🔴 Pullback towards 25,917 → 25,859
📌 Why this works
Breakouts succeed only when price is accepted above supply, not just gap spikes.
➖ Scenario 2: FLAT Opening
(Opening between 25,860 – 25,950)
🧠 Psychology
Flat opening inside supply reflects indecision & liquidity absorption.
🟠 No-Trade Zone
🔸 25,859 – 25,917
🔸 Expect fake breakouts & whipsaws ❌
🟢 Upside Plan
🔵 Break & hold above 25,917
🔵 Targets: 26,156
🔴 Downside Plan
🔴 Breakdown below 25,859
🔴 Drift towards 25,776
📌 Why this works
Ranges expand after consolidation — patience improves accuracy.
🔻 Scenario 3: GAP DOWN Opening (100+ Points)
(Opening near / below 25,776)
🧠 Psychology
Gap down signals profit booking, but strong supports attract dip buyers.
🟢 Bounce Setup
🔵 If 25,776 holds on 15-min basis
🔵 Expect bounce towards 25,859 → 25,917
🔴 Breakdown Setup
🔴 Clean break below 25,677
🔴 Downside momentum may accelerate
📌 Why this works
Demand zones either produce sharp reversals or fast breakdowns.
🛡️ Risk Management Tips (Options Traders)
🟢 Wait for first 15-min candle confirmation
🟢 Prefer defined-risk spreads in volatile openings
🟢 Avoid trading inside No-Trade Zones ❌
🟢 Risk only 1–2% capital per trade
🟢 Book partial profits at next levels
🟢 Discipline > Prediction 📌
🧾 Summary & Conclusion
📌 NIFTY is in bullish structure but near resistance
📌 25,917 & 25,776 are key intraday triggers
📌 Break above 26,156 confirms continuation
📌 Trade reaction, not assumption 📈
⚠️ Disclaimer
This analysis is strictly for educational purposes only.
I am not a SEBI registered analyst.
Please consult your financial advisor before taking any trades.
Market investments are subject to risk.

Banknifty if gape down or flat then reversal can be planned. Banknifty can have a momentum based on its opening. if flat and gape down so as the result of liquidity grab around 60500 there can be a reversal. and if gape up around 60640 then there could be a chance going down 60500.

NIFTY might start facing rejection from here! As we can see NIFTY remained sideways to negative throughout the day exactly as analysed. Now it can be seen forming a indecision kinda candle in daily time frame at the supply zone hence any signs of rejection around the given supply zone could show continuation of downfall so plan your trades accordingly and keep watching everyone.

Big Vs Small Breakaway Gaps and Old concepts Revision In this video, I have revised all the old concepts I have been sharing taking only 1 thing as my main object which is Nifty, I believe 1 instrument, 1 strategy can change your life but it takes many concepts - combined together to get to that strategy, its simple yet difficult .
No Bias - No forecast only talking about general trends of the markets and concepts

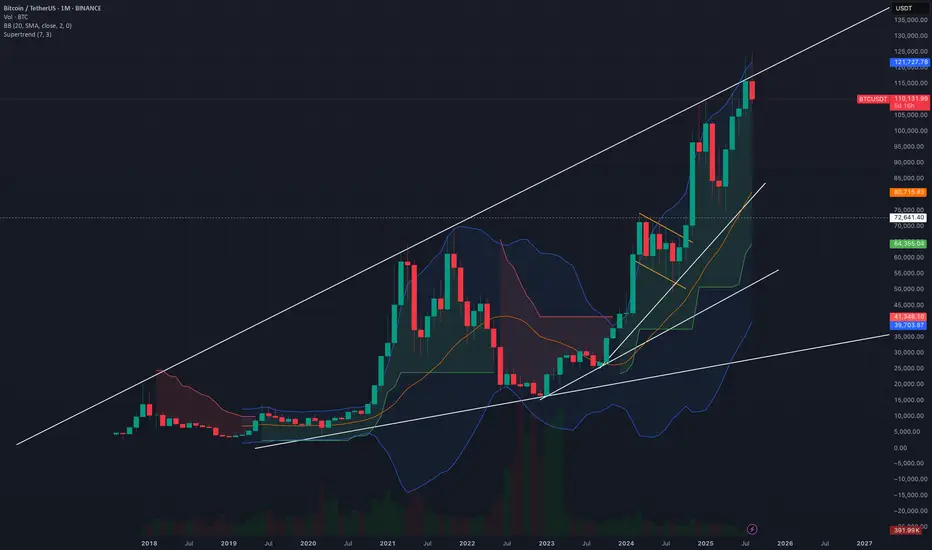
BitCoin? a bit down or big downBitcoin is loosing it fizz now and rally may be about to end.
as per chart reading i can see that it is on the resistance levels
and as now world economies are also settling it should be possible that crypto frenzy get no hype and for that Bitcoin may see a down pludge
Possibly for next 2-2.5 Years Bitcoin won't cross the recent highs and may be retesting 72K level or more downside.
Up move will only continue after breaking and closing above this trendline.
Where DJIA is heading?In my opinion DJIA is heading north till 53k,
as i have shown in the charts and before 53K it won't give any meaning ful correction also
i believe DJIA won't be retract by 2% before reaching to 53K.
#MAGA
#HeadingNorth

BUY TODAY SELL TOMORROW for 5% DON’T HAVE TIME TO MANAGE YOUR TRADES?
- Take BTST trades at 3:25 pm every day
- Try to exit by taking 4-7% profit of each trade
- SL can also be maintained as closing below the low of the breakout candle
Now, why do I prefer BTST over swing trades? The primary reason is that I have observed that 90% of the stocks give most of the movement in just 1-2 days and the rest of the time they either consolidate or fall
Trendline Breakout in POWERGRID
BUY TODAY SELL TOMORROW for 5%

BUY TODAY SELL TOMORROW for 5% DON’T HAVE TIME TO MANAGE YOUR TRADES?
- Take BTST trades at 3:25 pm every day
- Try to exit by taking 4-7% profit of each trade
- SL can also be maintained as closing below the low of the breakout candle
Now, why do I prefer BTST over swing trades? The primary reason is that I have observed that 90% of the stocks give most of the movement in just 1-2 days and the rest of the time they either consolidate or fall
Trendline Breakout in PFOCUS
BUY TODAY SELL TOMORROW for 5%
