HINDCOPPER 1 Week VIew 📊 Current Price Snapshot
Live/Recent price: ~₹535–₹538 per share on NSE for this week.
52-week range: Low ~₹183.8 — High ~₹576.0; stock remains elevated near recent multi-week highs.
📈 Short-Term Resistance Levels (1-Week View)
These are the price zones where the stock may find selling pressure or pause its upside:
• Immediate Resistance: ~₹550–₹551 — first hurdle this week.
• Next Resistance: ~₹564–₹565 — pivot/resistance area seen on pivot calculations.
• Higher Resistance / Near-term Target: ~₹573–₹578 — extended resistance zone above.
Bullish scenario (this week):
A sustained move above ~₹550–₹565 could open room for tests of the ₹573–₹578 zone.
📉 Short-Term Support Levels (1-Week View)
• Immediate Support: ~₹526–₹527 — first near-term floor.
• Secondary Support: ~₹518–₹520 — next demand zone if price weakens.
• Deeper Short-Term Support: ~₹503–₹505 — more structural support on pullbacks.
Bearish scenario (this week):
A break and close below ~₹518–₹520 on a weekly basis may put pressure on the trend and open tests toward the deeper support band near ₹503–₹505.
📅 Weekly Strategy Levels (Summary)
Level Type Price Area (₹)
Immediate Resistance 550–551
Next Resistance 564–565
Extended Resistance 573–578
Immediate Support 526–527
Secondary Support 518–520
Deeper Support 503–505
Community ideas

APLAPOLLO 1 Week View🔎 Current Price Snapshot
🟢 Last close: ₹2,000.10 (23 Jan 2026) — near a 52-week high zone.
📉 Weekly Technical Levels (1-Week Time Frame)
🧱 Support Levels (Key Floors)
These are levels where price is likely to find buying interest if the price pulls back:
S1: ~₹1,913 – ₹1,926 — first strong support band.
S2: ~₹1,890 – ₹1,911 — secondary support base from pivot structure.
S3: ~₹1,850+ — deeper support from broader weekly structure and previous pivot base.
Note: Above ~₹1,890 zone is a key defence level in weekly charts — losing this could signal short-term weakness.
📈 Resistance Levels (Key Ceilings)
These are weekly upside barriers where price may struggle initially:
R1: ~₹2,011 – ₹2,050 — first resistance cluster from weekly pivots.
R2: ~₹2,080 – ₹2,100 — next overhead resistance from extended levels.
R3: ~₹2,128 – ₹2,140+ — broader technical pivot resistance.
Bullish bias continues only above ~₹2,011–₹2,050.
📌 Weekly Trading Scenarios
🟢 Bullish Case (Upside)
Trigger: Sustained weekly close above ~₹2,011–₹2,050
Targets:
→ Short-term: ~₹2,080–₹2,100
→ Extended: ~₹2,120–₹2,140+
Outlook: Strength above R1 opens path to higher weekly highs.
🔵 Neutral / Range
Range: ₹1,890–₹2,050
Behavior: Price oscillates as buyers/sellers balance.
🔴 Bearish Case (Downside)
Trigger: Weekly close below ~₹1,890
Downside key support: ~₹1,850+
Outlook: Weekly momentum weakens if key support breaks.

WAAREEENER 1 Week View📍 Live Price Snapshot (Approximate)
The stock is trading around ₹2,590–₹2,600 on the NSE in recent sessions.
📊 1-Week Timeframe Levels
🔼 Resistance (Upside)
These are levels where price may face selling pressure:
₹2,606 – ₹2,610 — Immediate resistance / pivot-R1 zone this week.
₹2,659 – ₹2,660 — next resistance above pivot.
₹2,690 – ₹2,700 — higher weekly resistance zone.
👉 A sustained breakout above ₹2,660–₹2,690 could suggest short-term strength on the weekly chart.
🔽 Support (Downside)
Key support zones where buyers may step in:
₹2,554 – ₹2,550 — first support zone for the week.
₹2,467 – ₹2,470 — next support if the first breaks.
₹2,374 – ₹2,375 — deeper support level below.
📌 Weekly Trend Notes
Current weekly indicators (RSI/MACD etc.) lean bearish or neutral, with RSI low and MACD negative — indicating short-term downward momentum.
The chart is showing below key moving averages (20/50 day) — typically short-term bearish pressure.
Recent news showed a strong earnings rally around Jan 22, 2026, lifting the stock near higher levels, but price remains below longer-term averages.

GARUDA 1 Day View📌 Current Daily Price Snapshot
Garuda Construction & Engineering Ltd. (GARUDA)
📅 Last Trading Session (23 Jan 2026)
• Last Close: ₹159.28 on NSE/BSE (down ~-6.37% on the day).
• Day’s Range: Approx ₹157.00 – ₹173.40.
• 52-Week Range: ₹87.50 – ₹249.30.
(This is the most recent full day’s market price data available.)
📊 Daily (1D) Support & Resistance Levels
These levels help track where price might react today or in upcoming sessions:
🔹 Pivot-based Levels (Approx. Current Daily)
• Resistance 3 (R3): ~₹185.85
• Resistance 2 (R2): ~₹179.63
• Resistance 1 (R1): ~₹169.45
• Pivot: ~₹163.23
• Support 1 (S1): ~₹153.05
• Support 2 (S2): ~₹146.83
• Support 3 (S3): ~₹136.65
📌 These pivot levels are updated with the latest trading session price action.
📈 How Traders Typically Use This
🔸 Bullish scenario (reversal): Price > ₹169 would target R2 ~₹180 and then R3 ~₹185.
🔹 Neutral/Consolidation: Tight range between ₹153–₹169.
🔻 Bearish scenario: Break below ₹153 could lead to deeper support near ₹146 and ₹136.

ABDL ANALYSISTHIS IS MY CHART OF THE WEEK PICK
FOR LEARNING PURPOSE
ALLIED BLENDERS - The current price of ABDL is 448.70 rupees
I am going to buy this stock because of the reasons as follows-
1. It is retesting it's 1 year resistance zone which can act as good support.
2. This stock has seen some great buying in 2025.
We got this stock in Chart of the Week in past and it did hit the target. Now, it's back to almost same zone.
3. It has shown better relative strength as it stood strong in volatile times (if you see it 6-9 month comparison)
4. The risk and reward is favourable.
5. The stock lock in ended in January starting and so it corrected decently (obviously market played some role too)
Their numbers are improving slowly but surely.
6. Another good part- The overall sector has shown some decent strength and have good momentum. Also, FIIs and MFs have increased their stake in last Q. (This is a good sign)
I am expecting more from this in coming weeks.
I will buy it with minimum target of 35-40% and then will trail after that.
My SL is at 386.15 rupees.
I will be managing my risk.

EURUSD HTF BIAS CLARITYThe dollar is free falling as we can see , the eurusd on the other hand is also close to its closest liquidity and major high,
As there is a smt divergence, we can clearly look at eurusd as it didn't make a low but Gbpusd had it , eur/usd is clearly more strong component.
I've made a path , besides it the trade idea will invalidate.
Aligned Timeframes - 3months<1day<4hour.

EUR/USD HTF bias clarityThe dollar begins to free fall and as eurusd is clearly stronger as we can see with the marked smt divergence , the closest liquidity is marked as followed with the chart.
The HTF aligned is "3month<1day<4hr.

ASIAN ENERGY APPROACHES SUPPORT ZONEASIAN energy chart pattern shows stock is kissing its strong support zone.
one more risk reward study.
Few strong candles hints activity on this stock is happening. Watch out for the bounce.
Last candle is red candle, if green candle with volume is seen enter with small risk.

PINE LABS HINTS UPMOVENegative ROE and ROCE over past years indicate the business wasn’t profitable for shareholders for some time.
Profit margins were also low. But technically should perform well in upcoming days..
Recent candlesticks pattern hints stock can pick up from now.

BALRAMPUR trading at support zoneThe strong hammer kind of candle hints stock is trying to bounce from strong support.
The stock may test the upper trendline resistance or may give breakout.
This would qualify risk reward kind of swing entry with small SL..!!!

Cipla Ltd Weekly chart
1. Price action: The stock has formed a clear double top near ₹1,600 (red zone) and is currently trading at ₹1,315.00, showing a 5.90% decline.
2. Support & resistance: A strong support level is marked around ₹1,300–₹1,400 (green box), tested multiple times (white arrows). Breaking below this could trigger further downside.
3. RSI: The Relative Strength Index is at 26.86, indicating oversold conditions, which may lead to a potential bounce.
4. Volume: Volume spike (14.13M) suggests increased selling pressure.
5. The View: If support zone is supported with fresh buyers and institutional support price can reverse . Crossing the support zone can further add to weekness

Bitcoin For Short sideBitcoin is likely to form a downside impulse wave if viewed as a continuation of a impulse wave and a correction.

Silver plans for Upcoming years i am not saying silver will fall or rise i am just sharing what i am seeing on charts as a price analysts and experienced trader -

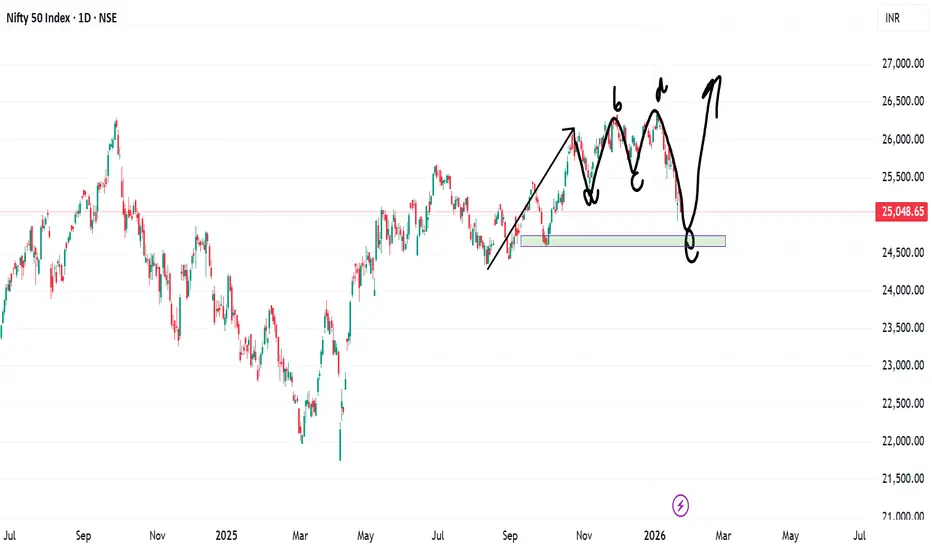
Nifty Wave Structure for long sideNifty trades around 25k If we consider Nifty structure wise, then it is on completion of wedge formation. The end point of the falling wave can be in the range of 25800-25600. A new high can be anticipated from this range. This is my view based on the structure.
Disclaimer
I do not have any buy or sell recommendation or I am not SEBI registered financial advisor.
Thanks
MKT Learner
Radico Khaitan Buy @ when PE = 67Radico Khaitan Buy @ when PE between 67 and 73.
The Price has followed weekly breakout pattern multiple times, but no clear signal coming from that.
Also, we can see Price falling while Volume rising.

#LICHSGFIN at 506. Nicely poised for a good move. #LICHSGFIN at 506. Decent financials. FIIs/DIIs have a decent stake which is by and large stable. Quarterly results on 31st. Technically the stock has finished sub wave 4 and is now trying to wind up sub wave-2 of primary -5 and start sub -3 of primary -5 for tgt 891. WTF chart is almost identical. DTF chart clearly shows that the stock has completed sub -1 of primary-5 and has retraced more than 81% of sub-1 for sub-2 and is forming a neat a-b-c correction for this sub-2. 100% retracement comes to 495 with sub-3 tgt 781. 1 hr chart gives a near time picture where we can see sub-c of this sub-2 trying to make a 5-wave Diagonal to finish sub-2. Likely culmination of sub-2 is 490-500. Should reverse from 495-500 for sub-3 of Primary-5. STRICT STOP LOSS 485( though I think technically it should hold 494) Keep in WL. Risk reward is pretty decent.

BTC at decision pointThe Big Picture
I’ve been analyzing the 23-hour time frame because it gives a much clearer view of the trend without all the "noise" and manipulation you see on the standard daily chart. After that massive run-up, BTC has been cooling off, and I’m looking to see if our previous support at $86,000 is going to hold or if we’re going deeper.
My Trade Plan
Right now, the 4-hour chart isn't showing much, but the 1-hour and 15-minute charts are telling a different story. Here’s how I’m playing this:
The Short Opportunity: The 15-minute chart is already looking pretty bearish. If the current support level breaks, I expect the price to flush down toward the $85,000 – $85,800 zone. If we cross that line, I’m planning to short with 25x–30x leverage to capture that move down.
The Long Opportunity: I’m only looking to go long if we see a definitive bounce right here. I’m not going to guess the bottom—I’ll wait for the market to show me it wants to move back up first.
Final Thoughts
I’m leaning toward the bearish side for the moment, but I’m staying patient. I’ll let the price come to my level, and once that support breaks or holds, I’ll take the trade.
Let me know what you think of this setup in the comments. Good luck with your trades!

Bank Nifty spot 58473.10 by Daily Chart view - Weekly UpdateBank Nifty spot 58473.10 by Daily Chart view - Weekly Update
- Support Zone 57665 to 58250 for Bank Nifty
- Resistance Zone 58850 to 59350 for Bank Nifty
- Since a while the indicative Support and Resistance Zone are just an eyewash as they hardly sustain by the unprecedented Geo-Political happenings

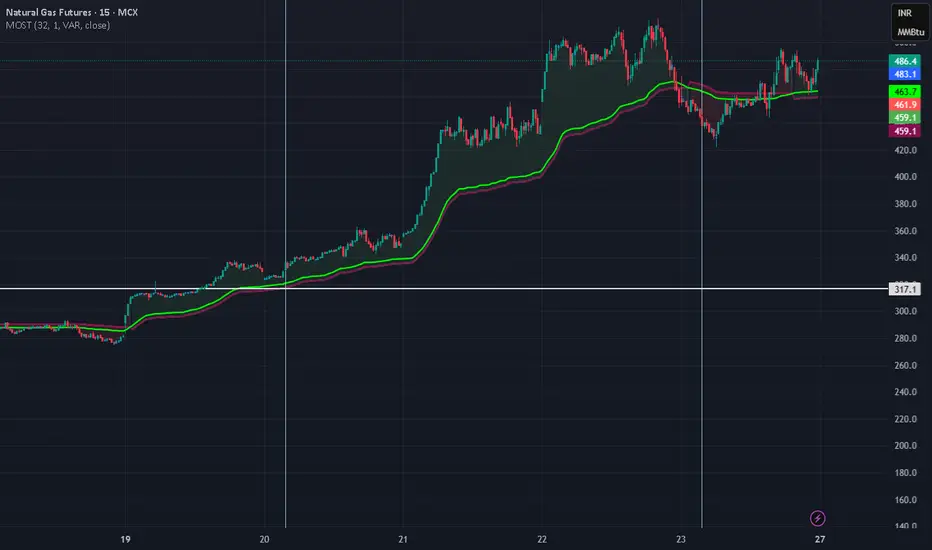
Natural gas is on buy trend till Arctic frostNaturalgas price is rapidly raising due to arctic frost but this is temporary; Next month price is not raising as like Jan contract; Watch out for price drop
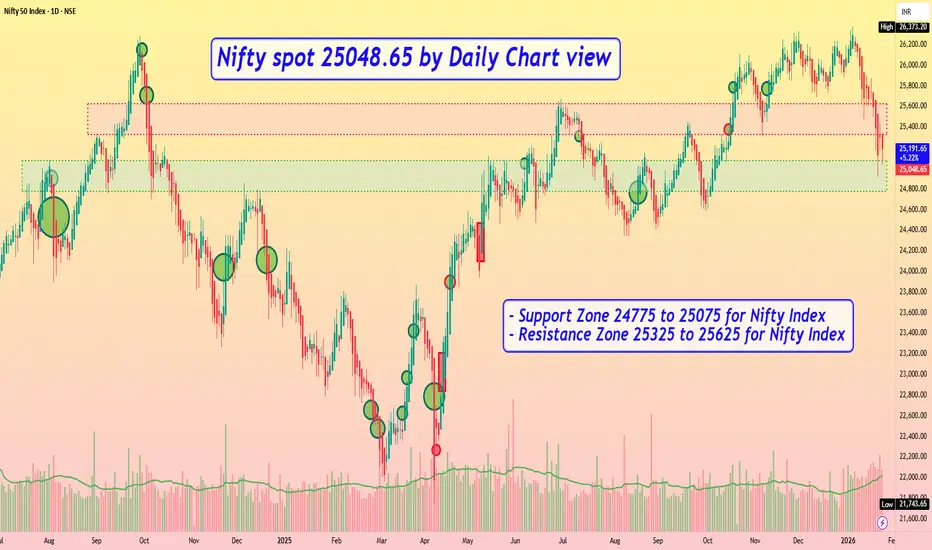
Nifty spot 25048.65 by Daily Chart view - Weekly UpdateNifty spot 25048.65 by Daily Chart view - Weekly Update
- Support Zone 24775 to 25075 for Nifty Index
- Resistance Zone 25325 to 25625 for Nifty Index
- Since a while the indicative Support and Resistance Zone are just an eyewash, as they hardly sustain by the unprecedented Geo-Political happenings
NMDC Limited daily chartThe chart shows a mixed trend with these key observations on the trendlines and price action:
Overall trend: The white upward trendline drawn from the lower lows indicates a long‑term bullish bias in the mid‑to‑long range (from around ₹60 to ₹83). As long as the price stays above this line, the broader uptrend remains intact.
Short‑term movement: The stock has formed a decline from the recent high (≈₹83) to the current level of ₹82.74, with a minor 0.24% drop. The red and blue moving averages (21 and 55) are flattening, showing loss of immediate momentum.
Trendline analysis:
The white ascending trendline acts as support. A break below it would signal a shift to a bearish phase.
The upper white horizontal line marks a resistance zone near ₹86. A push above this could trigger a new bullish surge.
The View
If the price holds above the trendline and moving averages, expect a rebound toward ₹86. A breach below the trendline may lead to a test of ₹70‑₹72.

Hindalco 1 day chartPrice action: Stock closed at ₹934.65, down 2.17% from the day’s high ₹966.50. The price is forming bearish engulfing pattern on resistance , sign of reversal but he overall volume looks in the favour for buying .Recent candle is a red bearish body after a strong green run, indicating potential short‑term pullback.
Volume spike on the green candles confirms buying pressure; recent volume is moderate, showing reduced momentum.
Trend: Overall bullish (higher highs & lows) with the blue & red 21 and 55 EMAs sloping upward, giving dynamic support.
The View : For longs, wait for a bullish reversal candle or break above ₹970.80 for further continuation .

Lets Talk about Nifty, Midcaps, Smallcaps and Banknifty A very general talk on the charts and where they are - more of a awareness sort of video- to exactly know where we are trading in terms of index . I make educational content videos for trading
