We’re looking at Gold vs USD on the 1-hour chartPrice recently completed a deep pullback after a strong bullish leg.
That pullback formed a rounded / cyclical bottom (purple curve), which often signals trend continuation, not reversal.
🧠 Structure & Price Action
What stands out:
Higher low formed after the sell-off → bullish market structure
Strong impulsive bullish candles off the lows → buyers in control
Price reclaimed and is holding above a key mid-range level (~4960)
This tells us:
The correction phase is likely complete, and price is transitioning back into an impulse phase upward.
🎯 Trade Idea (Based on Your Chart)
✅ Entry
Buy around 4,960 – 4,970
This is a pullback entry inside bullish continuation
🛑 Stop Loss
Below the recent structure low
Around 4,840 – 4,860
If price breaks here, the bullish idea is invalidated
🎯 Target
5,050 – 5,100 zone
This aligns with:
Prior resistance
Projected impulse leg (measured move)
Liquidity resting above highs
Risk–Reward:
Roughly 1:2.5 to 1:3, which is solid for an intraday/swing setup.
🔍 Why This Setup Makes Sense
Bullish continuation after correction
Structure shift confirmed (higher low)
Strong momentum candles
Clear invalidation level (clean risk)
The blue projected path you drew fits perfectly with a pullback → continuation → expansion model.
⚠️ Invalidation Clue
If price:
Breaks and closes below the stop zone
Or starts printing lower highs + strong bearish momentum
→ bullish bias is off, and we reassess.
Community ideas

JMFINANCIL | Trendline & Resistance Broken Today🚀 JMFINANCIL | Trendline & Resistance Broken Today
📊 Breakout Context: Trendline + Resistance breakout with strong volume confirmed today.
TRADE PLAN
💰 Buy near CMP: 139.93
🎯 Target: 205 (+46.5%)
🛑 Stop Loss: 124.40 (-11.1%)
⚖️ Risk/Reward Ratio: ~1 : 4.2
🔑 Key Notes
- 📌 Strong volume breakout signals genuine momentum; watch for retests.
- 📍 Healthy retest zone: 135 – 139 (valid as long as price holds above stop loss).
- 🔒 Trail stop loss upward as price advances to lock in profits.
🔥 Discipline + Patience = Profits
Stay focused, respect your stop, and let the trend reward you.

WTI (Crude Oil) - Bullish SetupWTI has been trading under this trendline since March' 2022. Inflation adjusted oil is the cheapest commodity avaiable currently and the type of bull run we have seen in all other commodties since last year, i expect it is oils turn to shine now. Tracking this trendline closely, and once it is broken, i expect oil to run upwards pretty fast. Eyes Open!

XAGUSD - Parallel ChannelThe price of silver has already borken out from this parallel channel that it was trading inside for the past few days. If the Bullish momentum continues, expect to have quick pullback to approx $74-$75 before continuing the next leg up. Also the RSI has now returned to neutral territoriy, which would be a good sign for the bullish trend to continue. But if we do see a breakdwon in the momentum, expect the prices to retest $50-$54 before turning bullish again.

S&P 500 Analysis BullishS&P 500 Analysis (4H Chart)
- The primary trend of the SP500 remains bullish, although on a 4H chart, the index was trending within a bearish broadening wedge, which the prices have recently breached on the upper side and sustained higher.
- The prices have also given a bullish breakout above the inverse head & shoulder pattern.
- After a strong bullish pullback in the previous two trading sessions, the index is currently resting near the fib extension 1.0 (6963).
- The prices are also forming a bullish hidden divergence with RSI.
- Any breakout above recent highs of 6980, would drive the prices higher above 7000 near 7026 zone.

Crude Oil Analysis BearishCrude Oil Analysis (4H Chart)
- The primary trend in oil turned bullish.
- On the 4H chart, the prices have recently tested the upper trendline of the symmetrical triangle pattern and are showing signs of weakness.
- The prices have also recently tested the upper Bollinger band, with RSI turning flat, signaling moderate bearish retracement.
- Prices are now expected to retrace towards the fib level 0.50 (63.55) confluence with the middle Bollinger band, if breached lower support of 62.40 can be seen.
- Crude upside may be capped as diplomatic progress emerges, despite US warnings to avoid Iranian waters near Hormuz.
- Also, Venezuelan Oil exports surge to 800,000 bpd in January from 498,000 bpd in December.

Breakout with volume | PRAJINDPRAJIND: Major Reversal Underway After 70% Correction from all time high
Praj Industries is currently showing signs of a massive structural turnaround after being a significant underperformer in the capital goods sector, trading nearly 60% down from its all-time high. This deep correction led the stock into a high-value accumulation zone, where it recently established a rock-solid support base between ₹273 and ₹280. The technical landscape shifted dramatically today as the price delivered a powerful single-day breakout, surging over 14% and clearing its previous one-month high in a single move. This price spike was backed by exceptional volume, indicating that institutional buyers are likely stepping in at these beaten-down levels to absorb supply.
From a structural standpoint, the stock has finally breached a long-standing descending trendline that had suppressed price action for months, signaling an end to the "lower high, lower low" corrective cycle. While the price remains below the 200-day DMA, this move successfully reclaimed the 5, 20, and 50-day moving averages in one go, shifting the immediate momentum from bearish to strongly bullish. With the stock now sustaining above the trendline breakout point and showing high-volume absorption, the technical setup confirms that the bottom is likely in. Given this confluence of a strong support base and a momentum-backed breakout, the stock can be looked at for a significant upside move as it begins its long-term recovery phase.

GOLD BULLISH TRIANGLE PATTERN | BULLISH BREAKOUT Gold is currently consolidating within a tight symmetrical triangle following a corrective pullback, indicating a period of compression ahead of a potential expansion move. Price action continues to hold above the key demand zone around 5030, which remains a critical structural support.
Multiple rejections from the upper boundary of the consolidation suggest building bullish pressure. A decisive breakout and sustained acceptance above the 5045–5048 resistance zone would confirm bullish continuation and signal the next leg higher.
On confirmation, upside momentum is expected to target 5055, followed by an extension toward 5065, aligning with projected measured-move objectives from the triangle breakout.
A failure to hold above 5030 would invalidate the bullish bias and expose price to deeper downside correction, negating the current setup.

Jayaswal Neco Inds cmp 78.50 seen by the Daily Chart viewJayaswal Neco Inds cmp 78.50 seen by the Daily Chart view
- Support Zone 64 to 70 Price Band
- Resistance Zone 78.50 to 84.50 Price Band
- Good bottom around Support Zone upper end

Part 2 Institutional Trading VS. Technical AnalysisMoneyness of Options
Moneyness describes the relationship between the spot price and strike price.
1. In-the-Money (ITM)
Call: Spot > Strike
Put: Spot < Strike
2. At-the-Money (ATM)
Spot ≈ Strike
3. Out-of-the-Money (OTM)
Call: Spot < Strike
Put: Spot > Strike
ITM options have intrinsic value; OTM options are purely speculative.


Indian Hotels – Daily Chart View📊 Indian Hotels – Daily Chart View
Price is currently reacting from a strong demand zone inside a broader falling channel structure. After a sharp pullback toward support, buyers stepped in and the stock is attempting a relief bounce.
🔎 Technical Observation:
• Descending channel structure still active
• Demand zone around 640–660 showing reaction
• Short-term pullback within larger corrective phase
• Trend strength will be confirmed only above channel resistance
📌 Key Zones to Watch:
Resistance: 725 – 760
Support: 650 zone
Market is at a reaction area — waiting for structure confirmation rather than predicting direction.
⚠️ Disclaimer:
This post is shared only for educational and learning purposes. It is NOT financial advice or a buy/sell recommendation. Always do your own research and manage risk before trading.
#IndianHotels #PriceAction #TechnicalAnalysis #SwingTrading #StockMarketIndia

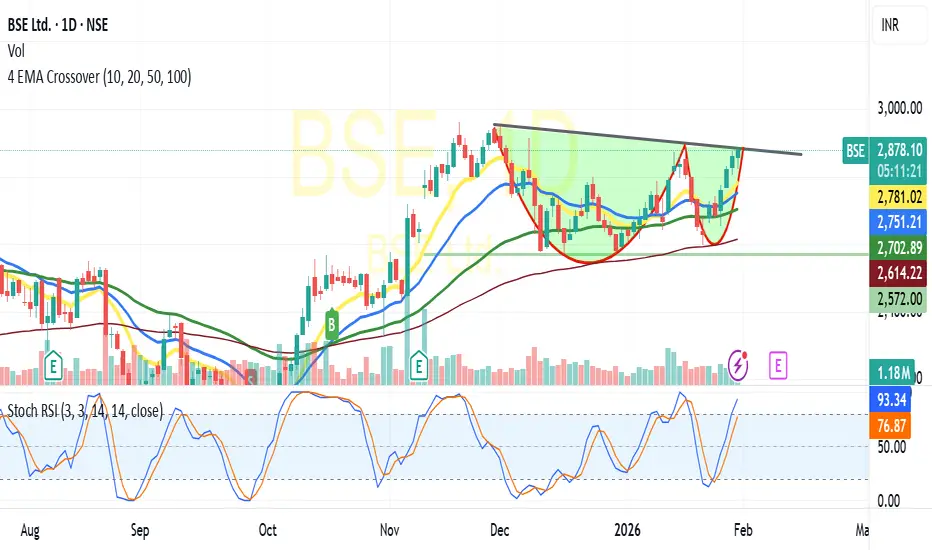
BSE-Likely Cup &Handle Break outBSE:
Trading at 2881 and above all its critical Moving averages Viz10/20/50/10 DEMA
In daily chart has formed C&H Pattern,
Based on the pattern and price volume suggests -breaking the Neckline resistance at 2880-2900 likely to test 2950/3000+ shortly(For educational purpose only)
TMB : VCP Short Base BreakoutTMB has just completed a textbook VCP (Volatility Contraction Pattern) consolidation. We observed three clear rejections accompanied by consistent higher lows, along with a noticeable volume dry-up — all classic signs of tightening supply.
This was followed by a clean breakout backed by strong volume expansion, confirming demand stepping in. Fundamentally, both EPS and sales are improving QoQ, which adds further conviction to the setup. Overall, it checks all the boxes for a high-quality VCP trade.
I initiated the position with a conservative 0.1% risk, as I’m currently collecting more data and validating this setup type. Once I gain more confidence in the price action and consistency, I plan to gradually scale up the risk.
📢📢📢
If my perspective changes or if I gather additional fundamental data that influences my views, I will provide updates accordingly.
Thank you for following along with this journey, and I remain committed to sharing insights and updates as my trading strategy evolves. As always, please feel free to reach out with any questions or comments.
Other posts related to this particular position and scrip, if any, will be attached underneath. Do check those out too.
Disclaimer : The analysis shared here is for informational purposes only and should not be considered as financial advice. Trading in all markets carries inherent risks, and past performance is not indicative of future results. It’s essential to conduct your own research and assess your risk tolerance before making any investment decisions. The views expressed in this analysis are solely mine. It’s important to note that I am not a SEBI registered analyst, so the analysis provided does not constitute formal investment advice under SEBI regulations.

Axis Bank | Gann Square of 9 Intraday Observation | 15 March 202Disclaimer:
This analysis is for educational purposes only. I am not a SEBI-registered advisor. This is not financial advice.
Symbol: AXISBANK (NSE)
Date Observed: 15 March 2024
Time Frame: 15-Minute Chart
Method : Gann Square of 9 (Price Capacity & Time Study)
This post documents a historical intraday market observation using the Gann Square of 9, focusing on how price capacity, trend context, and time alignment can highlight potential intraday reaction zones.
📉 Market Context & Reference Point Selection
Axis Bank showed downside pressure from the opening 15-minute candle.
In such conditions, the high of the first 15-minute candle (~1050) was treated as the 0-degree reference level, following Gann methodology.
This level acts as the starting point for measuring the intraday downward price cycle.
Correct trend identification and reference selection are essential before applying Square of 9 calculations.
🔢 Square of 9 Price Mapping
Based on the selected reference:
0 Degree: ~1050
45 Degree (Observed Normal Capacity): ~1034
The 45-degree level often represents the normal intraday price expansion range under regular market conditions.
⏱️ Price–Time Interaction (Observed Behavior)
Price interacted with the 45-degree level early in the session (around the third 15-minute candle).
Completion of normal price capacity well before the later part of the trading day has historically shown signs of temporary downside exhaustion.
After reaching this zone, the market displayed short-term stabilization followed by upward expansion.
This aligns with a commonly observed Gann concept:
When expected price capacity is completed early in time, the probability of a directional reaction may increase.
📘 Educational Takeaways
Gann Square of 9 helps define intraday price limits in advance
Trend context determines how reference points are selected
Time alignment adds confirmation to price-degree levels
Normal (45-degree) reactions are more frequent than rare cases
The approach encourages rule-based observation over emotional reaction
📌 Shared strictly for educational and historical chart-study purposes.
#AxisBank #GannSquareOf9 #WDGann #IntradayAnalysis #MarketEducation #PriceTime #TechnicalAnalysis

Axis BankAXISBANK | 1D | Breakout Continuation Setup
After a strong up-move, price is consolidating near resistance.
📌 Buy above 1342 for continuation of trend.
🛑 Stop Loss below 1317 to manage risk.
🎯 Upside opens towards 1380 → 1420 if momentum sustains.
RSI holding above 50 and price above 20 SMA — bulls still in control.
Wait for confirmation. Follow price, not prediction.

Bitcoin Bybit chart analysis FEBURARY 9Hello
It's a Bitcoin Guide.
If you "follow"
You can receive real-time movement paths and comment notifications on major sections.
If my analysis was helpful,
Please click the booster button at the bottom.
This is a Bitcoin 30-minute chart.
There are no separate Nasdaq indicators.
When the red finger moves,
*This is a one-way long position strategy.
1. $66,268.1 is the entry point for a long position. / Stop-loss price is set when the green support line is broken.
2. $69,531.5 is the first target for a long position.
-> $71,221 is the second target. -> Target prices are set at Top and Good in that order.
Points 1 and 2 in the middle are used to re-enter a long position.
If the price touches 69.5K at the top first,
it could end in a sideways market within the purple support line of point 1. From the breakout of the green support line, the price remains open to a maximum of $61,222.5, so please be cautious.
Up to this point, please use my analysis for reference only.
Please operate safely, following the rules and setting stop-loss orders.
Thank you.

Axis Bank | Gann Square of 9 Intraday Observation | 18 March 202Disclaimer:
This analysis is for educational purposes only. I am not a SEBI-registered advisor. This is not financial advice.
Symbol: AXISBANK (NSE)
Date Observed: 18 March 2024
Time Frame: 15-Minute Chart
Method Used: Gann Square of 9 (Price–Time Study)
This post documents a historical intraday market observation using the Gann Square of 9, focusing on how price movement capacity and time alignment can highlight potential intraday reaction zones.
📊 Initial Market Structure
Axis Bank displayed upward momentum from the opening 15-minute candle.
The low of the first 15-minute candle (~1043) was treated as the 0-degree reference level.
This reference point marks the start of the intraday price cycle and is used for further Square of 9 calculations.
Correct identification of the 0-degree level is a key requirement for consistent Square of 9 analysis.
🔢 Square of 9 Level Mapping
Using Square of 9 price-degree relationships, the following levels were observed:
0 Degree: ~1043
45 Degree (Observed Normal Capacity): ~1057
The 45-degree level often reflects the normal intraday price expansion range under regular market conditions.
⏱️ Price & Time Interaction (Observed Behavior)
Price interacted with the 45-degree level early in the session (around the second 15-minute candle).
Completion of the normal price capacity well before the later part of the trading day has historically shown temporary price pressure.
After reaching this zone, the market displayed rejection behavior followed by short-term downside expansion.
This observation aligns with a commonly studied Gann principle:
Early completion of expected price capacity may increase the probability of a market reaction.
📘 Educational Takeaways
Gann Square of 9 helps define logical intraday price limits
Normal (45-degree) reactions occur more frequently than exceptional cases
Time context adds important confirmation to price levels
Minor price deviations around calculated levels are part of normal market behavior
The method supports rule-based observation, not prediction
📌 Shared strictly for educational and historical chart-study purposes.
#AxisBank #GannSquareOf9 #WDGann #IntradayAnalysis #MarketEducation #PriceTime #TechnicalAnalysis

Part 1 Institutional Trading VS. Technical Analysis What Is Premium?
The premium is the price of the option contract. It is influenced by several factors:
Current price of the underlying
Strike price
Time remaining till expiry
Volatility
Interest rates
Dividends
Premiums are higher when:
Market is volatile
Expiry is far away
Stock price is near the strike price

Birlasoft weekly chart shows a bullish reversalBirlasoft weekly chart shows a bullish reversal in progress:
1. Price action: The stock has surged from ~445 to 464.55 with a 6.62% gain, breaking above the EMA (416.13), indicating a shift from a downtrend to an upward move.
2. Reversal confirmation:
- The recent green candle with high volume (3.75M) supports the breakout.
- RSI (55.45) is climbing from oversold territory, showing growing momentum.
3. Key levels:
- Immediate resistance: 480–520 (previous consolidation zone).
- Next targets: 534.70, 560, then 605.95 if the breakout sustains.
- Support: EMA 21 (416.13) and support line at 445.90; these should hold for the uptrend to continue.
4. Action:
- Enter long on a close above 480 with volume confirmation.
- Set a stop‑loss below 445.90 to manage risk.

GOLD before Non-Farm: Sideways or a Trap?🌍 Macro Background
Continuing to monitor U.S. – Iran tensions and whether escalation occurs.
Japan: maintaining a weak JPY → USD remains supported.
A heavy news week ahead:
FED speeches (today)
Labor market data
Inflation data later this week
👉 Market sentiment remains cautious, waiting for a clearer directional catalyst.
📈 Trend & Structure
Overall price structure remains unchanged: Gold is in the final phase of a corrective rebound.
Upside momentum still exists, but limited, while reversal risk is increasing.
Price is consolidating near resistance → sideways conditions are favored.
🔴 Resistance – 🟢 Support
🔴 Resistance: 5,050 – 5,100
🟢 Near support: 4,980 – 4,950
🟢 Additional support: 4,930 – 4,936
🟢 Deeper support: 4,880 – 4,850
📊 Trading Scenarios
✅ Primary scenario (higher probability): Sideways – range trading
Sell reactions around 5,050
Condition: rejection candles / bearish confirmation
Buy technical pullbacks at support zones
Focus on M15 – H1, quick and disciplined trades.
⚠️ Alternative scenario (lower probability): Bullish breakout
Mandatory condition: H1 close clearly above 5,100
Only then consider buying the breakout.
🧠 Risk Management
Avoid holding large positions during:
FED speeches
Labor market & inflation releases
No FOMO — wait for candle confirmation.

UPL: The Post-Budget Recovery Play!UPL is currently in a high momentum phase. Following a volatile Budget Day where the broader market crashed, UPL staged a powerful recovery on February 2, surging over 5-6% to hit an intraday high of ₹706.90.
This rally was fueled by Q3 FY26 results that beat street estimates, featuring 12% revenue growth (₹12,269 Cr) and a massive ₹2,553 Cr reduction in net debt. This fundamental strength provides the "fuel" for the technical breakout you've identified.
The stock is now testing the CRITICAL DECISIVE ZONE: ₹699 - ₹708.50.
Historically, this is the "Battleground Zone" where the trend decides its next big move and price spent most of its time.
✅ SENTIMENT LEVEL: ₹705 is the psychological line in the sand. Buyers are fighting hard to hold this territory.
🚀 BULLISH TRIGGER: A strong trade above ₹708.50 clears the path for a target of ₹735+.
⚠️ BEARISH TRIGGER: If it fails to hold and breaks below ₹695, we might see a slide toward ₹671.
Why the hype? Fresh Q3 results beat estimates + Debt reduction = Strong fundamental backing for this technical move. Keep it on your radar! 📈

NHPC: Decisive Breakout or Supply Trap?NHPC is currently at a critical technical crossroads, coinciding with the release of its Q3 FY26 financial results. While the stock has shown resilience by forming a strong base around the 74.50 cluster, it is now testing a historical "Supply Zone" that has rejected prices multiple times in the past.
The Setup (for next 1-4 trading days)
The Base: A solid support cluster has been established at 74.50, which acted as a springboard for the current leg up.
The Pivot Zone: The stock has entered the 80.00 – 81.00 range. Historically, this is a heavy supply area.
Bullish Scenario: A decisive close and trade above 81.00 would signal that the supply is being absorbed. This clears the path for a short-term sprint toward 83.20.
Bearish Scenario: If the stock fails to sustain above 80.00, expect a mean reversion back to the immediate support level of 77.40.
The "Fuel" :
Dividend Alert: The Board has declared an interim dividend of ₹1.40 per share. The record date is fixed for February 10, 2026. This often provides downside protection as investors buy in for the yield.
Capacity Expansion: NHPC just commissioned Unit #3 (250 MW) of the Subansiri Lower Project on February 1st. This is a massive milestone for their long-term revenue visibility.
Earnings Wrap: Q3 profits stood at ~₹293 Cr (Standalone). While the numbers were impacted by regulatory deferrals, the market is looking forward to the recovery of ₹1,176 Cr in future tariffs.
Strategic Exit: NHPC is exiting its promoter status in PTC India, aligning with government directives to focus purely on core hydropower and renewable assets.
