HINDZINC 1 Month Time Frame 📊 Current context (as of mid-Feb 2026):
• The stock is trading around ~₹615–₹630 levels on NSE/BSE.
📈 Resistance (Upside Targets)
1. ₹615–₹617 – First resistance (short-term)
2. ₹621–₹622 – Second resistance zone
3. ₹630–₹632 – Third resistance / next hurdle
4. Higher near ₹650+ – longer-term barrier if momentum strengthens (based on recent trading structure)
Interpretation:
If price maintains above ₹615, the more bullish range toward ₹621–₹632 becomes likely, with extensions possible above ₹640 only on strong trend continuation.
📉 Support (Downside Levels)
1. ₹598–₹600 – 1st support (near pivot underside)
2. ₹587–₹590 – 2nd support band
3. ₹581–₹585 – broader base support zone
4. ₹570–₹575 – deeper support if market weakens significantly
Interpretation:
A break below ₹598 increases chance of retesting ₹587–₹585. Stronger support around ₹570–₹575 is deeper but important for broader corrective setups.
Community ideas

EIFFL 1 Week Time Frame 📊 Current Price Context
Recent prices have been in the ~₹250-₹260 range recently.
📈 1-Week Key Levels (Short-Term Focus)
🔹 Immediate Resistance
~₹258–₹260 – first hurdle where buyers may face supply.
~₹264–₹269 – next upside zones if the stock clears the first resistance.
🔻 Support Zones
~₹247–₹248 – initial support area on week view.
~₹242–₹240 – secondary support if weakness extends.
~₹232–₹236 – deeper support on extended pullbacks.
📌 Pivots vary by provider, but overall the ~₹247-₹260 band is key this week for intraday traders.
📉 Short-Term Technical Lean
Most short-term indicators are mixed to slightly bearish/momentum weak (RSI around mid-range, volume not strong), though moving averages near current price keep it range-bound.
This suggests higher probability of sideways trading in the next few days unless there’s a substantial catalyst.
🧠 What to Watch This Week
✔ Break above ₹260-₹264 — could be early sign of strength.
✔ Drop below ₹247 — puts focus on lower supports near ₹240-₹235.
✔ Volume expansion on either move — strengthens that breakout/breakdown.

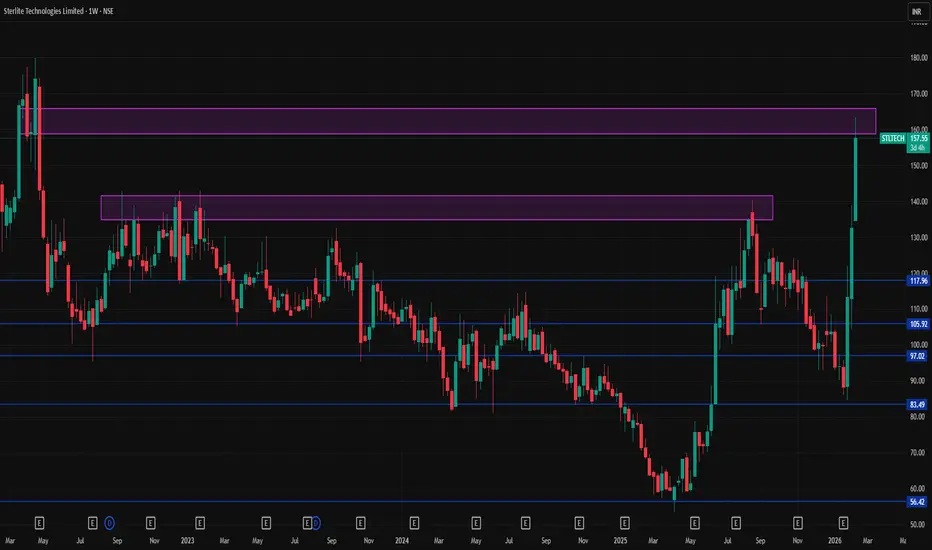
STLTECH 1 Week Time Frame 📌 Current Approx Price: ~₹155–₹158 range today.
📈 Weekly Pivot / Support & Resistance (Important Levels)
These levels are based on widely used weekly pivot calculations (classic & Fibonacci) which help identify where price may find support or resistance over the next week:
🔹 Weekly Pivot Core Levels
Weekly Pivot (central): ~₹125.3
Weekly Support 1 (S1): ~₹125.3
Weekly Support 2 (S2): ~₹112.0–₹115.2
Weekly Support 3 (S3): ~₹90.6–₹103.8
Weekly Resistance 1 (R1): ~₹146.3–₹149.9
Weekly Resistance 2 (R2): ~₹159.9–₹161.8
Weekly Resistance 3 (R3): ~₹180.9+
👉 How to read these:
• If price stays above pivot (~₹125), sentiment is bullish for the week.
• A break above R1 (~₹146–₹150) suggests continuation toward R2 (~₹160) and possibly R3 (~₹181).
• On the downside, a slide below pivot ~₹125 can pull price toward supports ~₹112–₹103.
🧠 Key Weekly Price Zones to Watch
📊 Resistance Zones (Upside)
~₹146–₹150:
First major resistance — closing above this confirms short-term strength.
~₹159–₹162:
Next target if above R1, this is a key breakout zone for bullish continuation.
~₹180+:
Longer-term resistance area (less likely in just 1 week but watch if momentum accelerates).
🔻 Support Zones (Downside)
~₹125:
Short-term pivot support — important to hold for bullish weekly bias.
~₹112–₹115:
Broader mid-range support if price drops below pivot.
~₹90–₹103:
Strong lower support zone — unlikely in immediate 1-week unless heavy selling.
🧾 Summary – Weekly Outlook
Bullish Scenario:
✔ Holds above ₹146–₹150 → Press toward ₹159–₹162 and higher.
Neutral / Consolidation:
↔ Price oscillates ₹125–₹150 → Range trading with pivot pivot as reference.
Bearish Scenario:
✘ Break below ₹125 (weekly pivot) → Potential move toward ₹112–₹103.
EURAUD MULTI TIMEFRAME ANALYSIS Scanning multiple forex pairs to filter high-quality trade setups. No trades are forced—only structure-based opportunities.
Note: There may be a delay in this video due to upload processing time.
Disclaimer: FX trading involves high leverage and substantial risk, and losses can exceed your initial investment. This content is for educational purposes only and should not be considered financial advice. Trade at your own risk.

STANLEY 1 Week Time Frame 📊 Current price context
• Share price is trading around ~₹180-₹210 range recently (~close to the 52-wk low) with volatility.
📌 Weekly Support Levels
These are zones where the price may find buying interest on dips:
✔ Support 1: ~₹172–₹177 — near recent swing lows
✔ Support 2: ~₹165
✔ Support 3: ~₹157
These come from broader technical pivot and historical price zones that show areas of previous trading interest.
📌 Weekly Resistance Levels
These are zones where the price might stall / face selling pressure:
📍 R1: ~₹186–₹190
📍 R2: ~₹194
📍 R3: ~₹200+
These are typical pivot resistance zones / recent upside areas of interest on short-term charts.
🔎 What This Means (in simple terms)
If price holds above ₹172-₹177, that’s a bullish defence zone for a bounce short-term.
A clear break above ₹186-₹190 with volume could open swings toward the ₹194-₹200 region.
A break below ~₹165 could set the stage for deeper pullbacks toward ~₹157.

Part 2 Intraday Institutional Trading Option Buyers vs Option Sellers
There are two sides to every option contract:
1. Option Buyer (Holder)
Pays a premium
Has limited risk (only premium paid)
Has unlimited profit potential (for calls)
Benefits from volatility
2. Option Seller (Writer)
Receives a premium upfront
Has limited profit (only premium earned)
Has potentially unlimited risk
Benefits when the market remains stable
Buyers look for big moves; sellers look for stability.

Part 1 Intraday Institutional Trading What Are Options?
An option is a financial contract that gives you the right, but not the obligation, to buy or sell an asset at a fixed price—called the strike price—before or on a specific date—called the expiry.
There are two types of options:
1. Call Option
A Call Option gives the holder the right to buy the underlying asset at a fixed price before expiry.
Traders buy calls when they expect the price to go up.
Example: A call option with strike ₹100 on a stock trading at ₹95 becomes profitable if the stock rises above ₹100.
2. Put Option
A Put Option gives the holder the right to sell the underlying asset at a fixed price before expiry.
Traders buy puts when they expect the price to go down.
Example: A put option with strike ₹100 becomes profitable if the stock falls below ₹100.

BTCUSDT Technical Analysis (1H Timeframe)BTCUSDT is showing a bearish structure on the 1H timeframe, with price rejecting strongly from the 71,300–71,800 supply zone and forming lower highs. The recent upside move looks corrective, and price is failing to hold above previous demand, signaling weak bullish momentum.
The key area to watch is 68,888. A breakdown below this level confirms continuation to the downside, with liquidity resting below recent lows. The next major demand zone sits between 68,000 and 67,200, aligning with prior reactions and imbalance.
Trade Setup:
Sell below 68,888 | TP1: 68,000 | TP2: 67,222 | SL: 70,222
Bias remains bearish below 70,200; bullish control only above 71,800.
Disclaimer:
This analysis is for educational purposes only and does not constitute financial advice. Cryptocurrency trading involves significant risk, and losses may exceed your investment. Always do your own research and manage risk properly before entering any trade.

ANGEL ONE - WEEKLY Fibonacci Structure
The Fibonacci retracement is from the major low near 995 to the peak around 3,900. The correction after the rally has been shallow, indicating strength in the broader trend. The 61.8% level near 2,100 has repeatedly acted as a strong demand zone. The 50% retracement around 2,445 continues to behave as a key equilibrium level.
Support and Resistance Zones
The 2,050–2,150 zone remains a major long-term support, supported by multiple price reactions and Fibonacci confluence. On the upside, the 3,800–3,900 region acts as a strong supply zone, resulting in repeated rejections. A descending trendline from the highs is acting as dynamic resistance. The 2,400–2,500 band serves as a critical range midpoint.
Volume Analysis
The rally from lower levels was accompanied by expanding volumes, confirming strong participation. During the consolidation phase, volumes have contracted, indicating a time-wise correction rather than distribution. Volume expansion near key support levels suggests accumulation on declines. The lack of high-volume breakdowns supports structural stability.
Pattern Formation
Price action is forming a broad descending consolidation pattern with lower highs and stable base formation. Sellers are active near the descending trendline, while buyers continue to defend the Fibonacci support zone. This compression suggests declining volatility. A decisive move out of this structure is likely to set the next medium-term trend.
The chart reflects a strong primary uptrend followed by a prolonged consolidation phase. Key Fibonacci levels and horizontal supports remain intact. Volume behaviour indicates accumulation rather than exhaustion. The structure suggests the stock is preparing for a directional expansion.

REFEX 1 Week Time Frame 📌 Current Key Price (Approx)
Live share price around ₹239 – ₹250 on NSE/BSE.
📊 Weekly Technical Levels (Support / Resistance)
🔹 Weekly Support
S3: ~₹205 – ₹217 zone (lower weekly structural support)
S2: ~₹221 – ₹229 range (important near-term weekly support)
S1: ~₹224 – ₹230 (immediate weekly support)
🔸 Weekly Pivot
Pivot Zone: ~₹228 – ₹239 mid-range level — acts as a decision point between bullish and bearish bias in the weekly timeframe.
🔸 Weekly Resistance
R1: ~₹232 – ₹239 (first weekly resistance)
R2: ~₹241 – ₹246 (next hurdle)
R3: ~₹245 – ₹250+ (stronger weekly barrier)
📈 Weekly Chart Bias Interpretation
✔️ Above pivot (~₹228–₹239)
→ Slightly bullish to neutral weekly structure with room to test R2/R3.
❌ Below pivot / failing R1 (~₹232)
→ Bearish pressure could push toward S1/S2 levels.
📌 Weekly indicators (from broader technical sites) suggest current bias is neutral to bearish on weekly timeframe rather than strongly bullish.
🧠 Quick Weekly Snapshot
Support cluster: ~₹217 – ₹229
Key pivot area: ~₹228 – ₹239
Resistance cluster: ~₹241 – ₹250+
Trades tend to respect weekly pivots and S/R levels for reversal or breakout cues. Monitor weekly close above/below pivot zones for the next directional bias. Always combine with volume and momentum indicators for confirmation.

NZDUSD MULTI TIMEFRAME ANALYSIS Hi traders, this is the complete multi-time frame analysis for this pair. Please feel free to ask any questions in the comment section below. The entry will only be made if all strategy rules are met.

Very Short Term View for Nifty (Till April, 2026)Wrap up:-
Nifty has made breakdown below the rising wedge on 09.01.2026 and thereafter, it is retesting the breakout.
Further, Nifty has made breakdown below 24604 which is 38.6% of total rise i.e. from 21743 to 26373. Thereafter, it is assumed/weightaged that wave 5 has been completed. Now, wave Cis running for a min. target of 23359.
In wave c, wave 1 is completed at 25473, wave 2 at 26341and wave 3 is currently in progress.
What I’m Watching for Till April, 2026 🔍
Nifty is now facing a resistance in the zone 25949 to 26086. Low Risk Entry Range is 25949-26086 with a stoploss of 26373 for a probable target of 23359-22647.
Disclaimer: Sharing my personal market view — only for educational purpose not financial advice.

GPIL 1 Day Time Frame 📊 Current Price Snapshot (India)
• GPIL current live price: ~₹250–₹265 range in latest sessions (previous close ~₹250.97 to ~₹262.6 in intraday updates) — this can vary minute-by-minute during market hours.
• 52-week range: ₹145.75 (low) / ₹290.00 (high).
🔎 Daily Pivot Support & Resistance Levels (1-day time frame)
📍 These levels are typically computed from the prior day’s high, low & close and are key short-term reference points:
Classic Pivot (Key Levels)
• R3: ~₹267.07
• R2: ~₹259.48
• R1: ~₹253.97
➡️ Pivot Point (PP): ~₹246.38
• S1: ~₹240.87
• S2: ~₹233.28
• S3: ~₹227.77
✔ Interpretation:
Price above Pivot (~₹246–248) → short-term bullish bias.
Price bounces off S1/S2 → potential support zones if weakness continues.
Break above R2/R3 → stronger continuation of upward momentum.
📈 Alternate Pivot Reference (Daily Standard / Fib Levels)
Another pivot provider suggests similar short-term zones (approx):
• S3 ~₹242.60
• S2 ~₹250.21
• S1 ~₹254.60
• Pivot (CPR mid): ~₹254.60
• R1 ~₹262.21
• R2 ~₹266.60
• R3 ~₹274.21
📌 Moving Averages & Indicators (for context)
• 20/50/100/200 day EMAs are all clustered around mid-to-upper ₹240s–₹250s region — indicating neutral to mixed momentum on daily time frames.
• RSI ~47–48 suggests neutral momentum (neither strongly overbought nor oversold).
📍 What This Means for Today’s Trading
Bullish near-term scenario (price holds above pivot):
✔ If GPIL stays above ₹246–₹250, look for upside toward:
• R1 ~₹254–₹255
• R2 ~₹259–₹262
• R3 ~₹266–₹270+
Bearish near-term scenario (break below support):
✔ If price slips below ₹241–₹237 area:
• S2 ~₹233
• S3 ~₹227+
These levels can act as short-term support zones for pullbacks.

Cup & Handle Pattern: GMDC’s Breakout Opportunity ExplainedGMDC Ltd, currently trading near ₹624 on the daily chart, has formed a cup & handle pattern with a neckline breakout. This is a classic bullish formation in technical analysis, and understanding it can help traders and investors make informed decisions.
☕ What is a Cup & Handle Pattern?
The cup resembles a rounded bottom, showing a period of consolidation after a prior uptrend.
The handle forms as a short pullback or sideways movement, representing the final shakeout of weak hands.
Once the price breaks above the neckline (the resistance level at the rim of the cup), the pattern is considered complete.
📈 Importance in an Uptrend
The cup & handle is a continuation pattern, meaning it usually appears in an existing uptrend.
It signals that after a healthy consolidation, buyers are regaining control.
The breakout often leads to a fresh leg higher, supported by renewed momentum.
🔑 Breakout Significance
A breakout above the neckline confirms the pattern’s completion.
It suggests that demand has overcome supply at that resistance level.
Traders often view this as a high-probability entry point, especially if accompanied by strong volume.
⚖️ Risk Management Principles
Even with a strong pattern, risk management is essential:
Stop-loss placement: Typically below the handle’s low or neckline support.
Position sizing: Avoid over-leveraging; allocate capital wisely.
Confirmation: Enter only after sustained breakout, not on the first tick above resistance.
Diversification: Don’t rely solely on one stock or one pattern.
💡 Opportunity in GMDC
With the neckline breakout confirmed, GMDC’s chart suggests potential for trend continuation.
The breakout aligns with bullish technicals, offering traders an opportunity to ride momentum.
Investors may see this as a sign of strength and accumulation, reinforcing confidence in the stock’s trajectory.
✨ Key Takeaway for Traders & Investors
The cup & handle pattern in GMDC highlights how technical setups can reveal market psychology. A breakout above the neckline signals renewed buying strength and continuation of the uptrend. However, disciplined risk management remains the cornerstone of successful trading.


TATASTEEL: Higher-High Channel → Pullback Likely Before Next BulTATASTEEL is trading within a well-defined rising channel, maintaining a strong higher-high, higher-low structure on higher timeframes. Price is currently testing the upper channel resistance, an area where the market often pauses or retraces rather than extending immediately.
🔍 Key Levels to Watch
Resistance zone: 210 – 212 (upper channel / supply area)
Immediate support: 202 – 200 (shallow pullback zone)
Major support / HL zone: 196 – 192 (ideal Higher Low formation area)
Trend invalidation: Below 188 (structure breakdown)
From a price-action and probability perspective, a pullback or consolidation from this zone would be healthy and could help form the next Higher Low before continuation of the broader uptrend.
This setup offers:
Short-term opportunity for option sellers due to possible consolidation or pullback near resistance
Better risk-reward opportunities for bullish positions on pullbacks toward support zones
As long as price holds above the previous Higher Low and channel support, the primary trend remains bullish.
⚠️ Note
This chart is shared only for study and educational purposes.
This is not a recommendation or financial advice.
Always trade based on your own analysis and risk management.

SIEMENS 1 Day Time Frame 📍 Current approximate price (~₹3,120 – ₹3,170) on NSE today.
📊 Daily Pivot & Key Levels (1Day Timeframe)
🔹 Pivot Point (Central Level): ~₹ 3,206 – ₹ 3,291
(This is the key level where bias turns bullish above or bearish below)
💪 Upside Resistance Levels
Level Price (Approx) Significance
R1 ₹ 3,253 – ₹ 3,333 First resistance on upside
R2 ₹ 3,295 – ₹ 3,366 Next resistance zone
R3 ₹ 3,342 – ₹ 3,407 Major resistance zone
👉 Break above R1–R2 zone signals strength and potential continuation higher.
🛡 Downside Support Levels
Level Price (Approx) Significance
S1 ₹ 3,164 – ₹ 3,258 Immediate support
S2 ₹ 3,117 – ₹ 3,217 Stronger downside support
S3 ₹ 3,075 – ₹ 3,184 Major support before deeper drop
👉 If price falls below S2–S3, watch for increased selling pressure.
🧠 How to use these levels (1-day)
Bullish Scenario
Price above Pivot → focus on R1 → R2 → R3.
Strong breakout above R2 suggests continuation of short-term uptrend.
Bearish Scenario
Price below Pivot → focus on S1 → S2 → S3.
Close below S2 and then S3 indicates sellers gaining control.
⚠️ Notes (Important)
• These levels are based on previous day’s price range calculations (classic pivot) and are useful for intraday to short-term trades.
• Markets are dynamic; verify with live chart and volume before placing trades.

Very Short Term View for NiftyWrap up:-
Currently, Nifty is in final wave 5 which was started from 24337 on 08.08.2025. In the pattern of wave 5, Nifty is forming a wxy pattern. After break of 25318 cordinates of wxy has been changed. Now, Wave w has been completed at 26104 and wave x is expected to be completed at 25171 once nifty breaks and sustains above 25630. Thereafter, wave y is expected to be completed in the range of 26938-27355.
What I’m Watching for 🔍
Buy Nifty when it breaks and sustains above 25630 sl 25171 for a target of 26938-27355.
Disclaimer: Sharing my personal market view — only for educational purpose not financial advice.
"Don't predict the market. Decode them."

CDSL 1 Day Time Frame 📍 Current Price (approx): ₹1,370 – ₹1,400 on NSE (intraday range seen)
📊 Daily Levels (Intraday Technicals)
👉 Pivot & Intraday S/R
Pivot (central reference): ~ ₹1,364 – ₹1,369
Resistance levels (daily):
R1: ~ ₹1,399 – ₹1,403
R2: ~ ₹1,410 – ₹1,420
R3: ~₹1,420 + (short-term upper targets today)
Support levels (daily):
S1: ~ ₹1,350 – ₹1,364
S2: ~ ₹1,330 – ₹1,340
S3: ~ ₹1,315 – ₹1,320
These are classical pivot and Fibonacci pivot support/resistance zones you might see respected in intraday trading.
📈 What This Means in Action
Bullish (if prices hold above pivot):
Above ~ ₹1,370–₹1,380 suggests buyers are trying to control the session.
Initial upside structure near ₹1,400–₹1,420 — breaks above here can shift momentum earlier in the day.
Bearish / downside risk:
If price slides below ₹1,350, the next supports are near ₹1,330 and then ₹1,315–₹1,320 — these are zones where previous intraday lows and pivot support cluster.
Think of ₹1,364 pivot as the key reference: above = short-term buyers probable, below = sellers have more control.
🧠 Quick Notes
📍 These levels are technical reference points for today’s price action — not future targets or investment advice.
📍 Broader context: CDSL has seen mixed technical signals over recent months, with analysts pointing both to breakout potential and to downside risks if key long-term supports fail.

XAGUSD 1H Bearish Trendline Rejection📉 Market Structure
Primary trend: Bearish
Price is making lower highs & lower lows
Clear descending channel visible
The recent rally looks like a corrective pullback, not a trend reversal
🔴 Key Rejection Zone
Resistance: 83.50 – 84.20
Price has been rejected exactly at the descending trendline
Bearish reaction candle + arrow confirms seller dominance
📊Pattern Insight
Structure resembles a bear flag / falling channel
Impulse down → consolidation → rejection → continuation expected
Trendline break did NOT happen → bearish continuation favored
❌ Invalidation
Hourly close above 85.00 setup
Clean breakout + hold above descending trendline→ would delay or invalidate bearish setup

BTCUSD ANALYSIS OVER H1 CHARTMonitoring BTCUSD for a potential short-term sell setup as price reacts around key resistance and structure.
Waiting for confirmation to define precise entry, targets, and risk levels.
Looking for a selling opportunity in BTC

US Dollar Index (DXY)1. What is the US Dollar Index (DXY)?
The US Dollar Index (DXY) is a financial index that measures the strength or weakness of the US dollar (USD) relative to a basket of major global currencies.
It represents how the US dollar is performing in the international foreign exchange (forex) market.
The index helps traders, investors, policymakers, and economists track global confidence in the US dollar.
2. Origin and History of DXY
The US Dollar Index was introduced in 1973 by the Federal Reserve.
Its creation followed the collapse of the Bretton Woods system, when currencies moved from fixed exchange rates to floating rates.
Later, responsibility for the index shifted to ICE (Intercontinental Exchange), which now maintains and publishes it.
3. Base Value of the Index
The base value of DXY is 100.
A reading above 100 means the US dollar has strengthened compared to the base year.
A reading below 100 means the US dollar has weakened.
4. Currency Basket Composition
The DXY is calculated against six major currencies, each with a specific weight:
Euro (EUR) – ~57.6%
Japanese Yen (JPY) – ~13.6%
British Pound (GBP) – ~11.9%
Canadian Dollar (CAD) – ~9.1%
Swedish Krona (SEK) – ~4.2%
Swiss Franc (CHF) – ~3.6%
The Euro has the largest influence, meaning EUR/USD movements heavily impact DXY.
5. How DXY is Calculated
DXY is calculated using a geometric weighted average of the six currencies.
It uses exchange rates between the US dollar and each currency.
The formula gives more weight to currencies with larger trade relationships with the US.
6. What Does a Rising DXY Indicate?
A rising DXY indicates:
Strengthening US dollar
Increased global demand for USD
Capital flowing into US assets
Often reflects:
Higher US interest rates
Strong US economic data
Global risk aversion (safe-haven demand)
7. What Does a Falling DXY Indicate?
A falling DXY indicates:
Weakening US dollar
Reduced demand for USD
Capital moving out of US assets
Often reflects:
Lower interest rates
Expansive monetary policy
Improved global risk sentiment
8. Relationship Between DXY and Interest Rates
DXY is strongly influenced by US interest rates, especially Federal Reserve policy.
Higher interest rates:
Attract foreign investment
Strengthen USD
Push DXY upward
Lower interest rates:
Reduce yield advantage
Weaken USD
Push DXY downward
9. Role of the Federal Reserve
The Federal Reserve (Fed) plays a critical role in DXY movement.
Key Fed tools affecting DXY:
Interest rate decisions
Quantitative easing (QE)
Quantitative tightening (QT)
Forward guidance
Hawkish Fed → Stronger DXY
Dovish Fed → Weaker DXY
10. DXY as a Global Risk Indicator
DXY often behaves as a safe-haven indicator.
During global crises:
Investors rush to USD
DXY rises sharply
During risk-on environments:
Investors seek higher returns elsewhere
DXY weakens
11. Impact of DXY on Commodities
Most global commodities are priced in USD.
Relationship:
Strong DXY → Commodities become expensive → Prices fall
Weak DXY → Commodities cheaper → Prices rise
Strong inverse correlation with:
Gold
Silver
Crude oil
12. Relationship Between DXY and Gold
Gold and DXY usually move in opposite directions.
When DXY rises:
Gold becomes expensive in other currencies
Demand falls
When DXY falls:
Gold demand rises as hedge against USD weakness
13. Impact of DXY on Equity Markets
Strong DXY:
Hurts US exporters
Can pressure emerging market equities
Weak DXY:
Benefits multinational companies
Supports global equity markets
14. DXY and Emerging Markets
Emerging markets often have USD-denominated debt.
Strong DXY:
Debt servicing becomes expensive
Capital outflows from EMs
Weak DXY:
Eases financial pressure
Encourages capital inflows
15. DXY and Indian Markets
DXY has a major influence on:
INR exchange rate
FII flows
Crude oil prices
Rising DXY:
Rupee depreciation
FII selling pressure
Falling DXY:
Rupee appreciation
Improved liquidity for Indian equities
16. DXY in Forex Trading
DXY is widely used by forex traders as a directional bias tool.
If DXY is bullish:
USD pairs like USD/JPY, USD/INR tend to rise
If DXY is bearish:
Pairs like EUR/USD, GBP/USD tend to rise
17. DXY Technical Analysis
Traders analyze DXY using:
Support and resistance levels
Trendlines
Moving averages
RSI and MACD
Breakouts in DXY often lead to strong trends across global markets.
18. DXY Futures and Trading Instruments
DXY can be traded via:
Futures contracts (ICE Exchange)
ETFs like UUP
CFDs
Used for:
Hedging currency exposure
Speculative trading
19. Limitations of the DXY
Currency basket is Euro-heavy
Does not include:
Chinese Yuan
Indian Rupee
May not fully reflect modern global trade dynamics
20. DXY vs Broad Dollar Index
Broad Dollar Index includes currencies of:
China
Mexico
South Korea
DXY is narrower but more widely followed in markets
21. Long-Term Trends in DXY
DXY tends to move in long cycles:
Multi-year bull and bear phases
Driven by:
Interest rate cycles
Economic leadership
Global capital flows
22. Why DXY is Important for Traders and Investors
Acts as a global macro compass
Helps anticipate:
Commodity trends
Equity market movements
Currency volatility
Essential for:
Forex traders
Commodity traders
Equity investors
23. Summary
DXY is a powerful indicator of US dollar strength
Influences almost every global asset class
Reflects macroeconomic, monetary, and geopolitical trends
Understanding DXY helps investors make better cross-market decisions

Future of Global Currency – Key Trends and Directions1. Gradual Shift from Dollar Dominance
The US Dollar has dominated global trade and reserves for decades, but its absolute dominance is slowly declining.
Rising US debt, repeated sanctions, and geopolitical tensions are pushing countries to reduce over-reliance on the dollar.
De-dollarization does not mean the end of the dollar, but a move toward a more multipolar currency system.
In the future, the dollar will remain important, but share of global reserves will decrease.
2. Rise of a Multipolar Currency System
Instead of one dominant currency, multiple currencies will coexist with regional influence.
Key players:
US Dollar (USD) – global trade, finance, commodities.
Euro (EUR) – Europe and nearby trade zones.
Chinese Yuan (CNY) – Asia, Belt & Road countries.
Japanese Yen (JPY) and British Pound (GBP) – financial hubs.
This system reduces global risk concentration and increases flexibility.
3. Expansion of Central Bank Digital Currencies (CBDCs)
Many countries are launching or testing digital versions of their national currencies.
Examples: Digital Yuan (China), Digital Rupee (India), Digital Euro, Digital Dollar (planned).
Benefits:
Faster cross-border payments
Lower transaction costs
Improved transparency and traceability
CBDCs may replace physical cash partially, especially in urban economies.
4. Digital Currencies Will Redefine Cross-Border Payments
Traditional cross-border transactions are slow and expensive.
Future systems will:
Settle payments in seconds instead of days
Operate 24/7
Reduce dependence on intermediaries like SWIFT
CBDC-to-CBDC bridges will allow direct settlement between countries.
5. Increasing Role of Regional Trade Currencies
Countries are increasingly settling trade in local currencies instead of USD.
Examples:
China–Russia trade in Yuan and Ruble
India–Russia trade in Rupees
ASEAN regional currency usage
This trend strengthens domestic currencies and reduces foreign exchange risk.
Regional currency blocs will gain importance in the next decade.
6. Commodities Priced in Multiple Currencies
Oil, gold, and major commodities have traditionally been priced in USD.
Future developments may include:
Oil priced in Yuan, Euro, or local currencies
Gold-backed trade settlement mechanisms
This reduces monopoly pricing power and increases currency competition.
7. Growing Importance of Gold and Reserve Diversification
Central banks are increasing gold reserves to hedge against currency instability.
Gold remains a neutral, trust-based asset during geopolitical uncertainty.
Future reserves will include:
Gold
Multiple foreign currencies
Strategic commodities
This supports long-term monetary stability.
8. Stablecoins Will Complement Traditional Currencies
Stablecoins are digital tokens backed by fiat currencies.
They offer:
Speed
Global accessibility
Lower transaction costs
Governments will regulate them more strictly.
Stablecoins may act as bridge currencies between digital and traditional systems.
9. Declining Role of Physical Cash
Cash usage is decreasing due to:
Digital wallets
Mobile banking
Contactless payments
However, cash will not disappear completely.
In developing economies, cash will coexist with digital systems for decades.
10. Technology Will Drive Currency Evolution
Blockchain, AI, and fintech will:
Improve settlement accuracy
Reduce fraud
Increase financial inclusion
Smart contracts will automate currency exchange and trade finance.
Currency systems will become more efficient, transparent, and programmable.
11. Geopolitics Will Shape Currency Power
Currency influence will increasingly depend on:
Economic strength
Military power
Trade alliances
Technological leadership
Sanctions will push countries to create alternative payment systems.
Currency power will be a key tool of diplomacy.
12. China’s Yuan Will Gain Global Presence
China is actively internationalizing the Yuan.
Drivers:
Belt & Road Initiative
Energy trade settlements
Digital Yuan adoption
Challenges remain:
Capital controls
Trust and transparency issues
Still, Yuan’s global role will expand steadily.
13. Emerging Markets Will Gain Monetary Influence
Countries like India, Brazil, Indonesia, and UAE are strengthening their currencies.
Local currency trade agreements will grow.
Emerging markets will:
Reduce FX risk
Improve monetary sovereignty
Over time, this shifts global currency balance.
14. Inflation and Debt Will Influence Currency Trust
High inflation and excessive money printing reduce currency credibility.
Future currencies must maintain:
Price stability
Fiscal discipline
Strong governance
Trust will be the core determinant of currency value.
15. Possible Creation of Supranational Digital Units
Institutions may develop global digital settlement units.
Examples:
IMF’s Special Drawing Rights (SDRs) in digital form
These may be used for:
Large-scale trade
Intergovernmental settlements
Not a replacement for national currencies, but a supplement.
16. Financial Inclusion Will Expand Through Digital Currency
Digital currencies reduce dependency on banks.
Benefits:
Access for unbanked populations
Cheaper remittances
Faster aid distribution
This can reshape global economic participation.
17. Increased Regulation and Cybersecurity Focus
Governments will regulate digital currencies heavily.
Cybersecurity will become critical to protect national financial systems.
Future currencies must be:
Secure
Resilient
Privacy-balanced
18. Currency Volatility Will Increase in Transition Phase
As the system evolves, short-term volatility will rise.
Investors and traders must adapt to:
Multiple reserve currencies
Changing interest rate dynamics
Long-term stability will emerge after adjustment.
19. No Single Currency Will Fully Replace the Dollar Soon
Despite challenges, no alternative currently matches the dollar’s scale, liquidity, and trust.
The future is evolution, not replacement.
The dollar will remain central but less dominant.
20. Final Outlook
The future of global currency is:
Digital
Multipolar
Technology-driven
Geopolitically influenced
Countries that adapt early will gain strategic advantage.
Currency power will be about trust, innovation, and cooperation, not just size.
