FOREX PAIRS IN PLAY session 29 10 02 26Scanning multiple forex pairs to filter high-quality trade setups. No trades are forced—only structure-based opportunities.
Note: There may be a delay in this video due to upload processing time.
Disclaimer: FX trading involves high leverage and substantial risk, and losses can exceed your initial investment. This content is for educational purposes only and should not be considered financial advice. Trade at your own risk.
Community ideas

Reserve Currency Dominance: Meaning, Mechanisms, and ImplicationWhat Makes a Currency a Reserve Currency?
For a currency to become dominant, several structural conditions must exist:
Economic Size and Trade Influence
The issuing country must have a large, productive, and globally integrated economy. Nations prefer holding reserves in currencies linked to economies that drive global trade and demand.
Deep and Liquid Financial Markets
A dominant reserve currency must be supported by large, transparent, and liquid financial markets. Investors and central banks need safe assets—such as government bonds—that can be bought or sold quickly without major price disruption.
Political and Institutional Stability
Trust is essential. Countries must believe that the issuing nation has strong institutions, an independent central bank, and respect for property rights and contracts.
Convertibility and Capital Mobility
The currency must be freely convertible with minimal capital controls. Restrictions reduce its usefulness as a global reserve.
Network Effects
Once widely used, a currency becomes even more attractive because everyone else uses it. This self-reinforcing loop is a major reason reserve currency dominance is difficult to challenge.
The US Dollar and Its Dominance
The US dollar’s dominance emerged after World War II with the Bretton Woods system, which linked global currencies to the dollar, and the dollar to gold. Even after the gold standard ended in 1971, the dollar retained its central role due to the sheer size of the US economy and its financial markets.
Today, the US dollar:
Accounts for around 60% of global foreign exchange reserves
Is involved in nearly 90% of foreign exchange transactions
Dominates global trade invoicing, especially in commodities like oil, gas, and metals
Serves as the primary currency for international debt issuance
US Treasury securities are considered the safest and most liquid assets in the world, making them the cornerstone of global reserves.
Benefits of Reserve Currency Dominance
1. Lower Borrowing Costs
Countries issuing the dominant reserve currency can borrow at lower interest rates. Global demand for their assets keeps yields low, even during periods of high debt.
2. Seigniorage Advantage
The issuing country benefits from seigniorage—the ability to create money at low cost while foreigners hold and use that currency.
3. Financial Power and Sanctions
Reserve currency dominance grants geopolitical leverage. Control over payment systems and settlement currency allows the issuing country to enforce economic sanctions effectively.
4. Crisis Flexibility
During global crises, demand for the dominant reserve currency often increases, strengthening the issuing country’s financial position rather than weakening it.
Costs and Risks of Dominance
Despite its advantages, reserve currency dominance also carries costs:
1. Persistent Trade Deficits
The issuing country often runs large trade deficits because global demand for its currency pushes up its value, making exports less competitive.
2. Financial Volatility Spillovers
Changes in interest rates or monetary policy in the dominant currency country can destabilize emerging and developing economies.
3. Domestic Economic Distortions
Easy access to cheap capital can encourage excessive debt accumulation and asset bubbles.
4. Global Dependency
Over-reliance on a single currency increases systemic risk. A crisis in the dominant currency country can ripple across the entire global financial system.
Challenges to Dollar Dominance
While the US dollar remains dominant, several forces are gradually reshaping the landscape:
The Euro
The euro is the second most important reserve currency. However, fragmented fiscal policies and political differences among eurozone members limit its ability to fully rival the dollar.
The Chinese Renminbi (Yuan)
China has actively promoted international use of the yuan through trade agreements, currency swap lines, and alternative payment systems. However, capital controls, limited financial transparency, and political concerns restrict its reserve appeal.
Gold and Alternative Assets
Some central banks are increasing gold holdings to diversify reserves and reduce dependence on any single currency.
Digital Currencies
Central bank digital currencies (CBDCs) and blockchain-based settlement systems could reduce reliance on traditional reserve currencies over time, though they are unlikely to displace dominant currencies in the near future.
De-Dollarization: Reality vs. Rhetoric
In recent years, the term “de-dollarization” has gained attention, referring to efforts by some countries to reduce reliance on the US dollar. While bilateral trade in local currencies has increased, this does not yet constitute a true challenge to dollar dominance.
Reserve currency dominance is not easily dismantled. It requires not only economic size, but also trust, openness, legal credibility, and decades of consistent policy behavior. At present, no alternative currency meets all these criteria at scale.
Implications for Emerging Markets
For emerging economies, reserve currency dominance has mixed effects:
Easier access to global trade and finance when using the dominant currency
Vulnerability to exchange-rate swings and capital flows driven by foreign monetary policy
Limited monetary independence, often referred to as the “global financial cycle”
As a result, many emerging markets pursue reserve diversification while continuing to rely heavily on the dominant currency.
Conclusion
Reserve currency dominance is a cornerstone of the global financial system. It reflects economic power, institutional credibility, and deep financial integration rather than political declaration alone. While the dominance of the US dollar faces long-term structural challenges from multipolar economic growth, its position remains deeply entrenched due to network effects, trust, and unmatched financial depth.
The future is likely to see greater diversification, not outright replacement. Reserve currency dominance may slowly evolve toward a more multipolar system, but history shows that such transitions occur over decades, not years. Until credible alternatives emerge with comparable scale and stability, the dominant reserve currency will continue to shape global trade, finance, and geopolitics.

America’s Financial InfluenceAmerica’s Financial Influence on the Global Economy
America (the United States of America) holds the most powerful and far-reaching financial influence in the world. Its economy, currency, institutions, markets, and policies shape global trade, capital flows, investment decisions, and even political outcomes. The following points explain how and why the U.S. dominates global finance.
1. Size of the U.S. Economy
The United States has the largest economy in the world by nominal GDP.
A large economy means higher production, consumption, and investment capacity.
Many global companies depend heavily on American consumers for revenue.
Economic growth or slowdown in the U.S. affects global demand and supply chains.
2. Dominance of the U.S. Dollar
The U.S. dollar is the world’s primary reserve currency.
Central banks hold a large portion of their foreign exchange reserves in dollars.
Most international trade (oil, gold, commodities) is priced in dollars.
This gives the U.S. unmatched power over global liquidity and capital flows.
3. Control Over Global Trade Settlements
International payments largely move through dollar-based systems.
Even trade between two non-U.S. countries often settles in dollars.
This increases global demand for dollars and strengthens U.S. financial leverage.
4. Federal Reserve’s Global Impact
The U.S. Federal Reserve (Fed) is the most influential central bank in the world.
Changes in U.S. interest rates impact:
Global bond yields
Currency movements
Capital flows to emerging markets
When the Fed tightens policy, money flows back to the U.S., affecting global markets.
5. Wall Street and Capital Markets Power
The U.S. hosts the world’s largest and most liquid financial markets.
Stock exchanges like NYSE and NASDAQ dominate global equity trading.
Major global companies list their shares in the U.S. to access capital.
American markets set global benchmarks for valuation and risk pricing.
6. Strength of U.S. Financial Institutions
Leading global banks, investment firms, and insurers are American.
Institutions like JPMorgan Chase, Goldman Sachs, BlackRock, and Morgan Stanley influence global capital allocation.
U.S. asset managers control trillions of dollars invested worldwide.
7. Influence Through International Institutions
The U.S. has major influence over institutions such as:
International Monetary Fund (IMF)
World Bank
World Trade Organization (WTO)
Voting power and leadership roles allow the U.S. to shape global financial rules.
8. Sanctions as a Financial Weapon
America uses its financial dominance to impose economic sanctions.
Countries or companies cut off from the U.S. dollar system face severe financial stress.
Sanctions can freeze assets, block trade, and restrict global market access.
This makes U.S. financial policy a powerful geopolitical tool.
9. U.S. Treasury Bonds as Global Safe Assets
U.S. government bonds are considered the safest investment globally.
During global crises, investors rush to U.S. Treasuries.
This allows the U.S. to borrow at lower interest rates than other countries.
No other country enjoys such consistent global trust.
10. Role in Global Investment Flows
The U.S. is both the largest source and destination of foreign direct investment (FDI).
American companies invest across the world in manufacturing, technology, and services.
Foreign investors view the U.S. as a stable and profitable investment destination.
11. Leadership in Financial Innovation
The U.S. leads in financial innovation such as:
Venture capital
FinTech
Derivatives and structured products
Silicon Valley and Wall Street drive innovation in digital payments, AI finance, and crypto markets.
12. Influence Over Commodity Markets
Key commodity exchanges are U.S.-based.
Oil (WTI), gold, and agricultural products are traded mainly in dollars.
Price discovery in global commodities often starts in U.S. markets.
13. Corporate Power and Multinational Reach
American multinational corporations dominate global sectors like:
Technology
Finance
Energy
Defense
Their revenues, profits, and investment decisions influence global economic trends.
14. Impact on Emerging Markets
U.S. interest rate changes directly affect emerging economies.
Dollar appreciation increases debt burden for countries with dollar-denominated loans.
Capital inflows and outflows are often driven by U.S. monetary policy.
15. Trade Deficit as Financial Advantage
Despite running trade deficits, the U.S. benefits because:
It pays for imports in its own currency
Dollars flow back through investments in U.S. assets
This unique privilege is known as “exorbitant privilege.”
16. Legal and Regulatory Influence
U.S. financial laws often apply globally due to dollar usage.
Companies worldwide comply with U.S. regulations to access American markets.
This extends U.S. legal authority beyond its borders.
17. Military and Financial Power Link
U.S. military dominance supports confidence in its financial system.
Strong defense ensures political stability and protects trade routes.
Financial power and military strength reinforce each other.
18. Crisis Leadership Role
During global financial crises, the U.S. often leads rescue efforts.
The Federal Reserve provides dollar liquidity to other central banks.
This reinforces trust in U.S. leadership during instability.
19. Cultural and Psychological Influence
Confidence in the U.S. economy shapes investor psychology.
U.S. market trends influence global sentiment and risk appetite.
Wall Street performance often dictates global market direction.
20. Challenges to U.S. Financial Dominance
Rising competition from China and regional currencies
Efforts to reduce dollar dependence
Growth of digital currencies
However, no alternative currently matches the scale and trust of the U.S. system.
Conclusion
America’s financial influence is unmatched due to its economic size, dollar dominance, deep capital markets, institutional power, and global trust. The U.S. shapes global finance not only through wealth but also through rules, systems, and confidence. While challenges exist, America remains the central pillar of the global financial architecture, making its economic decisions crucial for the entire world.

Dollar Strength and Weakness in the Trading MarketThe US Dollar (USD) is the most influential currency in the global financial system. It acts as the world’s primary reserve currency, the main medium for international trade, and the benchmark against which most assets are priced. Because of this central role, dollar strength or weakness directly impacts forex, commodities, equities, bonds, and even emerging markets like India. Understanding how and why the dollar moves is essential for traders, investors, and policymakers.
What Is Dollar Strength?
Dollar strength means the US Dollar is appreciating in value relative to other currencies such as the euro (EUR), Japanese yen (JPY), British pound (GBP), or emerging market currencies like INR.
In trading terms:
USD pairs move up (e.g., USD/INR rises)
Non-USD pairs move down (e.g., EUR/USD falls)
Key Causes of Dollar Strength
1. Higher US Interest Rates
Interest rates are the single most powerful driver of dollar strength.
When the Federal Reserve (Fed) raises interest rates, US assets offer better returns.
Global capital flows into US bonds, treasury bills, and equities.
Demand for dollars increases → dollar strengthens.
This is why traders closely track:
Fed policy meetings
Inflation (CPI, PCE)
Employment data (Non-Farm Payrolls)
2. Strong US Economic Data
A robust US economy attracts global investment.
Indicators that boost the dollar:
Strong GDP growth
Rising consumer spending
Low unemployment
Stable inflation
When US data beats expectations, traders often buy USD aggressively.
3. Safe-Haven Demand
The dollar is considered a safe-haven currency.
During:
Global recessions
Financial crises
Wars or geopolitical tensions
Stock market crashes
Investors move money into USD assets, strengthening the dollar.
4. Capital Repatriation
US multinational companies repatriating profits increase dollar demand, especially during periods of global uncertainty.
What Is Dollar Weakness?
Dollar weakness occurs when the USD depreciates against other currencies.
In trading terms:
USD pairs move down (e.g., USD/JPY falls)
Non-USD pairs move up (e.g., EUR/USD rises)
Key Causes of Dollar Weakness
1. Lower Interest Rates or Rate Cuts
When the Fed:
Cuts interest rates
Signals a dovish stance
Returns on US assets decline, pushing capital toward higher-yielding markets. Demand for USD falls, leading to weakness.
2. Loose Monetary Policy (Money Printing)
Quantitative easing (QE) increases dollar supply in the system.
More dollars chasing the same assets = weaker dollar.
3. High US Debt and Fiscal Deficits
Large government spending and rising debt reduce confidence in the long-term value of the dollar.
Traders begin pricing in:
Currency depreciation
Inflation risks
4. Risk-On Market Environment
In strong global growth phases:
Investors move toward equities, commodities, and emerging markets
Demand for the dollar drops
This creates dollar weakness.
Impact of Dollar Strength and Weakness on Different Markets
1. Forex Market
The forex market reacts instantly to dollar moves.
Dollar strength → EUR/USD ↓, GBP/USD ↓, USD/JPY ↑
Dollar weakness → EUR/USD ↑, GBP/USD ↑, USD/INR ↓
Emerging market currencies are highly sensitive to dollar movements because of capital flows.
2. Commodities Market
Most commodities are priced in USD.
Dollar Strength:
Commodities become expensive for non-US buyers
Gold, crude oil, copper prices tend to fall
Dollar Weakness:
Commodities become cheaper globally
Gold and oil often rally
This is why gold is often seen as an inverse dollar trade.
3. Equity Markets
US Equities
Moderate dollar strength can be positive for US stocks
Excessive dollar strength hurts US exporters (lower overseas earnings)
Emerging Markets (India, Brazil, etc.)
Strong dollar → FII outflows → stock market pressure
Weak dollar → FII inflows → equity market rally
For Indian traders, USD/INR is a key sentiment indicator.
4. Bond Market
Strong dollar → higher US yields → bond prices fall
Weak dollar → lower yields → bond prices rise
Global bond flows are tightly linked to dollar expectations.
Dollar Cycle Concept
The dollar moves in long-term cycles.
Dollar Strength Cycle
Fed tightening
Capital flows into US
Pressure on emerging markets
Commodity weakness
Dollar Weakness Cycle
Fed easing
Capital flows to emerging markets
Commodity boom
Equity rallies outside the US
Smart traders align their strategies with the current dollar cycle rather than fighting it.
How Traders Use Dollar Strength and Weakness
1. Directional Trading
Forex traders directly trade USD pairs based on:
Fed expectations
Inflation trends
Risk sentiment
2. Intermarket Analysis
Professional traders connect:
Dollar Index (DXY)
Gold
Crude oil
Equity indices
Example:
Rising DXY + falling gold = risk-off signal
3. Hedging
Corporates and investors hedge:
Import costs
Export revenues
Foreign investments
A strong dollar hurts importers and benefits exporters.
Dollar Index (DXY)
The Dollar Index (DXY) measures USD strength against a basket of major currencies.
Rising DXY = dollar strength
Falling DXY = dollar weakness
Traders use DXY as:
A confirmation tool
A sentiment indicator
A risk gauge for global markets
Dollar and Indian Markets (Special Context)
For India:
Strong dollar → weaker INR → higher import costs → inflation risk
Weak dollar → stronger INR → stable inflation → positive equity sentiment
Sectors impacted:
IT benefits from a strong dollar
Oil marketing companies suffer when dollar strengthens
Metals and pharma benefit from dollar weakness
Conclusion
Dollar strength and weakness are not just currency movements—they are reflections of global liquidity, risk appetite, interest rate differentials, and economic confidence. The US Dollar acts as the heartbeat of the global trading system. When it strengthens, capital consolidates in the US and global risk reduces. When it weakens, liquidity flows outward, fueling growth in commodities and emerging markets.

Competitive Currency War: Meaning, Causes, and Global ImpactA competitive currency war refers to a situation in which countries deliberately attempt to devalue their own currencies in order to gain an economic advantage over other nations. The primary objective is to make exports cheaper, imports more expensive, and thereby improve trade balances, boost domestic growth, and protect employment. However, when many countries pursue this strategy simultaneously, it can lead to economic instability, retaliation, and long-term damage to the global financial system.
The term “currency war” became popular after the 2008 global financial crisis, when several major economies adopted aggressive monetary policies that indirectly weakened their currencies. Although competitive devaluation may offer short-term benefits, it often creates lose-lose outcomes when practiced globally.
Historical Background
Currency wars are not new. One of the earliest and most damaging examples occurred during the 1930s Great Depression. Countries abandoned the gold standard and deliberately devalued their currencies to stimulate exports. Instead of recovery, this led to trade retaliation, collapsing global trade, and deeper economic distress.
In modern times, currency wars have re-emerged due to:
Globalization of trade and finance
Free-floating exchange rate systems
Capital mobility across borders
Central banks’ expanded role in economic management
The post-2008 era and later the COVID-19 crisis intensified currency competition as nations attempted to revive growth using unconventional monetary tools.
Why Do Countries Engage in Currency Wars?
Countries resort to competitive currency devaluation for several economic and political reasons:
1. Boosting Exports
A weaker currency makes a country’s goods and services cheaper in international markets, increasing export competitiveness.
2. Reducing Trade Deficits
Devaluation discourages imports by making them more expensive while promoting domestic production.
3. Stimulating Economic Growth
Export-led growth helps increase industrial output, employment, and GDP, especially during recessions.
4. Fighting Deflation
A weaker currency raises import prices, helping central banks combat deflationary pressures.
5. Protecting Domestic Industries
Governments may weaken their currencies to shield local industries from foreign competition.
Tools Used in Currency Wars
Countries do not openly announce currency wars. Instead, they use indirect policy tools that influence exchange rates.
1. Monetary Policy Easing
Central banks cut interest rates or keep them near zero, reducing returns on domestic assets and pushing investors toward higher-yielding currencies.
2. Quantitative Easing (QE)
Large-scale asset purchases increase money supply, putting downward pressure on the currency.
3. Foreign Exchange Market Intervention
Central banks buy or sell foreign currencies directly to influence exchange rates.
4. Capital Controls
Restrictions on capital inflows or outflows can weaken or stabilize domestic currencies.
5. Verbal Intervention
Statements by policymakers signaling a preference for a weaker currency can influence market expectations.
How a Competitive Currency War Escalates
A currency war typically follows this pattern:
One country weakens its currency to gain trade advantage
Trading partners experience export pressure
Other countries retaliate with similar policies
Global exchange rates become volatile
Trade tensions escalate into protectionism
This chain reaction undermines international cooperation and damages trust among economies.
Impact on the Global Economy
1. Increased Exchange Rate Volatility
Currency wars create uncertainty in forex markets, discouraging long-term investment and trade planning.
2. Trade Tensions and Protectionism
Countries may impose tariffs or trade barriers to counter perceived unfair advantages, leading to trade wars.
3. Inflation Risks
Currency devaluation raises import prices, potentially causing inflation in import-dependent economies.
4. Capital Flow Instability
Hot money flows into higher-yielding or safer currencies, destabilizing emerging markets.
5. Global Growth Slowdown
When everyone devalues, no country gains a lasting advantage, resulting in weaker global demand.
Effects on Emerging Markets
Emerging economies are often the biggest victims of currency wars.
Sudden capital inflows cause asset bubbles
Rapid outflows lead to currency crashes
Foreign-currency debt becomes more expensive
Central banks face pressure to intervene
For example, when advanced economies adopt ultra-loose monetary policies, excess liquidity flows into emerging markets, only to reverse abruptly when conditions change.
Competitive Currency War vs Trade War
Although related, currency wars and trade wars are different:
Aspect Currency War Trade War
Tool Exchange rate policies Tariffs & quotas
Objective Export competitiveness Protect domestic industries
Visibility Indirect Direct
Speed Gradual Immediate
Often, a currency war precedes or accompanies a trade war, intensifying global economic conflict.
Role of International Institutions
Institutions like the International Monetary Fund (IMF) and G20 attempt to discourage currency wars by promoting:
Market-determined exchange rates
Policy coordination
Transparency in monetary policy
However, enforcement is weak, as countries prioritize domestic economic stability over global cooperation.
Is Currency Devaluation Always Bad?
Not necessarily. Occasional and moderate currency adjustments can help economies correct imbalances. Problems arise when:
Devaluation is aggressive and sustained
Multiple countries act simultaneously
Policies are politically motivated rather than economically justified
In such cases, currency wars distort markets and create systemic risks.
Conclusion
A competitive currency war is a complex and risky strategy where countries attempt to gain economic advantage by weakening their currencies. While it may offer short-term relief in exports and growth, widespread participation leads to global instability, retaliation, and reduced trust in international markets. History shows that currency wars rarely produce lasting winners and often end with slower growth, higher volatility, and deeper economic divisions.
In an interconnected world economy, cooperation and balanced macroeconomic policies are far more effective than competitive devaluation. Avoiding currency wars is essential for sustainable global growth, financial stability, and long-term prosperity.

XAUUSD H1 – Compression before expansion? Key zones determine moGold is coiling inside a tightening structure — volatility expansion is approaching
📊 Market Structure & Technical Outlook (H1)
Price is trading inside a symmetrical compression formed by:
Descending trendline from prior high
Rising demand trendline from February lows
Previous CHOCH + BOS indicate the bearish momentum has weakened
Current price is balancing, waiting for liquidity to be taken on either side
➡️ This is a reaction market — patience > prediction
🧱 Key Price Zones
🟢 Primary BUY ZONE (Demand)
4,860 – 4,835
Strong H1 demand
Reaction zone from prior impulse
Confluence with ascending trendline
🟡 Decision / Mid Zone
5,020 – 4,980
Structure pivot
Acceptance above favors upside continuation
🔴 SELL / Liquidity Zones (FVG)
FVG 1: 5,265
FVG 2 (Major Target): 5,350
🎯 Trade Scenarios
🔵 Primary Scenario – Buy the Dip
Look for bullish confirmation inside 4,860 – 4,835
Entry only after:
Strong rejection
Bullish H1 / M30 candle close
Upside Targets:
TP1: 5,100
TP2: 5,265
TP3: 5,350 (Major FVG + liquidity)
🔴 Alternative Scenario – Break & Fail
If price fails to hold above 4,835, expect deeper pullback toward lower structure
No blind buys below demand
❌ Invalidation
H1 close below 4,780 → bullish bias invalid
🌍 Fundamental Context
Gold remains sensitive to:
Fed policy uncertainty
Expectations around future rate cuts
Ongoing demand for safe-haven assets
With high-impact US events ahead, liquidity grabs and fake moves are likely before direction is confirmed

XAUUSD M30 – High Volatility | Trade by ZonesGold is trading in a strong volatile phase on M30 after breaking out of the descending channel and shifting into a short-term bullish structure. However, price is now entering a decision area, where fake breakouts and deep pullbacks are highly likely.
➡️ This is a two-way market: reactions at key zones will define the next move.
🧠 Market Context (M30)
Previous bearish channel breakout confirmed
Price is holding above the rising trendline → bullish structure still valid
Volatility remains elevated → expect deep pullbacks before continuation
Intraday Bias: Bullish above key demand, but not a straight move up.
📐 Key Zones on Chart
🔴 Supply / Resistance Zones
5,046 – 5,050
→ Major intraday supply & trendline confluence
4,986 – 4,990
→ Short-term resistance / reaction zone
🔵 Demand / Support Zones
4,952 – 4,945
→ Intraday demand, pullback buy zone
4,891 – 4,880
→ Strong demand + structure support (critical zone)
🎯 Trade Scenarios
🔵 BUY Scenario – Demand Reaction (Preferred)
Only consider buys after clear bullish confirmation (rejection wicks, strong M30 close).
Buy Zone 1: 4,952 – 4,945
Buy Zone 2: 4,891 – 4,880
Targets
TP1: 4,986
TP2: 5,046
TP3: 5,080 – 5,100 (extended if momentum holds)
🔴 SELL Scenario – Supply Rejection (Counter-trend)
Short only if price fails to hold above supply and shows bearish rejection.
Sell Zone: 5,046 – 5,080
Targets
TP1: 4,986
TP2: 4,952
TP3: 4,891
❌ Invalidation Levels
M30 close below 4,880 → bullish structure breaks
Clean breakout & hold above 5,080 → bearish scenario invalid

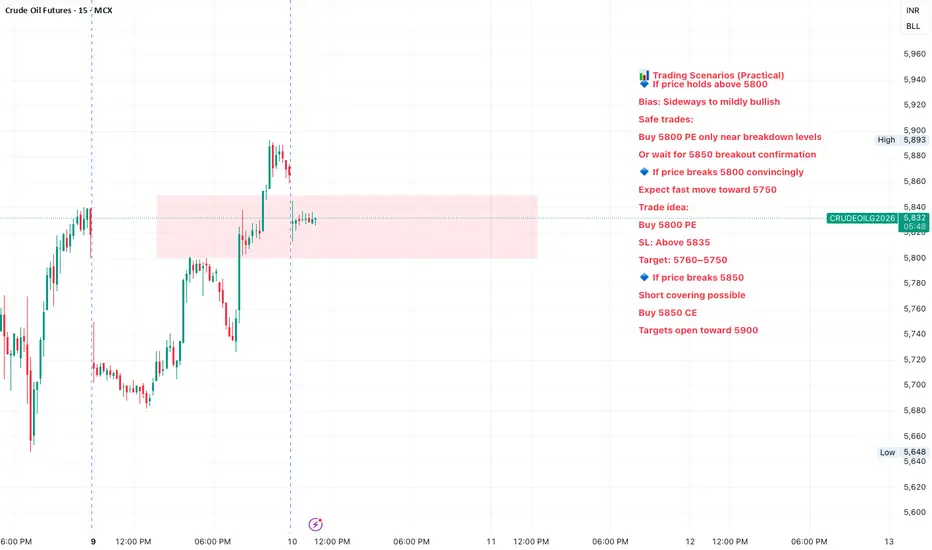
MCX Crude Oil option chain (17 FEB 2026 expiry)📌 Key Observations (Very Important)
🟥 CALL SIDE (Resistance)
5800 CE
Heavy OI build-up
Good volume
This acts as immediate resistance
5850 CE
Further resistance if price moves up
Calls are seeing price decay (Abs Chng negative) → mild bearish / range-bound bias
👉 Meaning: Upside is capped unless 5800 breaks decisively.
🟩 PUT SIDE (Support)
5800 PE
Strong OI + good volume
Buyers active here
5750 PE
Next strong support
Puts show positive price change → demand present
👉 Meaning: Market participants are defending downside near 5800.
🧠 Option Chain Conclusion
📍 Market is currently RANGE-BOUND
Support: 5800
Resistance: 5850
Big move only if one side breaks with volume
📊 Trading Scenarios (Practical)
🔹 If price holds above 5800
Bias: Sideways to mildly bullish
Safe trades:
Buy 5800 PE only near breakdown levels
Or wait for 5850 breakout confirmation
🔹 If price breaks 5800 convincingly
Expect fast move toward 5750
Trade idea:
Buy 5800 PE
SL: Above 5835
Target: 5760–5750
🔹 If price breaks 5850
Short covering possible
Buy 5850 CE
Targets open toward 5900
TORRENT POWER:Likely Tri-Angle Breakout -Huge Target is on cardsTORRENT POWER
-Formed a Triangle Pattern in weekly chart
-Trading at 1429 and above Tri-Angle Pattern Trend line
-trading above all its critical Moving averages Viz 10/20/50/100 in Daily Charts
-Stochastic RSI -Positive divergence at cross over 40 suggests trend reversal and possible upside
-Combination of the Tri-angle pattern break out,Stochastic RSI Positive divergence and cross over,increase in volume suggests a possible move towards TGT :1500 TGT 2:1600+(For educational purpose only)

NSE Indices comparisonAll NSE sectoral Indices performance comparison. A comparison to see the recent market trends and analyze which sectors have performed better recently as compared to the others and the broader market.

Market Structure Expansion After Corrective PullbackIntro / Overview
This chart highlights a clean price-action based structure where the market moves through impulsive advances followed by corrective pullbacks.
The focus is strictly on natural swing behavior and structure continuation, not on Elliott Wave theory.
⸻⸻⸻⸻⸻⸻⸻⸻⸻⸻⸻⸻⸻⸻
Concept
Markets generally move in phases:
• Expansion (Impulse)
• Retracement (Correction)
• Continuation
By tracking swing highs and swing lows, we can identify where price is pausing, correcting, and preparing for the next directional move.
⸻⸻⸻⸻⸻⸻⸻⸻⸻⸻⸻⸻⸻⸻
Chart Explanation (Step-by-Step)
1. Initial Expansion
• Price forms a strong directional move with higher highs and higher lows.
• This establishes bullish structure and directional bias.
2. Corrective Pullback
• Price retraces in a controlled manner.
• No structural breakdown occurs, indicating a healthy correction.
3. Stronger Expansion
• Momentum accelerates and price pushes higher.
• This move confirms acceptance above the previous structure high.
4. Secondary Pullback
• Another corrective phase follows the expansion.
• Price forms a higher low, preserving bullish structure.
5. Projected Continuation
• Based on prior expansion behavior, price is projected to continue higher.
• This projection is structure-based, not a prediction.
⸻⸻⸻⸻⸻⸻⸻⸻⸻⸻⸻⸻⸻⸻
Observation
• Each pullback remains structurally valid
• Expansion moves show increasing momentum
• Corrections are shallow and controlled
• No major breakdown in swing structure is observed
This behavior often reflects trend continuation conditions.
⸻⸻⸻⸻⸻⸻⸻⸻⸻⸻⸻⸻⸻⸻
Why It Matters?
Understanding structure helps traders:
• Avoid emotional entries during pullbacks
• Align with market acceptance and direction
• Focus on continuation zones instead of chasing price
Structure-based analysis keeps attention on price behavior, not assumptions.
⸻⸻⸻⸻⸻⸻⸻⸻⸻⸻⸻⸻⸻⸻
Conclusion
This chart demonstrates how simple swing structure can be used to map market behavior and potential continuation zones.
The projection is not a forecast, but a structural reference based on previous price action.
Always wait for confirmation and manage risk accordingly.
⸻⸻⸻⸻⸻⸻⸻⸻⸻⸻⸻⸻⸻⸻
⚠️ Disclaimer
📘 For educational purposes only
🙅 Not SEBI registered
❌ Not a buy/sell recommendation
🧠 Shared purely for learning and pattern understanding
📊 Not Financial Advice

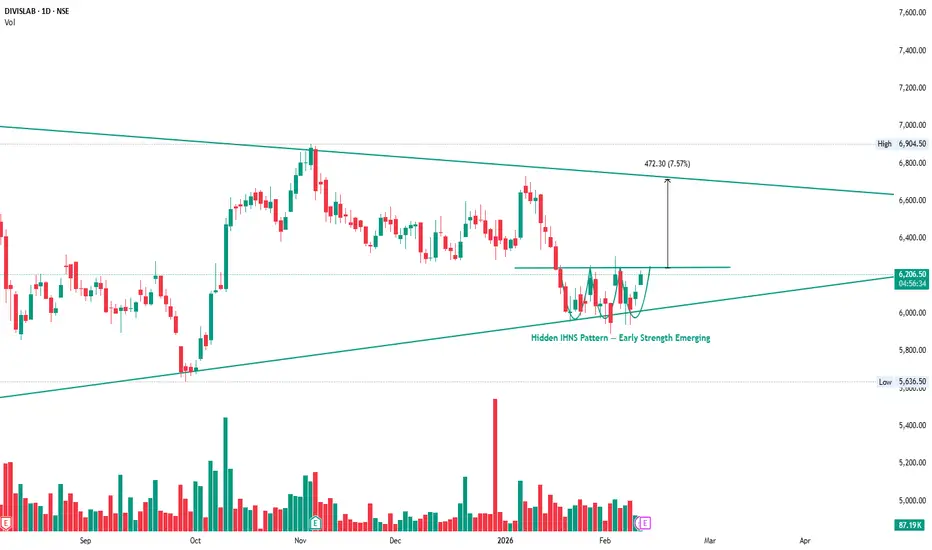
DIVISLAB : This Is Why Pattern Reading MattersThis is a hidden Inverse Head & Shoulders (IHNS) pattern forming near structure.
Price has already respected the neckline and higher lows are visible.
Such patterns usually appear before the crowd notices.
This is an early sign of strength, not a breakout chase.
Read the chart carefully — structure is speaking before price expands.
Caterpillar breaks above prior all time high1 After the prior all time high on Dec 12 25, price did not form a top but stabilized
2 A small double bottom showed limited selling pressure
3 Price recovered and held above the former high
4 The following phase was a bullish consolidation with shallow pullbacks
5 That consolidation resolved higher and price also moved beyond the trend channel
6 Silent Flow does not predict outcomes, it confirms that trend risk stayed contained
7 After new highs, continuation is possible, but another pause would also be normal

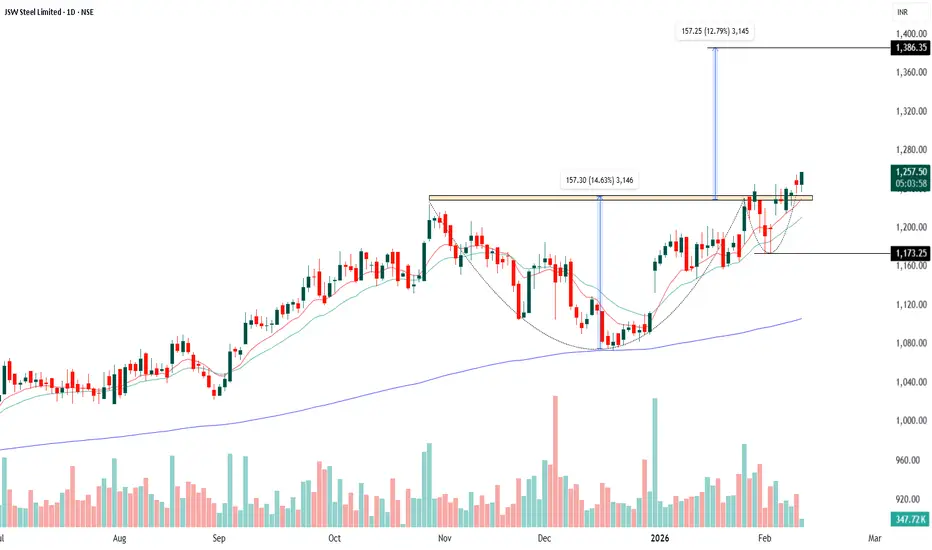
JSW STEEL - Cup and Handle - Daily The price formed a rounded bottom from November to early January, which is the cup. This shows gradual accumulation and exhaustion of selling pressure rather than panic selling.
After reaching the previous resistance zone near 1,240–1,250, the stock moved into a short, shallow pullback, forming the handle. The handle is tight and does not break the prior swing low, which is a healthy sign.
The handle is happening above key moving averages and near the breakout level, which strengthens the pattern quality.
Volumes during the cup were moderate and expanded near the right side of the cup. During the handle, volumes have cooled slightly, which is typical and constructive for a breakout.
A decisive close above 1,255–1,260 with good volume would confirm the cup and handle breakout.
Once confirmed, the pattern projection points towards 1,380–1,400, which also aligns with the measured move marked on the chart.
Entry can be planned on a close above 1,260 or on a minor dip near 1,220–1,230 if the handle support holds. A practical stop loss would be below 1,170, which is below the handle low.
Educational disclaimer: This explanation is for learning purposes only and not a buy or sell recommendation. Chart patterns can fail, and markets carry risk. Always combine technical analysis with risk management and personal due diligence before trading.
XAUUSD 4H Technical analysis
Structure: Price is moving inside a symmetrical triangle (lower highs + higher lows) → compression phase.
Current Price: ~5032
Immediate Resistance: 5090–5105 zone (previous supply)
Immediate Support: 4690–4655 zone (strong demand trendline)
Bias:
Above 5100 (4H close): Bullish breakout → 5300–5600 possible
Below 4690 (4H close): Bearish continuation → 4550 → 4400
Summary:
Market is coiling. Expect a strong directional move soon. Trade only after clear breakout + retest. 🎯
Patience = profit here.

GIFTNIFTY Short Range/Scalping Level Analysis for 10th FEB 2026GIFTNIFTY Intra-Swing Level Analysis for 10th FEB 2026
Short Range Levels Can use for Scalping
PCR Data as of Now:
Weekly Exp (today) Data:
Put OI: 54,05,736, Call OI: , 8,84,269: , PCR: 1.39
Trend Strength: BULLISH
Intraday PCR change data:
Put OI Chg: 22,02,896, Call OI Chg: 8,50,018, COI PCR: 2.59
Trend Strength: BULLISH
🚀Follow & Compare NIFTY spot Post for Taking Trade
━━━━━━━━━₹₹₹₹₹₹₹₹₹₹₹₹━━━━━━━━
💥Level Interpretation / description:
L#1: If the candle crossed & stays above the “Buy Gen”, it is treated / considered as Bullish bias.
L#2: Possibility / Probability of REVERSAL near RLB#1 & UBTgt
L#3: If the candle stays above “Sell Gen” but below “Buy Gen”, it is treated / considered as Sidewise. Aggressive Traders can take Long position near “Sell Gen” either retesting or crossed from Below & vice-versa i.e. can take Short position near “Buy Gen” either retesting or crossed downward from Above.
L#4: If the candle crossed & stays below the “Sell Gen”, it is treated / considered a Bearish bias.
L#5: Possibility / Probability of REVERSAL near RLS#1 & USTgt
HZB (Buy side) & HZS (Sell side) => Hurdle Zone,
*** Specialty of “HZB#1, HZB#2 HZS#1 & HZS#2” is Sidewise (behaviour in Nature)
Rest Plotted and Mentioned on Chart
Color code Used:
Green =. Positive bias.
Red =. Negative bias.
RED in Between Green means Trend Finder / Momentum Change
/ CYCLE Change and Vice Versa.
Notice One thing: HOW LEVELS are Working.
Use any Momentum Indicator / Oscillator or as you "USED to" to Take entry.
━━━━━━━━━━━━━━━━━━━━━━━━━━━━━━━━━━━━━━━━━━━
⚠️ DISCLAIMER:
The information, views, and ideas shared here are purely for educational and informational purposes only. They are not intended as investment advice or a recommendation to buy, sell, or hold any financial instruments. I am not a SEBI-registered financial adviser.
Trading and investing in the stock market involves risk, and you should do your own research and analysis. You are solely responsible for any decisions made based on this research.
"As HARD EARNED MONEY IS YOUR's, So DECISION SHOULD HAVE TO BE YOUR's".
━━━━━━━━━━━━━━━━━━━━━━━━━━━━━━━━━
❇️ Follow notification about periodical View
💥 Do Comment for Stock WEEKLY Level Analysis.🚀
📊 Do you agree with this view?
✈️ HIT THE PLANE ICON if this technical observation resonates with you. It will Motivate me.
━━━━━━━━━━━━━━━━━━━━━━━━━━━━━━━━━
💡 If You LOOKING any CHART & want for Level and ANALYZE?
Share your desired stock names in the comments below! I will try to analyze the chart Levels, patterns and share my technical view (so far my Knowledge).
If Viewers think It can identify meaningful setups. Looking forward to hearing from all of you — let's keep this discussion going and help each other make better trading decisions.

BSE: Short-Term Consolidation Breakout Confirmed!Technical Analysis:
BSE has been trading within a defined range for an extended period, and the chart now indicates a clear short-term breakout, suggesting a shift in momentum.
Key Highlights:
• Breakout Zone: The price has started sustaining above the 2,800–2,850 consolidation zone, highlighted in yellow, which is a strong bullish signal.
• Current Price: The stock is currently trading around ₹2,897.00.
• Trendline Break: A downward trendline from the past few weeks has also been breached, indicating improving momentum and renewed buying interest.
Levels to Watch:
• Immediate Resistance / Target: The 2,950–3,000 zone acts as the next major resistance, marked by the green horizontal line.
• Strong Support: The 2,800–2,850 range is now expected to act as a strong support on any pullback.
Important Note:
An ‘E’ (Earnings) icon is visible on the chart, indicating that results are approaching. This may lead to increased volatility, so maintaining a strict stop-loss is advised.
📌 Overall structure and price action remain positive, with focus on continuation above the breakout zone.

XAUUSD/GOLD 1H BUY PROJECTION 10.02.26First, look at the market structure.
We can clearly see a Head and Shoulders pattern forming on the one-hour timeframe.
This is the left shoulder,
this is the head,
and now price is forming the right shoulder.
At the same time, the market has printed an Evening Star candlestick pattern near the top, which is a strong bearish reversal signal.
After that, price moved up and swept liquidity above the highs.
This move is important because it trapped late buyers.
Once liquidity was taken, price started rejecting from the resistance zone.
Now look at this area — this is Resistance R1,
this zone is our sell entry area.
Above this, we have Resistance R2, which will act as our stop loss zone.
As long as price stays below the resistance,
the bias remains bearish.
If price breaks the neckline zone,
we can expect a strong impulsive move to the downside.
Our first target will be near Support S2,
and the extended target is at the lower support zone, which is marked as TP2.

Nifty - Expiry day analysis Feb 10Today, the price moved in a line formation, which can result in a gap-up or gap-down opening tomorrow. Price is bullish as long as it sustains above 25800.
Strong resistance is at the 26300 zone.
Strong support is at the 25500 zone.
Buy above 25860 with the stop loss of 25800 for the targets 25920, 25960, 26000, 26040, 26100 and 26160.
Sell below 25680 with the stop loss of 25740 for the targets 25640, 25600, 25540, 25500 and 25460.
Expected expiry day range is 25600 to 26100.
Always do your analysis before taking any trade.

Nifty50 analysis(8/2/2026).expiryPR: narrow + ascending cpr: trending
FII: 2,254.64 bought
DII: 4,15 bought
Highest OI:
CALL OI: 25800 and 25900
PUT OI: 26000
Resistance: - 26000
Support : - 25850
conclusion:.
My pov
1.market is bullish trend unless it breaks 25850 which has a huge support.
2. Only resistance is 26000 if it close and cross above then target will be all time high.
3. If today expiry and trending day so high volatality possible
What IF:
1. If it breaks 26000 then all time high is the target. Only if it close in day candle.
Psycology:
Keep consistance as the only hope.
note:
8moving average ling is blue colour.
20moving average line is green colour
50moving average line is red colour.
200moving average line is black colour.
cpr is for trend analysis.
MA line is for support and resistance.
Disclaimer:
Iam not Sebi registered so i started this as a hobby, please do your own analysis, any profit/loss you gained is not my concern. I can be wrong please do not take it seriously thank you.

Understanding Force Motors’ Uptrend and Breakout OpportunityForce Motors Limited’s stock trading around ₹22,500 on its weekly chart is showing signs of a potential all-time high breakout. Let’s break down the technical concepts involved and what they mean for traders and investors.
📈 What is an Uptrend?
An uptrend occurs when the price consistently forms higher highs and higher lows.
It reflects sustained buying interest and investor confidence.
In simple terms, each rally pushes the stock to a new peak, and each pullback stops at a higher level than before.
🔑 Importance of Higher High Breakout
A higher high breakout signals trend continuation rather than reversal.
Breaking past an all-time high often attracts:
Momentum traders looking to ride the rally.
Long-term investors who see strength in fundamentals and technicals.
It can act as a psychological trigger, as new highs often bring fresh demand.
📊 RSI Above 50 – Why It Matters
The Relative Strength Index (RSI) measures momentum.
Levels above 50 generally indicate bullish strength.
In this case:
RSI > 50 suggests buyers are in control.
It confirms that the breakout attempt is supported by momentum, not just price action.
💡 Current Opportunity in Force Motors
The stock attempting an all-time high breakout means:
Traders may see this as a trend continuation opportunity.
Investors could interpret it as a sign of long-term strength.
However, breakouts require confirmation (sustained trading above the breakout level with volume).
⚖️ Risk Management – The Essential Balance
Even in strong uptrends, risk management is crucial:
Stop-loss placement: Below recent support or breakout level to limit downside.
Position sizing: Avoid overexposure; allocate capital wisely.
Avoid chasing: Enter only on confirmation, not on emotional impulse.
Diversification: Don’t rely solely on one stock, even if it looks strong.
✨ Key Takeaway
Force Motors’ chart shows a classic setup of an uptrend with RSI strength and a potential higher high breakout. While this presents an opportunity, disciplined risk management ensures that traders and investors can participate in the rally without being vulnerable to sudden reversals.

Market Outlook & Trade Setup – Tuesday, 10th Feb 2026🔹 NIFTY: Gift Nifty (25,986)
* Previous Close: 25,867
* Expected Range: 25,500 - 26,000
🔹 SENSEX
* Previous Close: 84,065
* Expected Range: 83,500 - 84,500
🌍 Global & Market Sentiment
* DJIA: +20 | S&P: +32
💰 Institutional Activity (Cash Market)
* FII: Net Buyers: + ₹ 2255 Cr
* DII: Net Buyers: + ₹ 4 Cr
🔥 Events this Week:
India - US Crude & CPI data, UK GDP
📌 Sectoral Focus (Positive)
PSU Bank, Media, Realty, Consumer Durable
👉 Commodities in Focus: Gold, Silver, Natural Gas
✌️Important Quarterly Results: APOLLOHOSP, BALRAMCHIN, BRITANNIA, GRASIM
📈 Trade smart. Manage risk. Stay disciplined.

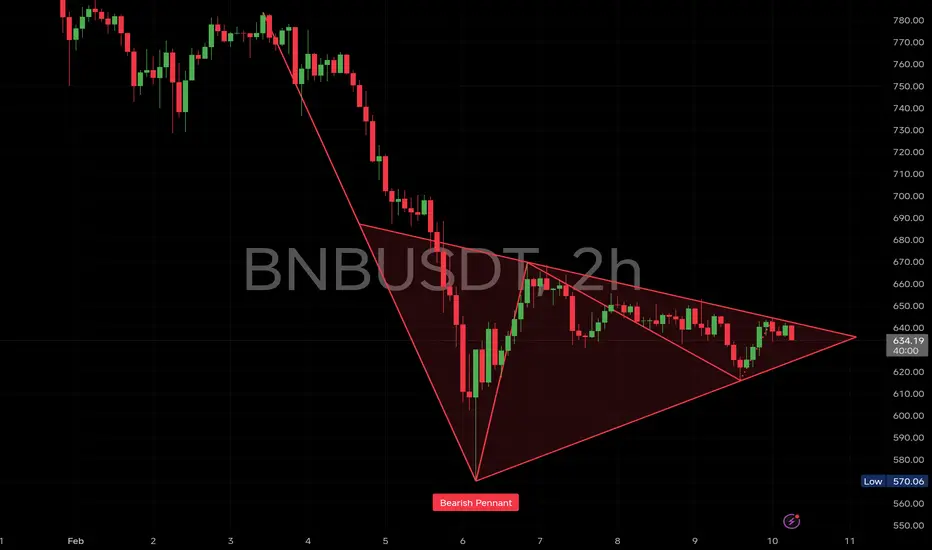
$BNB is compressing inside a clean bearish pennantCRYPTOCAP:BNB is compressing inside a clean bearish pennant after a sharp impulsive drop.
This structure usually acts as a continuation pattern, not a reversal — meaning direction matters, and right now momentum is still tilted to the downside.
Price is currently hovering around ~638, right at the apex of the pattern, where decisions happen fast.
🔴 Bearish Breakdown Scenario (Primary Bias)
If #BNB breaks and closes below the lower pennant support (~630–625) with volume:
Downside targets
610 – 600 → first liquidity sweep
585 – 570 → previous swing low (high probability)
540 – 520 → full measured move of the pennant
This aligns perfectly with the prior impulsive leg that formed the pennant.
🟢 Bullish Invalidity Scenario
Bearish structure fails only if price:
Reclaims 660–670 decisively
Breaks above the upper pennant trendline
Upside levels (relief bounce only)
670 – 690
710 – 730
Unless this reclaim happens, upside moves remain corrective, not trend-changing.
Key Takeaways
Pattern: Bearish Pennant
Market state: Compression → Expansion coming
Below 630 = acceleration
Above 670 = structure invalidation