Banknifty Intraday Analysis for 29th January 2026NSE:BANKNIFTY
Index has resistance near 60000 – 60100 range and if index crosses and sustains above this level then may reach near 60500 – 60600 range.
Banknifty has immediate support near 59200 - 59100 range and if this support is broken then index may tank near 58700 - 58600 range.
Markets are expected to react at the opening to the outcome of tonight's US Fed FOMC decision. A rate cut typically weakens the Dollar, providing a bullish signal for equities and metals. Meanwhile, with the Economic Survey set to be tabled on January 29, 2026, investors will also be closely monitoring the survey data for further direction.
Community ideas

Decisive Levels Ahead in DELHIVERY :Breakout or Breakdown?DELHIVERY has rallied strongly from the recent low of 376 and is now approaching a decisive resistance zone at 428 – 431.50.
🔹 Bullish Setup:
A sustained move and hold above 431.50 will confirm strength.
Upside Target: 444
🔹 Bearish Setup:
Rejection from 428 – 431.50 followed by trading below this zone with volume will indicate weakness.
Downside Target: 408
⚠️ Important Level:
423 is a key psychological and intraday support level and should be closely monitored for price reaction.
👉 Price behaviour near 428 – 431.50 will decide the next directional move. Trade with volume confirmation.

NIFTY Weekly Positional leve Analysis for 01st - 06th Feb 2026NIFTY Weekly Positional leve Analysis for 01st - 06th Feb 2026
On BUDGET Day: Special Trading
Market may little bit Choppy, Take Caesious Approach.
🚀Follow GIFTNIFTY Post for NF levels
👇🏼Screenshot of GIFTNIFTY All-day(29rd Jan 2026) in 5 min TF..
━━━━━━━━━₹₹₹₹₹₹₹₹₹₹₹₹━━━━━━━━
💥Level Interpretation / description:
L#1: If the candle crossed & stays above the “Buy Gen”, it is treated / considered as Bullish bias.
L#2: Possibility / Probability of REVERSAL near RLB#1 & UBTgt
L#3: If the candle stays above “Sell Gen” but below “Buy Gen”, it is treated / considered as Sidewise. Aggressive Traders can take Long position near “Sell Gen” either retesting or crossed from Below & vice-versa i.e. can take Short position near “Buy Gen” either retesting or crossed downward from Above.
L#4: If the candle crossed & stays below the “Sell Gen”, it is treated / considered a Bearish bias.
L#5: Possibility / Probability of REVERSAL near RLS#1 & USTgt
HZB (Buy side) & HZS (Sell side) => Hurdle Zone,
*** Specialty of “HZB#1, HZB#2 HZS#1 & HZS#2” is Sidewise (behaviour in Nature)
Rest Plotted and Mentioned on Chart
Color code Used:
Green =. Positive bias.
Red =. Negative bias.
RED in Between Green means Trend Finder / Momentum Change
/ CYCLE Change and Vice Versa.
Notice One thing: HOW LEVELS are Working.
Use any Momentum Indicator / Oscillator or as you "USED to" to Take entry.
━━━━━━━━━━━━━━━━━━━━━━━━━━━━━━━━━━━━━━━━━━━
⚠️ DISCLAIMER:
The information, views, and ideas shared here are purely for educational and informational purposes only. They are not intended as investment advice or a recommendation to buy, sell, or hold any financial instruments. I am not a SEBI-registered financial adviser.
Trading and investing in the stock market involves risk, and you should do your own research and analysis. You are solely responsible for any decisions made based on this research.
"As HARD EARNED MONEY IS YOUR's, So DECISION SHOULD HAVE TO BE YOUR's".
━━━━━━━━━━━━━━━━━━━━━━━━━━━━━━━━━
❇️ Follow notification about periodical View
💥 Do Comment for Stock WEEKLY Level Analysis.🚀
📊 Do you agree with this view?
✈️ HIT THE PLANE ICON if this technical observation resonates with you. It will Motivate me.
━━━━━━━━━━━━━━━━━━━━━━━━━━━━━━━━━
💡 If You LOOKING any CHART & want for Level and ANALYZE?
Share your desired stock names in the comments below! I will try to analyze the chart Levels, patterns and share my technical view (so far my Knowledge).
If Viewers think It can identify meaningful setups. Looking forward to hearing from all of you — let's keep this discussion going and help each other make better trading decisions.

BTC getting ready for upsideBitcoin is most likely completing wave D of an expanding triangle and ready to enter wave E, which will be corrective in itself.
The move will be invalidated below ~80,500 which was the last important low formed on 21Nov'25.
Will keep you guys updated!

CCL Products cmp 970.50 by Daily Chart viewCCL Products cmp 970.50 by Daily Chart view
- Support Zone 890 to 930 Price Band
- Resistance Zone 970 to 1015 Price Band
- Volumes in close sync with avg traded qty
- Rising Price Channel seem been well sustained
- Descending Triangle pattern breakout anticipated
- Technical Indicator trending positively thru Jan 2026

NIFTY IntraSwing Spot level Analysis for 01st Feb 2026: NIFTY Analysis for 01st Feb 2026: IntraSwing Spot levels
On BUDGET Day: Special Trading
Market may little bit Chopp y, Take Caesious Approach.
👇🏼Screenshot of NIFTY Spot Positional / Weekly Level Analysis from 01st - 06th Feb 2026) in 5 min TF.
🚀Follow GIFTNIFTY Post for NF levels
━━━━━━━━━₹₹₹₹₹₹₹₹₹₹₹₹━━━━━━━━
💥Level Interpretation / description:
L#1: If the candle crossed & stays above the “Buy Gen”, it is treated / considered as Bullish bias.
L#2: Possibility / Probability of REVERSAL near RLB#1 & UBTgt
L#3: If the candle stays above “Sell Gen” but below “Buy Gen”, it is treated / considered as Sidewise. Aggressive Traders can take Long position near “Sell Gen” either retesting or crossed from Below & vice-versa i.e. can take Short position near “Buy Gen” either retesting or crossed downward from Above.
L#4: If the candle crossed & stays below the “Sell Gen”, it is treated / considered a Bearish bias.
L#5: Possibility / Probability of REVERSAL near RLS#1 & USTgt
HZB (Buy side) & HZS (Sell side) => Hurdle Zone,
*** Specialty of “HZB#1, HZB#2 HZS#1 & HZS#2” is Sidewise (behaviour in Nature)
Rest Plotted and Mentioned on Chart
Color code Used:
Green =. Positive bias.
Red =. Negative bias.
RED in Between Green means Trend Finder / Momentum Change
/ CYCLE Change and Vice Versa.
Notice One thing: HOW LEVELS are Working.
Use any Momentum Indicator / Oscillator or as you "USED to" to Take entry.
━━━━━━━━━━━━━━━━━━━━━━━━━━━━━━━━━━━━━━━━━━━
⚠️ DISCLAIMER:
The information, views, and ideas shared here are purely for educational and informational purposes only. They are not intended as investment advice or a recommendation to buy, sell, or hold any financial instruments. I am not a SEBI-registered financial adviser.
Trading and investing in the stock market involves risk, and you should do your own research and analysis. You are solely responsible for any decisions made based on this research.
"As HARD EARNED MONEY IS YOUR's, So DECISION SHOULD HAVE TO BE YOUR's".
━━━━━━━━━━━━━━━━━━━━━━━━━━━━━━━━━
❇️ Follow notification about periodical View
💥 Do Comment for Stock WEEKLY Level Analysis.🚀
📊 Do you agree with this view?
✈️ HIT THE PLANE ICON if this technical observation resonates with you. It will Motivate me.
━━━━━━━━━━━━━━━━━━━━━━━━━━━━━━━━━
💡 If You LOOKING any CHART & want for Level and ANALYZE?
Share your desired stock names in the comments below! I will try to analyze the chart Levels, patterns and share my technical view (so far my Knowledge).
If Viewers think It can identify meaningful setups. Looking forward to hearing from all of you — let's keep this discussion going and help each other make better trading decisions.

Hindustan Copper Limited - Breakout Setup, Move is ON...#HINDCOPPER trading above Resistance of 602
Next Resistance is at 896
Support is at 458
Here are previous charts:
Chart is self explanatory. Levels of breakout, possible up-moves (where stock may find resistances) and support (close below which, setup will be invalidated) are clearly defined.
Disclaimer: This is for demonstration and educational purpose only. This is not buying or selling recommendations. I am not SEBI registered. Please consult your financial advisor before taking any trade.

Astro Timing🧭 TRADER’S ASTRO-COMPASS: Saturday, Jan 31, 2026 Timezone: New York (EST)
📉 MARKET PROBABILITY: The market has a split personality today. The pre-market session offers high probability setups (an echo of yesterday's Jupiter), but the main session turns into a volatility trap. Rule of the day: "Hit and Run." If you catch a move early, lock it in. Staying until the afternoon increases the probability of a total drawdown.
🟢 PROFIT WINDOW: Until 05:50 AM (EST)
Factors: Moon in Cancer (Intuition) Sextile Uranus (Volatility spike) + Trine Saturn (Structure).
The Setup: We are riding the tailwinds of yesterday’s "Royal Conjunction" with Jupiter. Uranus brings unexpected volume spikes.
Strategy: High liquidity for crypto/forex scalping. Saturn acts as your automatic "Take Profit" button here—don't get greedy, lock the gains immediately.
⚪️ DEAD VOLUME (Void): 05:52 AM – 08:09 AM (EST)
Status: Moon Void of Course.
Risk: Zero edge. Orders may hang, liquidity dries up. Do not initiate new positions.
🔴 MARGIN CALL ZONE: After 11:00 AM (EST)
Factor: Moon enters Leo and applies to Opposition with Pluto (Peak impact at 02:21 PM).
Psychology (Leo): Triggers "God Mode" and FOMO. You might feel the urge to go "all in" to impress or recover losses.
Reality (Pluto): Pluto is the planet of force majeure and bankruptcy. In financial astrology, the Moon-Pluto opposition is the classic signature of a "account wipeout" or a sudden market crash against the retail trader.
Strategy: Close the terminal. You are not trading against the trend here; you are trading against a steamroller.

SHARDACROP: Strong Q3, Descending Trainlge BO, Chart of the WeekFrom Descending Triangle Breakout to Q3FY26 Glory: Why Sharda Cropchem's Could Be Your Next Big Move Lets Understand in "Chart of the Week"
As per the Latest SEBI Mandate, this isn't a Trading/Investment RECOMMENDATION nor for Educational Purposes; it is just for Informational purposes only. The chart data used is 3 Months old, as Showing Live Chart Data is not allowed according to the New SEBI Mandate.
Disclaimer: "I am not a SEBI REGISTERED RESEARCH ANALYST AND INVESTMENT ADVISER."
This analysis is intended solely for informational purposes and should not be interpreted as financial advice. It is advisable to consult a qualified financial advisor or conduct thorough research before making investment decisions.
Price Action Analysis:
Long-Term Trend Overview:
- The stock has demonstrated a multi-year uptrend from 2021 levels around 300-350 to current levels near 1,035
- A significant rally occurred from mid-2021 to early 2025, where the stock surged from approximately 350 to an all-time high of 1,181
- Post the January 2025 peak, the stock has entered a consolidation phase with a descending triangle pattern formation
- Current price of 1,035.85 (as of January 31, 2026) represents a 28.46% gain, showing strong momentum recovery
Recent Price Action Characteristics:
- The stock made an all-time high of 1,181 in early January 2025
- Following the peak, a corrective phase ensued with the formation of lower highs
- A clear descending trendline can be observed connecting the highs from January 2025 peak through subsequent rallies
- The stock found support multiple times around the 750-800 zone, establishing this as a critical demand area
- On January 31, 2026, the stock broke above the descending trendline with a strong bullish candle supported by robust volumes (11.25M shares traded)
Key Technical Patterns:
- Descending Triangle Pattern: The chart clearly shows a descending triangle structure with lower highs and a flat support base around 750-800
- Trendline Break: The recent price action has broken through the descending resistance trendline, which is a classic bullish reversal signal
- The breakout was accompanied by good volumes of 2.03M (shown in green), indicating strong buying interest
- The price action suggests a potential trend reversal from the consolidation phase to a new uptrend
Volume Spread Analysis:
Volume Trends and Characteristics:
- The volume chart shows sporadic high-volume days during the entire period
- The recent breakout candle is accompanied by elevated volumes of 11.25M shares
- Volume of 11M is above average, confirming the validity of the breakout
- Historical volume spikes are observed during significant price movements, both up and down
Volume-Price Correlation:
- During the 2021-2022 rally, several high-volume green bars supported the upward price movement
- The consolidation phase from January 2025 to January 2026 saw relatively lower volumes, typical of a basing pattern
- The recent breakout is validated by the volume surge, a positive technical sign
- Absence of high red volume (selling pressure) during the breakout indicates limited supply
Volume Implications:
- The volume profile suggests strong institutional participation during key price movements
- The current breakout with good volume indicates conviction among buyers
- Sustained volumes above the 2-3M range would confirm continued buying interest
- Any pullback on lower volumes would be healthier and offer better entry opportunities
Support and Resistance Analysis:
Major Support Levels:
- Primary Support Zone: 750-800 (tested multiple times during the consolidation phase, proving to be a strong demand zone)
- Secondary Support: 700 (psychological level and previous consolidation area)
- Critical Support: 600-650 (major swing low from mid-2024, breaking this would invalidate the bullish structure)
- Long-term Support: 500 (aligns with historical resistance turned support from early 2024)
Major Resistance Levels:
- Immediate Resistance: 1,100 (previous consolidation high and psychological barrier)
- All-Time High Resistance: 1,181 (needs to be reclaimed for continuation of uptrend)
- Potential Resistance: 1,200-1,250 (psychological round numbers)
- The broken descending trendline around 900-950 zone may now act as support on any pullbacks
Base Formation Analysis:
- The stock has formed a strong multi-week base between 750 and 800
- This base structure resembles a consolidation platform after a strong uptrend
- The base formation duration provides strong foundation for the next leg up
- The base is indicating accumulation rather than distribution
Technical Pattern Analysis:
Descending Triangle Breakdown and Resolution:
- Pattern Formation: The descending triangle started forming from the January 2025 high at 1,181
- Pattern Characteristics: Lower highs (descending resistance) meeting horizontal support at 750-800
- Pattern Resolution: The recent upward breakout from the descending trendline on January 31, 2026
- Breakout Confirmation: Strong bullish candle with +28.46% gain and volume of 11.25M shares
Short-Term Trend Assessment:
- The recent breakout candle establishes a strong bullish bias in the short term
- The stock has moved from a downtrend (within the triangle) to potentially starting a new uptrend
- Higher high formation above 1,035 would confirm the trend reversal
- The immediate trend is bullish with the breakout above both the trendline and the 900-950 resistance cluster
Medium-Term Outlook:
- The stock needs to sustain above 950-1,000 levels to confirm medium-term bullish structure
- A move above the previous high of 1,181 would resume the primary uptrend
Long-Term Perspective:
- The overall structure from 2021 remains bullish with higher lows and higher highs
- The current consolidation is a healthy correction within a larger uptrend
- Long-term investors can view the 750-800 zone as a strong accumulation area
- The secular trend in the agrochemical sector supports the long-term bullish thesis
Fundamental and Business Overview:
Company Profile and Business Model:
- Sharda Cropchem Ltd is engaged in the marketing and distribution of agrochemicals globally
- The company operates an asset-light business model, focusing on identifying generic molecules, preparing dossiers, seeking registrations, and marketing through distributors
- Core product portfolio includes formulations and generic active ingredients across fungicide, herbicide, and insecticide segments
- The company also operates a non-agrochemicals business including conveyor belts, V-belts, dyes, and industrial chemicals
Geographic Revenue Distribution:
- Europe: Contributes approximately 53% of agrochemical revenue, making it the largest market
- NAFTA (North America): Accounts for around 34% of agrochemical business
- Latin America (LatAm): Represents about 9-10% with high growth potential
- Rest of World: Includes India and other emerging markets
- The company has a presence across 80+ countries with over 150 distributors in India alone
Registration Portfolio and Competitive Moat:
- The company has 2,821 active product registrations globally as of March 2023
- Strong pipeline of 1,143 registrations under process, mainly in EU, US, and LatAm
- The registration process serves as a significant entry barrier due to high costs, complexity, and time requirements
- The company invests approximately 350-400 crores per annum toward new product registrations
- Registrations in highly regulated markets (EU, US) provide sustainable competitive advantages
Recent Financial Performance:
Q3 FY26 Results Highlights (Quarter Ended December 2025)
- Net Sales: Rs 1,288.76 crores, representing 38.7% YoY growth
- Net Profit: Rs 145.12 crores, a stellar 365.87% YoY surge from Rs 31.15 crores in Q3 FY25
- PAT Margin: Expanded dramatically to 11.26% from 3.35% in Q3 FY25, a gain of 791 basis points
- Gross Profit Margin: Stood at 20.32%, significantly improved from 12.36% in Q3 FY25
- The margin expansion reflects improved product mix, better pricing realization, and effective cost management
Nine-Month FY26 Performance (April-December 2025):
- Consolidated Net Sales: Rs 3,202.68 crores, up 27.57% YoY
- Net Profit: Rs 362.21 crores, representing 257.33% YoY growth
- ROCE: Impressive 20.85% for the nine-month period, the highest recorded in recent periods
- The company declared an interim dividend of Rs 6 per share
- Strong cash generation and zero-debt balance sheet underscore financial strength
Financial Trend and Quality Metrics:
- Five-year Sales CAGR: 17.65%, demonstrating consistent top-line growth
- Five-year EBIT CAGR: 21.17%, showing strong operational leverage
- Debt Status: Company is almost debt-free, providing financial flexibility
- EBIT to Interest Coverage: Average of 100 times, indicating negligible debt burden
- Return on Equity: Currently at 9.89% over last 3 years (considered low, but improving)
Sectoral and Industry Backdrop:
Indian Agrochemical Market Overview
- Market Size: The Indian agrochemical market is valued at approximately USD 8-9 billion in 2025
- Growth Trajectory: Expected to grow at a CAGR of 5.5-7.5% during 2026-2032 period
- Market Drivers: Rising population, increasing food demand, agricultural intensification, and government support
- India is ranked as one of the top 10 consumers and producers of agrochemicals globally
Market Dynamics and Growth Drivers:
- Food Security Imperative: India's population projected to reach 1.5 billion by 2030, necessitating enhanced agricultural productivity
- Crop Loss Prevention: Annual crop losses due to pests, weeds, and diseases estimated at 15-25%, valued at USD 10-15 billion
- Land Constraints: Declining arable land per capita due to urbanization drives need for yield optimization
- Technology Adoption: Increasing adoption of precision farming, drone spraying, and fertigation systems
- Export Opportunity: India's status as a net exporter strengthened by global demand for generic agrochemicals
Government Initiatives and Policy Support
- Make in India: Government recognizes agrochemical industry as one of top 12 industries for global leadership
- Subsidy Programs: Continued support through fertilizer subsidies (INR 3.68 lakh crore committed till March 2025)
- PM-PRANAM Scheme: Launched in 2023 to incentivize balanced fertilizer use and alternative technologies
- Drone Subsidies: Up to 40% subsidy on drone purchases for precision spraying
- Digital Infrastructure: Integration of land records, soil health cards, and farmer databases to facilitate input access
Segment-wise Market Trends
- Fertilizers: Hold 55% market share, driven by high applicability across all cropping systems
- Pesticides: Growing at faster CAGR of 10.52% through 2030, with focus on herbicides and fungicides
- Insecticides: Dominate with 72.5% of pesticide market due to tropical climate and pest pressure
- Biopesticides: Emerging segment accounting for 15% of market, driven by sustainability focus
- Regional Dynamics: South India projected to show highest growth due to horticulture and high-value crop expansion
Industry Challenges and Headwinds:
- Chinese Dependence: High reliance on Chinese suppliers for raw materials and active ingredients
- Import Dependency: Trade deficit of around USD 31 billion in chemicals sector due to infrastructure bottlenecks
- Pricing Pressure: Competition from low-priced Chinese products putting pressure on realizations
- Regulatory Complexity: Increasing cost of registrations and re-registrations in developed markets
- Working Capital Intensity: Large inventory and receivables requirements due to wide product portfolio and geography
Competitive Positioning and Business Strengths:
Sharda's Competitive Advantages:
- Asset-Light Model: Focus on registration, marketing, and distribution rather than manufacturing
- Registration Moat: 2,821 active registrations create significant barriers to entry
- Global Footprint: Presence in 80+ countries with diversified revenue streams
- Developed Market Focus: 83-85% revenue from Europe and NAFTA, which are high-value, stable markets
- Debt-Free Balance Sheet: Provides financial flexibility for growth investments
Business Model Strengths:
- Third-Party Manufacturing: Partnerships with manufacturers allow capital-efficient scaling
- Diversified Portfolio: Over 200 products across multiple crop protection categories
- Strong Pipeline: 1,143 registrations in process ensure future revenue visibility
- Direct Sales Force: Building own sales teams in key markets (Europe, US, Canada, Mexico) in addition to distributors
- Non-Agro Diversification: 17% revenue from non-agrochemical business reduces concentration risk
Strategic Positioning in Generic Agrochemicals:
- Generic Focus: Targets off-patent molecules where 75% market share is still held by innovators
- Value Proposition: Offers cost-competitive alternatives to multinational brands
- Regulatory Expertise: Proven capability in navigating complex registration processes in developed markets
- Customer Relationships: Supplies to MNCs as well as end customers, providing multiple revenue channels
- Quality Compliance: Meets stringent regulatory standards of EU and US markets
Valuation Metrics:
- P/E Ratio: Trading at 20x trailing earnings, below industry average of 29x
- EV/EBITDA: 10.61x appears reasonable given the 365.87% profit growth trajectory
- PEG Ratio: 0.18 suggests the stock is significantly undervalued relative to its growth
- Dividend Yield: 0.91% with conservative payout ratio of 84.89% for FY25
Key Strengths:
- Strong quarterly momentum with 365.87% YoY profit growth in Q3 FY26
- Expanding margins (PAT margin up 791 bps YoY) indicating operational improvement
- Record ROCE of 20.85% demonstrating efficient capital deployment
- Zero-debt balance sheet providing safety and growth flexibility
- Technical breakout from year-long consolidation backed by strong volumes
Risk Factors and Concerns:
- Dependence on Chinese Suppliers: Raw material sourcing concentrated in China exposes to currency and policy risks
- Competitive Pricing: Generic nature of business faces pricing pressure from both innovators and other generic players
- Working Capital Intensity: High debtors of 165 days and large inventory requirements
- Regulatory Risks: Stroke of pen risk where simplified registration processes could erode competitive moat
- MNC Competition: Large multinationals with better brand equity and distributor relationships
- Seasonality: 35-40% revenue and 50-55% profit concentrated in certain quarters
Management Guidance and Outlook:
- FY26 Guidance: Company targets 15%+ topline growth with EBITDA margins in 15-18% range
- Capex Plans: Rs 400-450 crore planned investment in registrations for FY26
- Registration Pipeline: Focus on strengthening portfolio across Europe, NAFTA, and LatAm
- Margin Trajectory: Gross margins expected to stabilize around 30-35% range with input cost normalization
- Geographic Expansion: Continued strengthening of sales force in key markets
Sectoral Tailwinds Supporting Growth:
- Indian agrochemical market growing at 5.5-7.5% CAGR through 2032
- Global demand for generic agrochemicals increasing as patents expire
- Government support through Make in India and agricultural modernization programs
- Increasing adoption of precision farming and technology-driven agriculture
- Export opportunities expanding as India becomes a preferred sourcing destination
Monitoring Parameters:
- Volume Consistency: Weekly volumes should sustain above 1.5-2M for continued momentum
- Support Holding: 750-800 zone must hold on any pullbacks
- Quarterly Results: Track margin trends and volume growth in subsequent quarters
- Sectoral Trends: Monitor agrochemical industry news, Chinese raw material prices, and global demand
- Competitive Action: Watch for pricing pressures or market share changes
My 2 Cents:
- Sharda Cropchem has broken out of a descending triangle pattern with strong volumes
- The 750-800 support zone has proven to be a robust demand area tested multiple times
- Volume-backed breakout on January 31, 2026 (+28.46%) confirms buying conviction
- The stock is transitioning from consolidation to a potential new uptrend
- The stock presents a compelling combination of technical breakout and fundamental improvement
- Strong quarterly numbers have acted as a catalyst for the technical pattern resolution
- Valuation at 20x P/E with PEG of 0.18 suggests room for re-rating
- The 750-800 base provides a strong foundation for the next leg of upward movement
Full Coverage on my Mid-Week Newsletter coming Wednesday.
Keep in the Watchlist and DOYR.
NO RECO. For Buy/Sell.
📌Thank you for exploring my idea! I hope you found it valuable.
🙏FOLLOW for more
👍BOOST if you found it useful.
✍️COMMENT below with your views.
Meanwhile, check out my other stock ideas on the right side until this trade is activated. I would love your feedback.
As per the Latest SEBI Mandate, this isn't a Trading/Investment RECOMMENDATION nor for Educational Purposes; it is just for Informational purposes only. The chart data used is 3 Months old, as Showing Live Chart Data is not allowed according to the New SEBI Mandate.
Disclaimer: "I am not a SEBI REGISTERED RESEARCH ANALYST AND INVESTMENT ADVISER."
This analysis is intended solely for informational purposes and should not be interpreted as financial advice. It is advisable to consult a qualified financial advisor or conduct thorough research before making investment decisions.

Part 2 Intraday Institutional TradingOption Trading: Terms and Conditions
- Strike Price: Price at which option can be exercised.
- Expiry Date: Last day option can be exercised.
- Premium: Price paid for option.
- Lot Size: Number of shares/contracts per lot.
- Margin: Required for selling options.
- Exercise: Buyer chooses to buy/sell underlying asset.
- Assignment: Seller obligated to buy/sell if option exercised.

Part 1 Intraday Institutional Trading Who Should Trade Options?
People who:
- Understand options and risks.
- Have experience trading stocks/derivatives.
- Want to hedge existing positions.
- Are comfortable with potential losses.
Not suitable for:
- Beginners without knowledge.
- Risk-averse investors.

BANKNIFTY 54000??So this is the weekly chart of BANKNIFTY which has been on a nice and smooth higher high and higher low. As you can see this is a weekly chart so it's been in this pattern for long while. After making an higher high at nearly 61000, will it make a higher low to 54000 or will it give a break out?

Part 5 Advance Trading Strategies Option Trading: Risks and BenefitsBenefits- Leverage: Control bigger positions with smaller capital.
- Limited Risk: Option buyers risk only the premium paid.
- Flexibility: Strategies for bullish, bearish, or neutral markets.
- Hedging: Protect portfolios with options.
Risks- Time Decay: Options lose value as expiry approaches.
- Volatility Risk: Options sensitive to changes in volatility.
- Loss of Premium: Buyers risk losing entire premium if wrong.
- Complexity: Strategies can be complex, require understanding.

Part 4 Technical Vs. Institutional Option TradingAdvanced Option Trading Strategies Explained1. Straddle/Strangle- Straddle: Buy call and put at same strike, profit from big price moves (volatility).
- Strangle: Buy call and put at different strikes, profit from big moves with lower cost.
2. Iron Condor- Sell OTM call and put spreads, profit from low volatility (price staying within range).
3. Butterfly Spread- Buy and sell options at multiple strikes, profit if price stays near middle strike.
4. Calendar Spread- Buy and sell options with same strike but different expiries, profit from time decay differences.
5. Ratio Spreads- Buy and sell options in different ratios, profit from volatility changes or direction.

Ramco Cements Ltd . Daily Chart Horizontal Channel1.There is consolidation in the horizontal channel between the 980 support and 1,098 resistance (white lines). A breakout above 1,098 would confirm the bullish reversal.
2. EMA status:
EMA 21 (purple) is above EMA 55 (green), showing short‑term bullish momentum.
EMA 55 is above EMA 100 (blue) and EMA 200 (orange), indicating the medium‑term trend is up.
Price is currently above all EMAs, providing multi‑timeframe support.
3. Volume: Volume has risen on the recent upmove, signaling growing buyer interest. A breakout should be accompanied by a spike above average volume for confirmation.
4. The View : Breakout looks possible but support of volume is needed a long with momentum - RSI is well above 60. This suggest fresh momentum

XAUUSD – D1 Mid-Term AnalysisXAUUSD – D1 Mid-Term Outlook: Volatility Reset Before the Next Structural Move | Lana ✨
Gold has just experienced a sharp and aggressive sell-off from the highs, marking a clear shift from expansion into a volatility reset phase. While the broader bullish trend has not been fully invalidated, price action now suggests the market is entering a medium-term rebalancing process, where liquidity and structure will play a decisive role.
At this stage, the focus moves away from short-term noise and toward key daily levels that will define the next swing direction.
📈 Higher-Timeframe Structure (D1)
The strong vertical rally has been followed by a deep corrective candle, indicating distribution and profit-taking at premium levels.
Price has broken below short-term momentum support but is still trading above major higher-timeframe trend structure.
This behavior is typical after an extended rally, where the market needs time to absorb supply and reset positioning before choosing the next medium-term direction.
The current structure favors range development or a corrective swing, rather than immediate continuation to new highs.
🔍 Key Daily Zones to Watch
Major Resistance Zone: ~5400 – 5450
This area represents strong overhead supply. Any recovery into this zone is likely to face selling pressure and should be treated as a reaction zone, not a breakout zone.
Strong Liquidity Level: ~5100
A key magnet for price. Acceptance above or rejection below this level will heavily influence medium-term bias.
Sell-Side Liquidity Zone: ~4680 – 4700
This is a critical downside target where stops and unfilled liquidity are resting.
High-Liquidity Buy Zone: ~4290
A major higher-timeframe demand area. If price reaches this zone, it would complete a deep correction within the broader bullish cycle and open the door for medium-term accumulation.
🎯 Medium-Term Trading Scenarios
Scenario 1 – Corrective Recovery, Then Sell Pressure (Primary):
Price may attempt a rebound toward 5100 or even the 5400–5450 resistance zone. As long as price remains below this resistance, rallies are more likely to be corrective, offering opportunities to reassess shorts or reduce long exposure.
Scenario 2 – Continuation of the Correction:
Failure to reclaim 5100 increases the probability of a continued move lower toward 4680–4700, where sell-side liquidity is resting.
Scenario 3 – Deep Reset and Structural Buy:
If downside momentum accelerates, a move toward the 4290 high-liquidity zone would represent a full medium-term reset. This area is where stronger buyers may re-enter and where the next swing-long narrative could begin to form.
🌍 Market Context (Medium-Term View)
Such sharp daily moves often occur during periods of macro repricing and sentiment shifts, forcing the market to rebalance expectations. In these environments, gold tends to oscillate between liquidity zones, rather than trend cleanly in one direction.
This makes patience and level-based execution more important than prediction.
🧠 Lana’s Perspective
The market is no longer in a “buy-every-dip” phase.
This is a transition environment, where gold needs to finish its liquidity work before the next sustained move develops.
Lana stays neutral-to-cautious in the medium term, focusing on reactions at daily liquidity zones, not emotional bias.
✨ Let the structure reset, let liquidity clear, and wait for the market to show its hand.

alrajhi bankThe price remains positive; the target for the current wave is 121 riyals... and God knows best.

XAUUSD (H4) – Liam Weekly ForecastXAUUSD (H4) – Liam Weekly Outlook
Uptrend under pressure, but not broken | Focus on retests and reactions
Quick summary
Gold has experienced a sharp corrective move after an extended bullish run. The recent sell-off has broken the steep short-term uptrend, but price has not confirmed a full trend reversal on H4.
At this stage, the market is transitioning into a rebalancing phase. For the coming week, the edge is not in predicting direction, but in trading reactions at key structure, Fibonacci, and FVG levels.
Market structure overview
The prior bullish trend has lost momentum after a vertical expansion.
Price has broken below the aggressive trendline, signaling trend exhaustion, not automatic reversal.
Current price action suggests a corrective structure with potential for range development or trend resumption after liquidity is rebalanced.
➡️ Bias remains neutral-to-bullish, conditional on how price reacts at key levels.
Key technical zones for the week
Primary buy-on-retest zone: trendline retest area around 4850 – 4900
This area has already shown reaction and acts as the first decision point for buyers.
Fibonacci 0.618 / key reaction zone: 5030 – 5050
A pivotal mid-range level. Acceptance above favors continuation; rejection keeps price corrective.
FVG + Fibonacci confluence: 5235 – 5260
This is a major imbalance zone. If price rallies into this area, expect strong reaction and two-sided trade.
Lower liquidity / value zone: 4540 area
This remains the deeper downside objective if higher levels fail to hold and the correction expands.
Weekly scenarios (Liam style: trade the level)
Scenario A – Trendline retest holds (bullish continuation)
If price continues to hold above the trendline retest zone and builds higher lows:
Look for bullish continuation toward 5030 → 5235
Break and acceptance above the FVG zone would reopen upside continuation potential.
Logic: This confirms the move as a healthy correction within a broader bullish structure.
Scenario B – Rejection from mid-range (extended correction)
If price fails to reclaim and hold above 5030 – 5050:
Expect choppy, corrective price action
Risk shifts toward a deeper pullback into 4540
Logic: Failure to hold the 0.618 zone keeps the market in rebalancing mode.
Scenario C – FVG test and rejection
If price rallies aggressively into 5235 – 5260:
This zone favors reaction and profit-taking
Acceptance above is required for any sustained bullish continuation.
Logic: FVG zones after strong sell-offs often act as distribution or reaction points before direction is decided.
Key notes for the week
Volatility remains elevated after the sell-off — expect false breaks.
Avoid mid-range trades without confirmation.
Let price prove acceptance or rejection at levels before committing.
This is a week for patience and execution, not conviction.
Weekly focus:
Will gold hold the trendline retest and rebuild higher, or fail at the 5030–5050 zone and rotate deeper into value?
— Liam

JAMNAAUTO 1 Day Time Frame • Last close: ~₹124 – ₹124.36 on NSE/BSE.
• Recent daily range: Low ~₹116.60 – High ~₹126.55.
📊 Daily Support & Resistance Levels (Key Zones)
Pivot Point (Daily)
Daily Pivot ~ ₹120 – ₹123.55: Key reference for intraday bias — above is bullish, below is bearish.
Resistance Levels
R1: ~ ₹125–₹125.32 – first hurdle above pivot.
R2: ~ ₹128–₹128.38 – stronger resistance near recent swing highs.
R3: ~ ₹130–₹130.15 – extended upside pivot.
Support Levels
S1: ~ ₹120 – ₹120.49 – first support near pivot/MA levels.
S2: ~ ₹118.5 – ₹118.72 – next layer of downside support.
S3: ~ ₹115.5 – ₹115.66 – deeper support zone.
These pivot-derived levels are commonly used for intraday and next-day trading reference.
📈 What Technical Indicators Suggest (Daily)
Moving Averages / Momentum
Short-term MAs around 20–50 DMA are near the pivot zone, indicating mixed momentum around the current price.
On some technical panels, oscillators like RSI may be neutral or slightly bearish/bullish depending on the source — indicating no strong momentum bias right now.
🧠 How to Use This for a 1-Day View
Bullish Bias (short-term) if:
✔ Price sustains above daily pivot (~₹122–123)
✔ Break of R2 (~₹128–₹128.4) with volume
Bearish / Caution if:
❌ Price closes below S1 (~₹120)
❌ Momentum indicators turn down from resistance
⚠️ Risk & Notes
These levels are technical guides — not investment advice.
Price can gap on news earnings, market sentiment, or sector moves.
Always combine with your own risk management (stop-loss, position sizing).

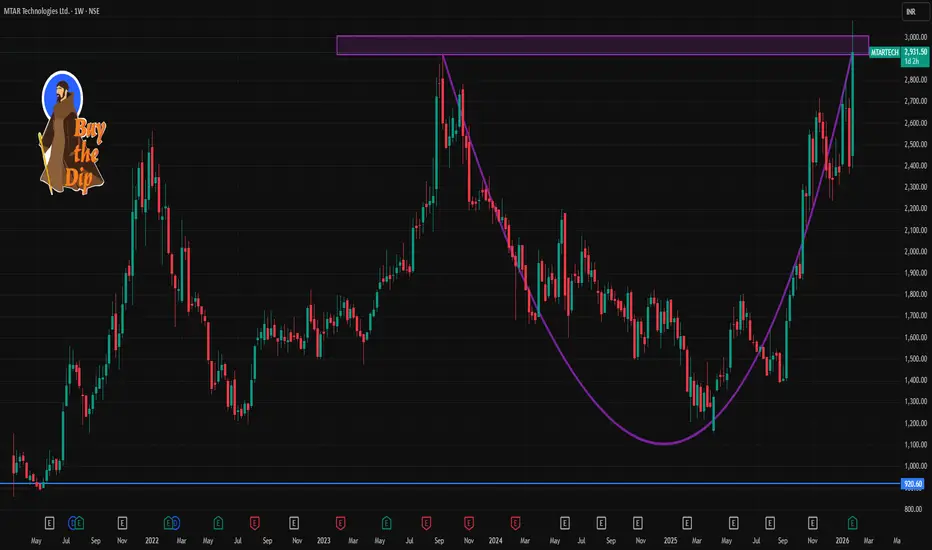
MTARTECH 1 Week Time Frame 📊 Current Price Snapshot
MTAR Technologies closed around ₹2,931–₹2,932 recently.
📈 Weekly Pivot & Support/Resistance Levels
(Important zones likely to act as reference over ~1 week)
🔹 Pivot Levels
These are calculated based on recent price activity and help gauge short-term bias:
Central Pivot ≈ ₹2,909–₹2,954 (key balance level)
🔹 Resistance Levels
Potential upside barriers where price may slow/reverse:
₹2,995–₹3,031 near short-term upper range
₹3,100–₹3,178 next resistance cluster
Above ₹3,200 breakout target (longer weekly/extension)
🔻 Support Levels
Important zones to watch if price pulls back:
₹2,741–₹2,762 area (S1) — near immediate short-term support
₹2,562–₹2,600 range (S2) — strong secondary support
₹2,461–₹2,500 (S3/S4) — deeper pullback zone
These resistances/supports are based on pivot point calculations & Fibonacci extensions covering multiple pivot methods.
📊 Technical Indicators (Short-Term Context)
Moving averages (20, 50, 100, 200 DMA) are largely bullish in daily/weekly analysis, supporting upward momentum.
RSI is near bullish territory but approaching overbought on shorter frames — indicating possible consolidation ahead.
Some technical tools show short-term buy signals; others show neutral — indicating range movement with upside bias.
📌 How to Use These Levels
Bullish Scenario:
➡ Price sustaining above the pivot (~₹2,890-₹2,950) suggests continuation toward ₹3,000 → ₹3,100+ resistance levels.
Bearish/Retracement Scenario:
➡ Failure below pivot or key support near ₹2,740 could trigger pullbacks toward ₹2,600 → ₹2,500 support zones.
This setup works well for 3–7 day trading or planning entry/exit zones.
INFIBEAM 1 Week Time Frame 📌 Current Price Snapshot
📍 Latest traded price: ₹16.25 – ₹16.30 approx. (last session)
📈 52-week range: ₹13.63 (low) – ₹22.02 (high)
📊 Near-Term 1-Week Technical Levels
🔰 Pivot Point (Reference)
Pivot: ~₹15.6 – ₹15.7 (neutral zone for short-term bias)
🛑 Resistance (Upside Targets)
These are levels where price may face selling pressure this week:
Level Mark (Approx) Notes
R1 ~₹15.8 – ₹16.0 First hurdle near current action zone
R2 ₹16.3 – ₹16.4 Key near-term resistance — breakout above this could add momentum
R3 ₹16.8 – ₹17.0 Next upside target if buyers remain strong
👉 A decisive daily close above ~₹16.4–₹16.5 can open the door toward ₹17.0+ in the week.
🧱 Support (Downside Floors)
These are levels where dips may find buyers this week:
Level Mark (Approx) Notes
S1 ₹15.3 – ₹15.4 First strong support — psychologically key pivot band
S2 ₹15.0 – ₹15.1 Next cushion below if the market weakens
S3 ₹14.8 – ₹14.7 Deeper support zone if selling accelerates
👉 A breakdown below ~₹15.0 would increase bearish pressure for the week.
📈 Short-Term Bias Interpretation
Bullish scenario:
If price holds above ₹15.6–₹15.7 pivot and breaks ₹16.3–₹16.4, the next near-term move could be toward ₹16.8–₹17.0+.
Neutral / range-bound:
Between ₹15.3 and ₹16.3, expect consolidation/trading range.
Bearish scenario:
Sustained trading below ₹15.3 risks weakening into ₹15.0 and lower.
🧠 Quick Trading Guide (1-Week)
📍 Watch for reaction at:
✔ Above ₹16.3–₹16.4 = possible upside extens ion
✔ Below ₹15.3 = risk of deeper pullback
📊 Trend cues: Recent technical indicators show mixed momentum — short-term range with pickup if buyers assert near pivot area.

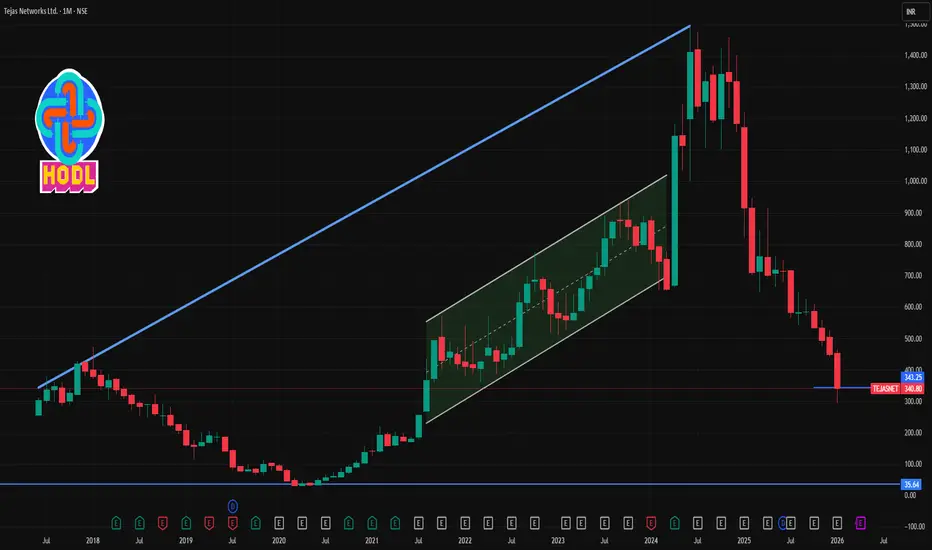
TEJASNET 1 Month Time Frame 📊 Current Price Snapshot (Approx)
Last traded price ~ ₹330-₹345 on NSE/BSE during late Jan 2026, after recent volatility and sell-offs.
📉 1-Month Timeframe — Key Levels
🔻 Support Levels (Downside)
These are levels where the stock could find buyers or pause losses on a 1-month chart:
Support Zone Significance
₹320 – ₹325 Immediate support; recent intraday floor (current price region)
₹301 – ₹315 Secondary support zone from pivot breakdowns
₹285 – ₹300 Deeper support if broader bearish momentum continues
📈 Resistance Levels (Upside)
Resistance Zone Importance
₹355 – ₹360 1st resistance from short-term moving average relevance
₹370 – ₹375 Next resistance cluster near recent intraday reactions
₹390 – ₹395 Higher resistance if bounce gains strength
🧠 Technical Indicator Context (1-Month)
📉 Trend Bias: Bearish overall, price trading significantly below major moving averages (20-day, 50-day, etc.).
📊 RSI: Near oversold but not confirmed bottom — suggests bearish momentum but potential for short-term rebounds.
📉 MACD & STOCH: Bearish signals persist, indicating weak price action on the 1-month chart.
🗂 Summary — 1-Month View
⚠️ Bearish Bias: The stock is in a short-term downtrend, trading below key moving averages and suffering weak momentum.
🛑 Support in Focus: ₹320-₹315 first; further deeper zone near ₹285-₹300 if bears intensify.
📈 Resistance Roadblock: ₹355-₹360 key for initial bounce; stronger rally needs break above ₹370+.
📉 Bearish Technicals: RSI not strongly indicating reversal yet; MACD remains bearish.