BANKINDIA 1 Week Time Frame 📌 Current Price Reference (approx): ~₹167 – ₹168 (NSE) — this is the live trading range.
📊 Weekly Timeframe Levels (Key Zones)
🟢 Weekly Pivot & Major Levels
(from pivot calculations relevant on weekly timeframe)
Weekly Major Support Range:
• S2 ~ ₹139 – ₹140 (strong weekly support)
• S1 ~ ₹151 – ₹158 (immediate weekly support zone)
Weekly Pivot Level:
• ~ ₹158 – ₹160 — pivot area where trend bias is decided weekly.
Weekly Resistance Levels:
• R1 ~ ₹170 – ₹173 — immediate weekly resistance target.
• R2 ~ ₹176 – ₹180+ — extended weekly upside if momentum holds.
📌 Interpretation:
Above ~₹158–₹160 → weekly bullish bias.
Below ~₹151–₹155 → weakness increases and pullbacks deepen.
Break of ~₹140 → trends could shift further bearish or corrective on weekly.
📍 Shorter Weekly Support/Resistance (Pivot-Based)
(Source: real-time pivot & shorter timeframe reactive levels)
Resistance 1: ~₹165 – ₹167
Pivot: ~₹163 – ₹165
Support 1: ~₹161 – ₹162
Support 2: ~₹158 – ₹159
(These are reactive pivots used by short-term traders on weekly charts.)
🧠 Weekly Technical Context
Bullish signals still intact — weekly technical rating shows buy trend currently, supported by momentum indicators.
Trend observation:
Stock has been above key moving averages and showing higher weekly closes recently.
A breakout above the R1–R2 zones (~₹170–₹180) could see further continuation higher.
Caution: If price loses the major support cluster (~₹151–₹158), deeper corrections toward ₹140+ area may follow.
Community ideas

ADANIENT 1 Week Time Frame 📊 Latest Price Context (approximate)
Current price: ~₹2,220–₹2,230 on NSE.
📈 Key Levels to Watch This Week
🟢 Resistance Levels
These are zones where price may face selling pressure if it moves up:
R1: ~₹2,242–₹2,244
R2: ~₹2,259–₹2,274
R3: ~₹2,280–₹2,283
(Short-term resistances from pivot derivations)
Upside breakout trigger:
A sustained move above ~₹2,280–₹2,300 could attract further buying and reduce short-term bearish bias.
🔵 Support Levels
These are potential pullback zones on weakness:
S1: ~₹2,205–₹2,210
S2: ~₹2,176–₹2,180
S3: ~₹2,125–₹2,130
(Derived from pivots and support bands)
Key downside watch:
A break below ~₹2,175–₹2,180 could drag price toward the next support zone around ₹2,125–₹2,130.
🔁 Pivot Point
Pivot: ~₹2,220–₹2,225
This is the midpoint level — if price stays above it, short-term buyers may defend; if below, sellers could dominate.
📉 Technical Tone (1-Week)
1-week technical rating from broader charting data currently shows a sell bias/neutral signals at short time frames.
Price trading sideways/slightly below some short-term moving averages signals cautious action and range behavior.

GROWW 1 Day Time Frame 📈 Daily Timeframe — Key Levels
🔁 Daily Pivot (Trend Reference)
Pivot Point (Daily): ~₹171.39 — central equilibrium price for the day. Above this suggests near-term strength; below suggests weakness.
🟢 Resistance Levels (Upside Barriers)
R1 ~ ₹175–₹176 — first resistance from pivot-based calculation.
R2 ~ ₹178–₹180 — higher resistance zone for continuation.
R3 ~ ₹203–₹235 — long-term structural resistance (classic pivot range).
👉 A clear daily close above ~₹176–₹178 would signal a stronger uptrend toward the higher zone near ₹200+.
🔴 Support Levels (Downside Floor)
S1 ~ ₹158–₹159 — first key support zone.
S2 ~ ₹139–₹140 — next support if price weakens further.
S3 ~ ₹107–₹110 — deep structural support (prior low).
👉 A breakdown below S1 (~₹158) on daily close increases probability of move toward ~₹139–₹140.
📊 Short-Term Intraday Pivots & Levels (Quick Reference)
From intraday brokers — similar daily-trend levels:
Daily Pivot ~₹169.7
R1 ~₹171.3
R2 ~₹173.4
R3 ~₹175.0
S1 ~₹167.6
S2 ~₹166.0
S3 ~₹163.9
⚠️ These are useful for intraday flow but daily pivot levels listed above are more relevant for 1-day timeframe.
📌 Current Technical Bias
RSI around mid-neutral (~55) suggests no extreme overbought/oversold condition.
Moving averages (10-EMA, 20-EMA) close to price — potential range compression.
Conclusion:
📈 Bullish scenario: Sustained daily close above ₹175–₹178 targets ₹190+ → ₹200+.
📉 Bearish scenario: Failure below ₹158–₹159 could target ₹140 or lower.

XAUUSD H1 – Sideway Compression Before Expansi Gold is currently trading in a tight H1 range after the previous impulsive bullish move. Momentum has slowed, and price action has shifted from trending to accumulation.
This is no longer a “chase-the-trend” environment. It is a range-based market waiting for confirmation.
🧠 Market Structure Context
Short-term bullish structure remains intact as long as price holds above the rising trendline.
Multiple small-bodied candles with wicks on both sides reflect indecision.
Volatility compression suggests a potential expansion phase ahead.
➡️ Current state: Compression before breakout.
📌 Key Price Levels
🔴 Resistance Zones
5,071 → Range high, breakout trigger level
5,026 → Mid-range resistance
🔵 Support Zones
4,984 → Near-term range low
4,948 → Critical structural support
🎯 Analytical Outlook
Holding above 4,984 keeps the range biased toward bullish continuation.
A confirmed H1 close below 4,948 signals structural weakness and potential downside expansion.
A clean break and hold above 5,071 activates the next bullish impulse leg.

HINDZINCHINDZINC FUTURES (1D) — Make or Break Zone
Price is sitting right at a decision area.
🔵 Buy above: 616
🔴 Stop loss: 593
🎯 Upside levels: 640 → 660 → 690
After a sharp fall, price is trying to base near support while RSI cools off.
A clean breakout above 616 can trigger short covering + fresh momentum.
No prediction. Only reaction to levels.
Plan the trade. Trade the plan.

Energy Transition and Green Commodities: A Detailed Overview1. Understanding Energy Transition
Energy transition refers to the global shift from traditional, carbon-intensive energy sources such as coal, oil, and natural gas, to low-carbon or renewable energy sources including solar, wind, hydro, and nuclear power. This transformation is not merely technological but encompasses economic, social, and policy dimensions, redefining how energy is produced, distributed, and consumed.
1.1 Drivers of Energy Transition
Climate Change and Environmental Concerns:
The Intergovernmental Panel on Climate Change (IPCC) warns that global warming must be limited to 1.5°C to prevent catastrophic climate impacts. Fossil fuel combustion is a major contributor to CO₂ emissions, necessitating a shift to clean energy.
Technological Innovation:
Advances in solar photovoltaic (PV) panels, wind turbines, battery storage, and smart grids have made renewable energy cost-competitive with fossil fuels. Technologies such as green hydrogen and carbon capture and storage (CCS) are further accelerating the transition.
Policy and Regulatory Support:
Governments worldwide are promoting renewable energy through subsidies, tax incentives, and mandates for clean energy adoption. Initiatives like the European Green Deal and the U.S. Inflation Reduction Act illustrate this trend.
Energy Security:
Diversifying energy sources reduces dependence on imported fossil fuels and enhances energy resilience, particularly in geopolitically sensitive regions.
2. Components of the Energy Transition
The energy transition is multidimensional, involving multiple sectors:
Electricity Generation:
Transitioning power grids from coal and gas-based plants to renewable sources like wind, solar, and hydro is central. Renewable energy accounted for nearly 30% of global electricity in 2025 and is projected to rise steadily.
Transportation:
Electric vehicles (EVs) are replacing internal combustion engine (ICE) vehicles. Hydrogen fuel cells and biofuels are also emerging in aviation, shipping, and heavy transport.
Industrial Decarbonization:
Heavy industries, including steel, cement, and chemicals, are adopting low-carbon technologies, such as electric arc furnaces for steel and green hydrogen-based processes.
Building and Infrastructure:
Energy efficiency measures, heat pumps, and solar rooftop panels are crucial for reducing emissions in residential and commercial sectors.
3. The Role of Green Commodities
Green commodities are essential materials that support the energy transition. They are broadly classified into metals, energy carriers, and bio-based resources.
3.1 Critical Metals for Clean Energy
Lithium, Cobalt, and Nickel:
These metals are vital for lithium-ion batteries powering EVs and grid storage. Global demand for lithium is projected to grow by 500% by 2030 due to EV adoption and renewable integration.
Copper:
Copper is crucial for electrical wiring, renewable energy generation, and EV infrastructure. A single EV uses 3–4 times more copper than a conventional car.
Rare Earth Elements (REEs):
Neodymium, praseodymium, and dysprosium are used in high-performance magnets for wind turbines and electric motors.
3.2 Renewable Energy Commodities
Silicon:
Used in solar PV panels, silicon demand is surging alongside global solar installation targets.
Uranium:
Though controversial, nuclear energy remains part of the low-carbon transition, requiring uranium as fuel.
Biofuels and Biomass:
Commodities such as ethanol, biodiesel, and sustainable biomass support the decarbonization of transport and industry.
4. Economic and Market Implications
The energy transition and green commodities market are intertwined, influencing global trade, investment flows, and geopolitical strategies.
Commodity Price Volatility:
Increased demand for lithium, cobalt, and nickel has led to price spikes, affecting battery and EV costs. Supply chain bottlenecks, particularly in politically sensitive regions, further amplify volatility.
Investment Opportunities:
Investors are shifting capital toward renewable energy projects, battery manufacturing, and green commodity mining. ESG (Environmental, Social, Governance) funds and green bonds are also gaining traction.
Geopolitical Shifts:
Countries rich in green commodities, such as lithium-rich Chile or cobalt-rich Congo, are becoming strategic players in global energy security. Dependence on a few nations for critical metals can create geopolitical leverage and supply risks.
5. Challenges in Energy Transition and Green Commodities
Despite the clear benefits, the transition faces several obstacles:
Resource Scarcity and Mining Impact:
Extraction of lithium, cobalt, and rare earths can cause environmental degradation, water scarcity, and human rights concerns.
Technological Bottlenecks:
Battery recycling, grid integration, and energy storage technologies are still evolving. Scaling green hydrogen economically remains a challenge.
Policy and Regulatory Gaps:
Inconsistent policies across regions can slow adoption and investment. Carbon pricing, subsidies, and emissions regulations must align globally.
Socio-Economic Transition:
Fossil fuel-dependent regions face job losses and economic restructuring challenges, requiring just transition strategies to protect communities.
6. Future Outlook
The future of energy transition and green commodities is promising yet complex:
Electrification and Digitalization:
Widespread electrification, combined with smart grids and AI-enabled energy management, will optimize energy usage and reduce emissions.
Circular Economy:
Recycling and reuse of critical metals from batteries and electronic waste will reduce dependency on virgin mining.
Global Collaboration:
International partnerships for technology transfer, sustainable mining practices, and renewable energy deployment will accelerate progress.
Sustainable Investment:
Green finance, carbon credits, and ESG-focused investments will direct capital to projects that support decarbonization.
7. Conclusion
The energy transition represents one of the most significant shifts in modern industrial history, redefining how energy is produced, consumed, and traded. Green commodities are at the heart of this transformation, serving as the building blocks for renewable energy, electrified transport, and low-carbon industrial processes. While challenges like resource scarcity, technological limitations, and geopolitical risks persist, innovation, policy support, and global cooperation are driving the momentum toward a sustainable, net-zero future.
In essence, energy transition and green commodities are not just environmental imperatives—they are economic opportunities and strategic necessities shaping the 21st-century global landscape. Nations and industries that adapt quickly will not only reduce their carbon footprint but also secure leadership in the emerging low-carbon economy.

Emerging Market Currencies Trading: An In-Depth OverviewIntroduction to Emerging Markets
Emerging markets (EMs) refer to economies that are in a transitional phase between developing and developed status. They typically exhibit rapid economic growth, industrialization, and improvements in financial markets. Examples of prominent emerging markets include India, Brazil, Indonesia, Mexico, Russia, Turkey, and South Africa. These economies attract global investors due to higher growth potential compared to developed markets but come with higher risks, such as political instability, inflation, and currency volatility.
In global finance, currencies of emerging markets are collectively referred to as emerging market currencies (EMCs). Unlike the relatively stable currencies of developed nations such as the U.S. dollar, euro, or Japanese yen, EMCs are known for higher volatility and sensitivity to external shocks. This makes trading them both risky and potentially profitable.
Key Emerging Market Currencies
Some of the most traded emerging market currencies include:
Indian Rupee (INR) – Driven by India’s strong economic growth, IT exports, and foreign investment inflows.
Brazilian Real (BRL) – Highly commodity-dependent, affected by global oil and agricultural prices.
Russian Ruble (RUB) – Linked to energy exports; sensitive to geopolitical events and sanctions.
Indonesian Rupiah (IDR) – Influenced by regional trade and foreign direct investment.
South African Rand (ZAR) – Often considered a proxy for global risk appetite, as South Africa is rich in gold and other commodities.
Turkish Lira (TRY) – Highly volatile, affected by domestic politics, inflation, and interest rate policies.
These currencies are frequently traded against the U.S. dollar (USD), as the dollar serves as the global reserve currency and benchmark for international trade. Common trading pairs include USD/BRL, USD/INR, USD/TRY, and USD/ZAR.
Factors Driving Emerging Market Currency Movements
Emerging market currencies are influenced by a combination of domestic economic policies, global financial trends, and investor sentiment. Key factors include:
Interest Rate Differentials
Higher interest rates in an emerging market attract foreign capital, strengthening its currency. Conversely, if U.S. or European rates rise, investors may withdraw funds from EMs, causing depreciation.
Inflation and Monetary Policy
Persistent inflation weakens the purchasing power of an EMC. Central banks in EMs often adjust policy rates to stabilize the currency and attract foreign investment.
Political Stability and Governance
Political uncertainty or poor governance can trigger sudden capital outflows. For example, unexpected elections or policy changes can cause sharp declines in currency value.
Commodity Prices
Many emerging economies are commodity exporters. For instance, the Russian ruble is tied to oil prices, while the South African rand is influenced by gold and platinum. Commodity price fluctuations directly affect trade balances and currency strength.
Global Risk Sentiment
EMCs are often seen as risk assets. During global economic uncertainty, investors shift funds to “safe-haven” currencies like the USD, JPY, or CHF. This often leads to sharp depreciation in EMCs.
External Debt and Capital Flows
Countries with high external debt in foreign currencies are vulnerable to currency depreciation. Conversely, strong foreign direct investment inflows can support a currency.
Trading Emerging Market Currencies
Trading emerging market currencies can be approached through several methods:
Spot Forex Market
The most direct method, where traders buy or sell EMCs against another currency, usually USD. This market operates 24 hours, five days a week, offering high liquidity but also high volatility.
Forward and Futures Contracts
Traders use forwards and futures to hedge or speculate on future currency movements. For example, an Indian exporter may use USD/INR forwards to lock in a favorable rate for a future payment.
Currency ETFs and ETNs
Exchange-traded funds (ETFs) and exchange-traded notes (ETNs) provide exposure to EMCs without directly trading forex. For instance, ETFs tracking the Brazilian real or Indian rupee allow investors to participate in currency movements.
Options and Derivatives
Options provide flexibility for hedging or speculative trades. They allow traders to benefit from large swings in EMCs while limiting risk.
Carry Trade Strategy
A popular strategy in EMC trading involves borrowing in a low-interest-rate currency and investing in a high-interest-rate EMC. While potentially profitable, this strategy is highly sensitive to currency volatility.
Risks in Emerging Market Currency Trading
Trading EMCs carries higher risk than trading major currencies. Key risks include:
Volatility Risk
EMCs can experience daily swings of 2–5% or more, compared to 0.5–1% for major currencies.
Liquidity Risk
Some EMCs have limited liquidity, making large trades costly or causing slippage.
Political and Regulatory Risk
Sudden capital controls, government interventions, or political instability can impact currency value drastically.
Global Market Risk
A global recession, U.S. dollar strength, or geopolitical crisis can trigger massive sell-offs in EMCs.
Interest Rate and Inflation Risk
Unexpected changes in monetary policy or inflation can erode currency value rapidly.
Counterparty Risk
In derivative contracts or currency swaps, the risk that the counterparty may default is higher in emerging markets compared to developed markets.
Strategies for Trading Emerging Market Currencies
Successful EMC trading often requires a combination of technical, fundamental, and macroeconomic analysis:
Fundamental Analysis
Traders monitor GDP growth, inflation rates, interest rates, fiscal policies, and geopolitical events to forecast currency movements.
Technical Analysis
Price charts, trend lines, support/resistance levels, and momentum indicators help identify entry and exit points in volatile markets.
Diversification
Spreading trades across multiple EMCs or combining EMCs with major currencies reduces exposure to individual currency shocks.
Hedging
Businesses dealing with international trade can hedge currency risk using forwards, futures, or options.
News and Event Trading
EMCs are sensitive to news like central bank announcements, elections, trade agreements, or commodity price changes. Traders often use these events for short-term trading opportunities.
Risk Management
Stop-loss orders, position sizing, and careful leverage management are critical in managing the high volatility inherent in EMCs.
Global Trends Influencing EMC Trading
U.S. Dollar Dominance
Since most EMCs are quoted against the USD, fluctuations in dollar strength directly affect EM currencies. A stronger dollar often leads to EM currency depreciation.
China’s Role
As a major trading partner for many EMs, China’s economic performance, trade policies, and currency movements impact EM currencies significantly.
Technological Advancements
Improved trading platforms, high-frequency trading, and AI-based forecasting have increased participation in EMC markets globally.
Emergence of Digital Currencies
Some EMs are exploring central bank digital currencies (CBDCs), which could change how currency trading is conducted in the future.
Shift in Global Capital Flows
Institutional investors increasingly diversify into EM currencies for higher yields, while retail traders gain exposure via ETFs and online brokers.
Conclusion
Emerging market currency trading offers high-reward opportunities but comes with significant risks. Understanding macroeconomic fundamentals, global financial trends, and local political and economic conditions is essential for traders and investors. While volatility is high, disciplined strategies, risk management, and diversification can help traders capitalize on opportunities in these dynamic and fast-evolving markets.
Emerging market currencies serve as a bridge between global investors seeking growth and EM economies seeking foreign capital. They remain a critical component of global forex markets, reflecting both the promise and perils of economic development.

Part 1 Institutional Option Trading VS. Technical Analysis ⭐ 1. What Are Options?
Options are contracts, not shares.
They give you a right, not an obligation, to buy or sell something.
That “something” is usually a stock, index, commodity, or currency.
Options have an expiry date — they lose value as time passes.
Options are part of a bigger market called derivatives.
They derive their value from the underlying asset (like Nifty, Bank Nifty, stocks).
An option is like a reservation — you pay a small price to control a large position.
This small price is called premium.
Because premium is small, options give leverage — small money, big impact.
Options can be used to hedge, speculate, or generate income.

How to Handle Loss in Trading?Handling loss in trading can be a difficult and emotional experience, but it’s an inevitable part of the process. Here are some strategies that you can use to manage losses:
1. Accept that losses are a normal part of trading:
One of the most important things to do is to accept that losses are an inevitable part of trading. No trader is immune to losses, and they are a necessary component of making profits in the long run.
2. Set a stop-loss:
A stop-loss is an order placed with your broker to automatically sell a security when it reaches a certain price. By setting a stop-loss, you can limit your losses and prevent them from escalating beyond your predetermined threshold.
3. Analyze your trades:
It’s important to analyze your trades to understand why you incurred a loss. Were there any errors in your analysis or execution? Did you follow your trading plan? Understanding why you lost money can help you avoid making the same mistakes in the future.
4. Adjust your risk management strategy:
Consider adjusting your risk management strategy. For example, you could reduce your position size or increase your stop-loss levels.
5. Take a break:
If you’re feeling overwhelmed or emotional after a loss, take a break. Step away from trading and focus on other activities that can help you clear your mind.
6. Learn from your losses:
Every loss is an opportunity to learn and improve your trading skills. Keep a trading journal and document your trades, including your thought process and the reasoning behind each trade. Reviewing your trades regularly can help you identify patterns and improve your decision-making skills.
7. Seek professional help:
If you’re struggling to handle losses or find yourself experiencing persistent losses, consider seeking professional help. A financial advisor or a trading coach can help you develop a better trading strategy and manage your emotions effectively.
8. Maintain a positive mindset:
It’s important to maintain a positive mindset and avoid getting discouraged by losses. Instead, focus on the long-term goals and keep a positive outlook. Remember that losses are a natural part of the trading process and can be valuable learning experiences.
9. Diversify your portfolio:
Diversifying your portfolio can help spread the risk and minimize the impact of losses on your overall investment. Consider investing in different asset classes, industries, or geographical regions to reduce your exposure to any single investment.
10. Avoid revenge trading:
Revenge trading is when you try to make up for your losses by immediately placing another trade. This can lead to emotional decision-making and further losses. Instead, take a break and analyse your trades before making any new decisions.
11. Follow a trading plan:
A trading plan is a set of rules that you follow when making trading decisions. Following a well-defined trading plan can help you make objective decisions and avoid impulsive actions that can lead to losses.
12. Practice risk management:
Practising good risk management is critical to managing losses. Always ensure that your trades have an acceptable risk-reward ratio, and never risk more than you can afford to lose.
13. Seek support from other traders:
Trading can be a lonely activity, and it’s important to connect with other traders who can provide support and guidance. Consider joining trading communities or forums where you can share your experiences and learn from others.
14. Avoid trading under emotional stress:
Emotional stress can cloud your judgment and lead to impulsive decisions that result in losses. If you’re under emotional stress, it’s best to take a break from trading until you’re in a better mental state.
15. Keep your losses in perspective:
It’s important to keep your losses in perspective and avoid dwelling on them. Remember that losses are a natural part of the trading process and that even the most successful traders experience them from time to time. Instead of focusing on your losses, focus on your overall trading strategy and long-term goals.
In summary,
handling losses in trading is about accepting them as a natural part of the process, learning from them, and taking steps to mitigate them in the future. By following these strategies, you can minimize the impact of losses on your trading portfolio and become a more successful trader over time.

Market Correlations & Intermarket Analysis1. Market Correlations: Definition and Importance
Market correlation refers to the statistical relationship between the price movements of two or more assets. Correlation is measured on a scale from -1 to +1:
+1 correlation: The assets move perfectly in the same direction. If one rises 1%, the other rises 1%.
-1 correlation: The assets move perfectly in opposite directions. If one rises 1%, the other falls 1%.
0 correlation: No discernible relationship exists; movements are independent.
Why correlations matter:
Risk Management: Portfolio diversification relies on understanding correlations. Assets with low or negative correlation can reduce overall portfolio volatility. For example, stocks and bonds often have low or negative correlations, helping stabilize returns during market turbulence.
Trading Strategies: Correlations help traders identify potential hedges or pairs trading opportunities. For example, if gold and silver are highly correlated, movements in one may predict the other.
Market Sentiment Insight: Correlations reveal the behavior of market participants. Strong correlations between equities and commodities may indicate risk-on or risk-off sentiment in the broader market.
2. Types of Market Correlations
Positive Correlation:
Examples include:
S&P 500 and Nasdaq: Broad stock indices often move together due to overall market trends.
Crude Oil and Energy Stocks: Rising oil prices generally boost energy sector equities.
Negative Correlation:
Examples include:
Stocks and Bonds: In periods of stock market decline, investors often seek safety in government bonds.
US Dollar and Gold: Gold often rises when the USD weakens, as it is priced in dollars globally.
Dynamic or Time-Varying Correlation:
Correlations are not static. They change over time due to macroeconomic events, policy shifts, or market cycles. For instance:
During financial crises, correlations between stocks tend to increase, a phenomenon known as “correlation breakdown” in diversification.
Cross-Asset Correlation:
Beyond traditional assets, correlations also exist across asset classes. For example:
The price of oil may influence the Canadian dollar because Canada is a major oil exporter.
Interest rate changes in the U.S. impact emerging market equities and currencies.
3. Intermarket Analysis: Concept
Intermarket analysis is the study of relationships between different financial markets to forecast trends and confirm signals. The approach was popularized by John J. Murphy, who emphasized that no market moves in isolation. Intermarket analysis identifies leading, lagging, and coincident relationships between asset classes.
Key principle: Asset classes often react to the same economic forces but in different ways. By analyzing these reactions, traders can anticipate movements and make informed decisions.
4. Key Intermarket Relationships
Stocks vs. Bonds
Bonds are traditionally considered safe-haven assets, while stocks represent growth.
Rising interest rates usually depress bond prices and may negatively impact stock valuations due to higher borrowing costs.
Conversely, falling rates can boost equities while raising bond prices.
Stocks vs. Commodities
Commodity prices, such as oil or metals, impact inflation and corporate profits.
Higher oil prices may benefit energy stocks but hurt sectors sensitive to input costs.
Precious metals like gold often act as hedges against equity market volatility.
Commodities vs. Currencies
Commodity-exporting nations’ currencies often move in sync with their key exports.
Example: Canadian dollar vs. crude oil, Australian dollar vs. iron ore and gold.
Traders monitor these relationships to anticipate currency fluctuations.
Stocks vs. Currencies
Strong domestic currency can negatively affect exports, impacting companies’ earnings.
Conversely, weak currency can boost exporters but may increase import costs.
Interest Rates vs. Stocks
Rising interest rates increase the cost of capital, generally slowing equity growth.
Declining rates often create a favorable environment for stocks.
Sentiment & Risk-On/Risk-Off Relationships
In risk-on environments, equities and commodities rise while safe-haven assets like bonds and gold may decline.
In risk-off periods, the opposite pattern occurs.
5. Using Correlations in Trading
Practical applications:
Hedging Portfolios
Traders hedge exposure by taking positions in negatively correlated assets. For instance, long equities may be hedged with long bonds or gold.
Pairs Trading
Traders exploit temporary divergences in highly correlated assets. For example, if crude oil and energy stocks usually move together but diverge, a trade may profit from the eventual reconvergence.
Leading and Lagging Indicators
Certain markets act as leading indicators. For instance:
Bond yields often lead stock market trends.
Crude oil price changes may precede moves in commodity currencies.
Confirmation and Divergence
Correlations can confirm trends. For example, a rising stock market accompanied by declining bond yields may confirm a strong growth environment.
Divergences often signal caution. For example, equities rise while bonds and gold also rise, possibly indicating market stress.
6. Measuring Correlations
Statistical Measures
Pearson correlation coefficient: Measures linear relationships.
Spearman’s rank correlation: Captures monotonic relationships.
Rolling correlations: Show how relationships change over time.
Visual Tools
Correlation matrices are widely used to quickly identify relationships between multiple assets.
Intermarket charts plot asset classes together for comparative analysis.
7. Limitations
Correlation is Not Causation
Just because two assets move together does not mean one causes the other to move.
Dynamic Nature
Correlations change during market stress, economic cycles, or geopolitical events, sometimes reversing.
Over-Reliance Risk
Traders relying solely on historical correlations may be blindsided by sudden structural changes in markets.
8. Modern Intermarket Trends
Globalization has increased cross-market linkages.
Algorithmic trading exploits subtle correlations in milliseconds.
ETFs and derivatives amplify correlations across markets.
Central bank policies now have a global ripple effect, linking currencies, equities, and commodities more closely than ever.
9. Conclusion
Market correlations and intermarket analysis are indispensable tools for understanding financial markets. They help investors manage risk, identify opportunities, and anticipate market movements by analyzing how assets influence each other. While correlations offer quantitative insights, intermarket analysis provides a broader perspective, considering macroeconomic forces, market sentiment, and asset class interactions. Successful traders and investors integrate both approaches to create resilient portfolios and informed strategies, recognizing that markets are interconnected webs rather than isolated instruments.
In essence, understanding intermarket relationships allows one to see the market’s hidden signals, predict trends, and manage risks more effectively, making it a cornerstone of professional trading and investment analysis.

GOLD SPOT VIEWGOLD POSSIBLE MOVE
RESISTANCE 5290, 5470
SUPPORT 4922, 4700
4922 BELOW SUSTAIN OR CLOSE INVALIDATION
View is for study purpose only , we are not recommend any trade or investment
Always do your own analysis

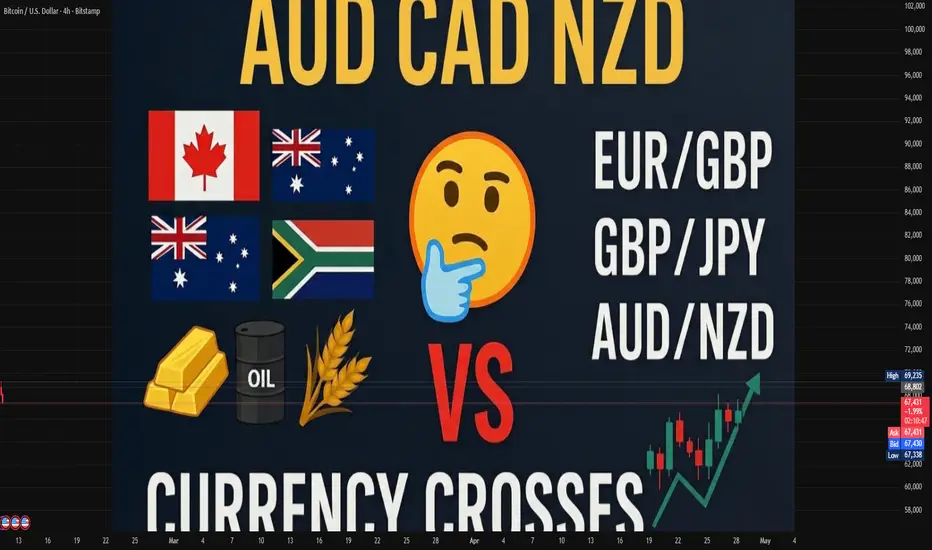
Commodity Currencies (AUD, CAD, NZD)Commodity Currencies Overview
Commodity currencies are national currencies of countries that rely heavily on the export of natural resources or commodities. These currencies are sensitive to global commodity prices because their economies are closely tied to the demand and supply of commodities such as metals, energy products, and agricultural goods. Among the most prominent commodity currencies in the world are the Australian Dollar (AUD), Canadian Dollar (CAD), and New Zealand Dollar (NZD). Each of these currencies reflects the underlying economic health and export performance of their respective nations.
1. Australian Dollar (AUD)
Economic Background:
Australia is rich in natural resources, including iron ore, coal, natural gas, and gold. The Australian economy is heavily reliant on the export of these commodities, particularly to Asian markets like China, Japan, and South Korea. Roughly 60–70% of Australia’s total exports are commodities, making the AUD highly sensitive to global commodity prices.
Relationship with Commodity Prices:
Iron Ore: Australia is the world’s largest exporter of iron ore, and changes in iron ore prices strongly affect the AUD. Rising demand from industrial powerhouses like China often strengthens the AUD.
Coal and Natural Gas: Australia is a leading exporter of thermal and metallurgical coal, as well as liquefied natural gas (LNG). Increases in global energy prices often lead to appreciation of the AUD.
Monetary Policy and Interest Rates:
The Reserve Bank of Australia (RBA) plays a critical role in influencing AUD value. Historically, the AUD has been considered a “high-yielding” currency because Australia has often maintained interest rates above other developed nations. Traders often engage in carry trades using the AUD, borrowing in low-interest currencies like JPY to invest in AUD for higher returns.
Trading Characteristics:
The AUD is highly liquid and traded against major currencies such as USD (AUD/USD), JPY (AUD/JPY), and EUR (AUD/EUR).
It is often considered a risk-on currency, meaning it appreciates when global risk sentiment is positive and depreciates in risk-off scenarios.
Market Influences:
Global Growth: Strong global economic activity increases demand for Australian exports, supporting AUD.
China’s Economy: Since China is Australia’s largest trading partner, Chinese GDP growth, industrial production, and infrastructure spending heavily influence AUD movements.
Commodity Prices: Fluctuations in iron ore, coal, and gold prices can trigger significant AUD volatility.
2. Canadian Dollar (CAD)
Economic Background:
Canada’s economy is resource-rich, with significant production of crude oil, natural gas, lumber, and metals. Oil exports, in particular, dominate Canada’s trade, making the CAD closely correlated with crude oil prices. Canada is one of the top global producers of crude oil, mainly from Alberta’s oil sands.
Relationship with Commodity Prices:
Oil: Approximately 40% of Canada’s total exports are energy products. The CAD is often referred to as a “petro-currency” because oil price movements have a direct effect on its value. Rising oil prices strengthen the CAD, while falling prices weaken it.
Natural Resources: Lumber, natural gas, and metals also contribute to CAD volatility, though oil remains the dominant factor.
Monetary Policy and Interest Rates:
The Bank of Canada (BoC) manages the nation’s monetary policy, influencing CAD through interest rate decisions. Similar to the AUD, the CAD has historically offered relatively higher interest rates compared to some developed economies, making it attractive for carry trades.
Trading Characteristics:
The CAD is highly liquid and traded against the USD (USD/CAD), EUR, and JPY.
USD/CAD is particularly sensitive to both oil price fluctuations and U.S. economic performance, as the U.S. is Canada’s largest trading partner.
CAD also responds to global risk sentiment but less strongly than the AUD, given its more defensive economic ties to energy markets.
Market Influences:
Oil Prices: A surge in crude oil prices tends to boost the CAD, as higher energy revenues improve Canada’s trade balance.
Global Risk Appetite: Risk-on environments moderately strengthen CAD, while risk-off events may weaken it.
U.S. Economy: Given the close trade relationship, strong U.S. growth can positively affect CAD.
3. New Zealand Dollar (NZD)
Economic Background:
New Zealand’s economy is smaller than Australia’s and Canada’s but highly dependent on commodity exports. Agricultural products—such as dairy, meat, wool, and fruit—form the backbone of its export sector. Approximately 50–60% of New Zealand’s exports are commodities, making the NZD sensitive to global agricultural demand.
Relationship with Commodity Prices:
Dairy Prices: Dairy products are the largest export category, especially to Asian markets. Global milk and dairy prices influence NZD significantly.
Meat and Forestry Products: Meat and wood product exports also impact the currency, though to a lesser degree than dairy.
Monetary Policy and Interest Rates:
The Reserve Bank of New Zealand (RBNZ) regulates interest rates, which historically have been relatively high compared to other developed nations. This has made the NZD a preferred currency for carry trades.
Trading Characteristics:
The NZD is traded primarily against the USD (NZD/USD), AUD (NZD/AUD), and JPY (NZD/JPY).
It behaves as a risk-on currency, often moving in tandem with global investor sentiment.
The NZD has high volatility relative to other major currencies, reflecting its dependence on agricultural commodity markets.
Market Influences:
Global Dairy Demand: Changes in Chinese and Asian demand for dairy exports strongly influence the NZD.
Commodity Prices: Milk, meat, and forestry prices can drive short-term NZD fluctuations.
Risk Sentiment: Like the AUD, NZD tends to appreciate during periods of global economic optimism.
Shared Characteristics of Commodity Currencies
Commodity Correlation:
All three currencies are closely linked to global commodity markets. AUD is linked to metals and energy, CAD to crude oil, and NZD to agricultural products.
Risk Sensitivity:
They are considered risk-on currencies, appreciating when global markets are bullish and depreciating during risk-off periods.
Interest Rate Differentials:
These currencies often offer higher interest rates relative to low-yielding currencies such as JPY or CHF, making them attractive in carry trades.
Export Dependency:
Their economies are export-driven, and changes in demand from major trading partners directly affect currency value.
Volatility:
Commodity currencies exhibit higher volatility than non-commodity currencies because commodity prices themselves are highly volatile, influenced by global supply-demand shifts, geopolitical events, and economic cycles.
Trading Strategies for Commodity Currencies
Commodity-Based Trading:
Traders often correlate currency movements with relevant commodity prices. For instance, rising oil prices could signal CAD strength.
Risk Sentiment Trading:
Since AUD and NZD are risk-on currencies, traders monitor global market risk appetite to anticipate currency moves.
Interest Rate and Carry Trades:
These currencies are favored in carry trades where investors borrow low-yielding currencies like JPY to invest in higher-yielding currencies such as AUD or NZD.
Fundamental Analysis:
Monitoring trade balances, GDP growth, and economic data releases from Australia, Canada, and New Zealand is essential for predicting currency strength.
Technical Analysis:
Due to their volatility, technical indicators like moving averages, support/resistance levels, and trend analysis are widely used in short- and medium-term trading.
Conclusion
The AUD, CAD, and NZD are quintessential examples of commodity currencies, with their values intrinsically tied to the performance of key export commodities and global economic trends. While the AUD and NZD are sensitive to metals, energy, and agricultural products and exhibit risk-on behavior, the CAD is strongly influenced by crude oil prices and trade relations with the U.S.
Investors and traders closely monitor commodity price movements, global economic growth, and central bank policies when trading these currencies. Their higher interest rates and sensitivity to risk sentiment make them attractive in both fundamental and technical trading strategies, but also inherently more volatile than non-commodity currencies like the USD or EUR.
Understanding these dynamics is crucial for anyone looking to trade, hedge, or invest in commodity currencies, as their fortunes rise and fall with the ebb and flow of global commodities and investor sentiment.
FOREX "PAIRS IN PLAY" Session 30 11 02 26Scanning multiple forex pairs to filter high-quality trade setups. No trades are forced—only structure-based opportunities.
Note: There may be a delay in this video due to upload processing time.
Disclaimer: FX trading involves high leverage and substantial risk, and losses can exceed your initial investment. This content is for educational purposes only and should not be considered financial advice. Trade at your own risk.

Global Macro Trading Strategies1. Origins and Evolution
Global macro trading gained prominence in the 1970s and 1980s, driven by the deregulation of global financial markets and the increasing volatility in currencies and commodities. Pioneers such as George Soros, Stanley Druckenmiller, and Bruce Kovner popularized the strategy, achieving extraordinary returns by anticipating shifts in central bank policies, geopolitical crises, and economic cycles.
Originally, global macro trading focused heavily on foreign exchange (FX) markets, given the availability of leverage and liquidity. Over time, it expanded to include equities, bonds, commodities, and derivatives, creating a multi-asset approach that seeks to profit from global economic imbalances.
2. Core Principles
Global macro trading strategies are underpinned by several core principles:
Top-Down Economic Analysis:
Traders analyze macroeconomic indicators, such as GDP growth, inflation, employment figures, interest rate policies, trade balances, and fiscal policy. This top-down approach helps identify which countries or regions may outperform or underperform.
Relative Value and Mispricing:
By comparing macroeconomic fundamentals across countries, traders identify assets that are overvalued or undervalued relative to global conditions. For example, if one country raises interest rates while another lowers them, the currency of the higher-rate country may strengthen.
Diversification Across Markets:
Global macro strategies are highly diversified, often spanning multiple asset classes—equities, bonds, FX, commodities, and derivatives—allowing traders to hedge risks and exploit multiple opportunities simultaneously.
Flexibility and Opportunism:
These strategies are not tied to a single asset class or market. Traders may go long or short equities, currencies, or commodities depending on their macroeconomic outlook, making the approach highly adaptable.
3. Types of Global Macro Strategies
Global macro trading strategies can be broadly classified into discretionary and systematic approaches:
A. Discretionary Global Macro
Discretionary traders rely on human judgment, research, and intuition to make decisions. They analyze macroeconomic reports, central bank statements, political developments, and market sentiment to determine trades.
Example: George Soros’ trade against the British pound in 1992 is a famous discretionary macro trade. He recognized that the UK could not maintain its fixed exchange rate under the European Exchange Rate Mechanism, shorted the pound, and profited massively.
Advantages:
Flexibility to respond to unforeseen events
Can incorporate qualitative factors like geopolitical tensions
Challenges:
Highly dependent on the trader’s skill and judgment
Subjective decision-making can increase risk
B. Systematic Global Macro
Systematic macro strategies use quantitative models and algorithms to identify trading opportunities. They rely on historical data, statistical patterns, and predictive models to generate trades with minimal human intervention.
Example: Trend-following systems that exploit momentum in currencies, commodities, or interest rates. A systematic model might detect a persistent uptrend in oil prices driven by supply constraints and automatically take a long position in oil futures.
Advantages:
Reduces human bias
Can process large amounts of data across global markets
Challenges:
Models may fail during unprecedented events
Requires continuous refinement to adapt to changing market conditions
4. Key Instruments in Global Macro Trading
Global macro traders use a wide variety of financial instruments to express their macroeconomic views:
Currencies (FX):
Currency pairs are heavily influenced by interest rate differentials, central bank interventions, and trade flows. Currency trading allows macro traders to profit from fluctuations in exchange rates between countries.
Equities and Stock Indices:
Traders take long or short positions in equities or indices based on economic outlooks. For instance, if a country is expected to experience strong GDP growth, the trader may go long its stock index.
Fixed-Income Securities:
Bond yields and prices are sensitive to interest rate changes and inflation expectations. Macro traders often trade government bonds or bond futures to profit from anticipated rate moves.
Commodities:
Commodities like oil, gold, and agricultural products respond to geopolitical tensions, supply-demand imbalances, and currency fluctuations. Commodity futures and options are common tools for macro traders.
Derivatives:
Options, swaps, and futures provide leverage and flexibility, allowing macro traders to hedge positions or speculate on specific scenarios like interest rate changes or currency volatility.
5. Strategies and Approaches
Several specific strategies fall under global macro trading, including:
Directional Macro Trades:
Taking positions based on a strong view of a country’s economic direction. For example, shorting a country’s bonds if interest rates are expected to rise.
Relative Value Trades:
Exploiting valuation differences between similar assets in different regions, such as trading the spread between U.S. and European government bonds.
Event-Driven Macro Trades:
Profiting from specific events like elections, referendums, central bank decisions, or geopolitical conflicts.
Carry Trades:
Borrowing in a low-interest-rate currency to invest in a high-interest-rate currency, profiting from the interest differential.
Trend Following:
Identifying and riding sustained market trends in currencies, equities, or commodities using quantitative models.
6. Risk Management
Global macro trading is inherently high-risk due to leverage, market volatility, and exposure to geopolitical events. Successful traders rely heavily on risk management techniques, including:
Position Sizing: Allocating capital carefully to avoid catastrophic losses.
Stop Losses and Hedging: Using derivatives or opposing positions to limit downside risk.
Diversification: Spreading investments across asset classes, countries, and instruments to reduce dependency on a single outcome.
Scenario Analysis: Stress-testing portfolios under different macroeconomic conditions to anticipate potential losses.
Proper risk management is essential, as macro events can be unpredictable, and large leveraged positions can amplify both gains and losses.
7. Real-World Examples
George Soros (1992): Shorted the British pound, betting on the UK’s inability to maintain its currency peg under the European Exchange Rate Mechanism.
Stanley Druckenmiller: Known for making large directional trades based on macroeconomic trends in currencies, commodities, and interest rates.
Bridgewater Associates: Founded by Ray Dalio, uses a systematic “Pure Alpha” macro strategy, balancing risk across countries and asset classes.
These examples highlight how macroeconomic insight, combined with strategic execution, can produce extraordinary returns—but also require a deep understanding of markets and disciplined risk control.
8. Advantages and Challenges
Advantages:
Ability to profit in rising and falling markets
Access to a wide array of opportunities globally
Flexibility to adapt to macroeconomic changes
Challenges:
High volatility and potential for large losses
Dependence on accurate economic predictions
Complex strategies requiring significant research, data, and execution skills
9. Conclusion
Global macro trading strategies are a sophisticated, top-down approach to investing, focusing on broad economic and geopolitical trends rather than individual companies. By analyzing interest rates, currencies, equities, bonds, and commodities across countries, macro traders aim to exploit opportunities created by economic imbalances, central bank policies, and political events.
The strategy can be discretionary, relying on human judgment, or systematic, using quantitative models. While it offers high reward potential, it carries significant risk, necessitating strong risk management and diversification practices. Historically, global macro trading has produced some of the most iconic trades in financial history, demonstrating the power of understanding and anticipating global economic trends.
In the modern era, with interconnected global markets, these strategies continue to be relevant, providing investors with a way to capitalize on the ever-changing macroeconomic landscape.

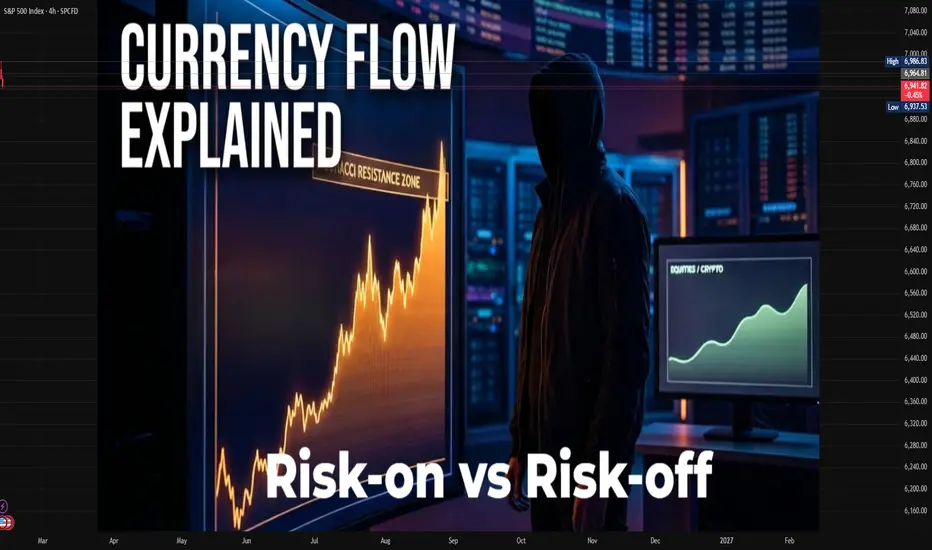
Risk-On vs Risk-Off Currency Flows1. Understanding Risk-On Sentiment
Risk-on sentiment emerges when investors feel confident about global growth, financial stability, and economic prospects. During such periods, investors are willing to move capital into higher-yielding, more volatile assets. In the context of currencies:
High-yield currencies gain favor: Currencies from countries offering higher interest rates tend to appreciate because investors seek better returns. Examples include the Australian dollar (AUD), New Zealand dollar (NZD), and emerging market currencies like the Brazilian real (BRL) or Indonesian rupiah (IDR).
Safe-haven currencies weaken: Traditional safe-haven currencies, such as the US dollar (USD), Japanese yen (JPY), and Swiss franc (CHF), often weaken as investors exit low-yield, low-risk assets in favor of higher returns elsewhere.
Factors fueling risk-on flows:
Strong global economic data (GDP growth, employment figures, manufacturing output)
Rising stock markets
Central bank policies that support growth (e.g., lower interest rates, quantitative easing)
Reduced geopolitical tensions
Currency market behavior during risk-on periods:
The AUD/USD or NZD/USD pairs often appreciate because capital flows into Australia and New Zealand for better yields.
Emerging market currencies strengthen against the USD and JPY as investors chase higher returns.
Commodity-linked currencies, like the Canadian dollar (CAD) or Norwegian krone (NOK), benefit as commodity prices rise with increased global demand.
Example:
During periods of strong global economic growth, like in 2017-2018, risk-on sentiment drove the AUD, NZD, and BRL higher against the USD as investors moved capital into higher-yielding assets and emerging markets.
2. Understanding Risk-Off Sentiment
Risk-off sentiment occurs when investors become cautious or fearful about global economic or financial stability. During these periods, market participants prioritize capital preservation over high returns. This behavior has a profound impact on currency markets:
Safe-haven currencies strengthen: The USD, JPY, and CHF tend to appreciate as investors flock to perceived safety.
Riskier currencies weaken: High-yield currencies, emerging market currencies, and commodity-linked currencies depreciate as capital exits these markets.
Triggers of risk-off sentiment include:
Geopolitical conflicts (e.g., wars, trade tensions)
Financial crises or market crashes
Unexpected economic slowdowns or recessions
Volatility spikes in equity or bond markets
Currency market behavior during risk-off periods:
The USD/JPY pair often falls (JPY appreciates) as investors buy yen for safety.
Emerging market currencies, like the BRL, IDR, or INR, tend to decline against safe-haven currencies.
Commodity-linked currencies, like AUD and CAD, weaken due to falling commodity demand and prices.
Example:
During the 2008 global financial crisis, risk-off flows dominated. Investors fled to USD, JPY, and CHF, causing emerging market and commodity currencies to depreciate sharply.
3. Mechanics of Risk-On and Risk-Off Flows
Currency flows are influenced by how global capital moves between riskier and safer assets. These flows are driven by several mechanisms:
Interest rate differentials:
Investors seek higher yields when risk appetite is high (risk-on) and prefer safety when risk appetite drops (risk-off). The “carry trade” exemplifies this, where investors borrow in low-yield currencies (like JPY) to invest in higher-yielding currencies (like AUD).
Capital flows to equities and bonds:
Risk-on: Investors buy equities, especially in emerging markets, boosting local currencies.
Risk-off: Investors sell equities and bonds in riskier markets and buy safe-haven bonds (like U.S. Treasuries), driving safe-haven currencies higher.
Commodity linkages:
Many currencies are tied to commodities:
AUD, CAD, and NZD benefit from higher commodity prices (risk-on).
Commodity prices fall during risk-off periods, weakening these currencies.
Market psychology and sentiment:
News events, central bank statements, or global crises can trigger immediate shifts between risk-on and risk-off, causing volatile currency movements.
4. Risk-On vs Risk-Off Indicators
Traders use several indicators to gauge global risk sentiment and predict currency flows:
Equity markets: Rising stock markets signal risk-on; falling markets signal risk-off.
Volatility indices (VIX): High volatility indicates risk-off; low volatility indicates risk-on.
Bond yields: Rising yields in safe-haven bonds indicate risk-off buying; falling yields indicate risk-on selling.
Commodity prices: Rising commodities reflect risk-on sentiment; falling prices reflect risk-off.
Currency correlations: Tracking historically correlated pairs can reveal market sentiment.
5. Practical Examples in Currency Pairs
AUD/USD: A barometer of risk appetite. Gains in risk-on environments; falls during risk-off periods.
USD/JPY: A barometer of risk aversion. Falls (JPY strengthens) during risk-off; rises (JPY weakens) during risk-on.
Emerging market currencies: Often highly sensitive to global risk sentiment; small changes in investor confidence can lead to large currency swings.
Case Study:
During the COVID-19 pandemic in March 2020, risk-off sentiment surged. Investors moved trillions of dollars into the USD and JPY, while emerging market currencies and AUD/ NZD fell sharply. Conversely, when vaccine news and stimulus measures revived confidence in late 2020, risk-on flows returned, lifting high-yield currencies.
6. Strategic Implications for Traders
Understanding risk-on and risk-off flows is critical for forex and cross-asset trading:
Carry trades:
Profitable during risk-on when high-yield currencies appreciate.
Risky during risk-off due to sudden unwinding and sharp depreciation of high-yield currencies.
Hedging:
Traders may hedge exposure to emerging markets or commodity currencies during risk-off periods.
Safe-haven currencies can serve as natural hedges.
Diversification:
Holding a mix of risk-on and risk-off correlated assets can reduce portfolio volatility.
7. Long-Term Trends and Risk Sentiment
While daily flows respond to news, long-term trends in risk-on and risk-off flows reflect macroeconomic fundamentals:
Global economic cycles: Expansion phases favor risk-on flows; recessions favor risk-off.
Monetary policy cycles: Loose monetary policies in developed economies often drive risk-on flows; tightening or crises drive risk-off.
Geopolitical stability: Peaceful, stable conditions encourage risk-on; instability triggers risk-off.
8. Key Takeaways
Risk-on: Investors seek higher returns → high-yield and emerging market currencies strengthen; safe-haven currencies weaken.
Risk-off: Investors seek safety → safe-haven currencies strengthen; high-yield and emerging market currencies weaken.
Currency flows are driven by interest rate differentials, equity/bond market movements, commodity prices, and investor sentiment.
Monitoring market indicators like equity indices, VIX, commodity prices, and bond yields is essential for predicting currency behavior.
Strategic implications include carry trade opportunities, hedging against volatility, and portfolio diversification.
In conclusion, risk-on vs risk-off currency flows reflect the tug-of-war between growth-seeking and safety-seeking capital. Forex traders, institutional investors, and macroeconomists closely monitor these flows because they not only influence currency valuations but also reveal broader insights into global risk sentiment, capital allocation, and economic trends. Understanding these dynamics enables more informed trading decisions, portfolio management, and policy analysis.
40% gains in 2-3 yrs - Eicher Motors - Long Term Compounder40% returns in next 2-3 years - Eicher Motors - Long Term Compounder
Fundamental Outlook
Almost debt free D/E ratio is 0.02, High ICR (110)
PE of 31.53, IND PE is 45.12, 0.7X of INdustry PE, expensive stock
PEG of 1.51, reasonable
ROE = 26.24%
ROCE = 32.43% , ROCE 5yrs = 25.16%
Sales growth = 14.12%, Sales Growth 5 yrs =15.57%
Profit growth = 18.3%, Profit Growth 5 yrs = 20.95%
Promoter holding at 49.08%, marginally reducing every quarter
Cumulative FII/DII holding making up for promoter dilution
Very less public holding, continually decresing, signalling strong hand holding
Technical Outlook
CMP : 5446
On Monthly charts ,
Stock has clearly followed a parallel channel since 2019
On Weekly charts ,
Stock is bullish, CMP is above all periodic EMAs
On daily charts
Relative strength and momentum on 20 day time period is lagging. Stock has not moved much in recent days
RS = 97, relatively weak strength compared to Nifty 500
Momentum = 99, relatively weak momentum compared to NIfty 500
RSI = 50 , neither oversold nor overbought , reasonable
Chart Patterns
On Monthly charts ,
Stock has clearly followed a parallel channel since 2019
Industry Outlook
Sector/Industry - Automobiles/2-3 Wheelers
Nifty auto is a leading index compared to other sectoral indices in the past 20 days.
Nifty Auto has formed a W pattern/double bottom in the recent past and is recovering appreciably.
Continuing momentum should take the Index past recovery to bullish phase
Latest Q4 Results
Mar 2025
NSE:EICHERMOT
QOQ
👉Revenue rose 5.39% to 5241
👉EBITDA rose 4.75% to 1258
👉EBITDA Margin drops -0.15% BPS to 24.00%
👉Net Profit rose 16.41% to 1362
👉EPS rose 16.35% to 49.68
YOY
👉Revenue rose 23.14% from 4256
👉EBITDA rose 11.52% from 1128
👉EBITDA Margin drops -2.50% BPS from 26.50%
👉Net Profit rose 27.29% from 1070
👉EPS rose 27.06% from 39.1
Fundamentals
👉Stock Price is 5446.5 as of 5/14/2025
👉Stock PE is 31.53
👉Stock EPS is 172.73
👉Dividend announced of Rs.70 per share
Growth
👉2 year Revenue CAGR is 14.31%
👉2 year Profit CAGR is 27.42%
👉2 year EPS CAGR is 27.32%
👉2 year Price CAGR is 35.90%
Disclosure 1 - Invested
Disclosure 2 - Not SEBI Registered
Disclosure 3 - This is Not investment advice. Treat it as educational

Interest Rate Cycles & Bond Yield Trading1. Understanding Interest Rate Cycles
An interest rate cycle is the recurring pattern of rises and falls in a central bank’s benchmark interest rates over time. These cycles are driven by economic conditions such as inflation, growth, employment, and monetary policy objectives.
Phases of the Interest Rate Cycle
Expansionary Phase (Rate Hikes): When the economy grows too quickly, inflation rises. Central banks (like the Federal Reserve in the U.S.) raise rates to cool down borrowing, spending, and investment.
Peak Phase: This is when rates reach their highest point in the cycle. Economic growth may start slowing, inflation pressures ease, and borrowing costs are at their maximum.
Contractionary Phase (Rate Cuts): In slowing economies or recessions, central banks lower rates to encourage borrowing, spending, and investment. This is the stimulative phase.
Trough Phase: Rates hit their lowest point. The economy starts absorbing liquidity from rate cuts, setting the stage for the next expansionary cycle.
Determinants of Rate Movements
Inflation Expectations: Rising prices prompt rate hikes; falling prices can lead to rate cuts.
Economic Growth: Strong GDP growth may trigger higher rates, while slow growth can cause cuts.
Employment Levels: High unemployment often leads to easier monetary policy.
Global Factors: International interest rates, capital flows, and geopolitical events can influence domestic cycles.
Indicators to Track Interest Rate Cycles
Central Bank Statements & Minutes: Forward guidance often signals rate shifts.
Inflation Measures: CPI, PPI, and Core Inflation trends.
Economic Data: GDP growth, unemployment, retail sales, manufacturing indices.
Market Expectations: Futures markets (e.g., Fed Funds Futures) show predicted rate changes.
2. Bond Yields and Their Relationship with Interest Rates
A bond yield is the return an investor receives on a bond. There is a critical inverse relationship between bond prices and interest rates:
Inverse Relationship
When interest rates rise, existing bond prices fall because newer bonds offer higher yields.
When interest rates fall, existing bond prices rise as their fixed coupons become more valuable.
Types of Bond Yields
Current Yield: Annual coupon divided by current price.
Yield to Maturity (YTM): Expected return if held until maturity, accounting for price changes.
Yield Spread: Difference between yields of different bonds (e.g., corporate vs government) indicating risk appetite.
Yield Curve Dynamics
The yield curve plots yields across maturities (short, medium, long-term bonds). Its shape indicates economic expectations:
Normal Upward-Sloping Curve: Suggests growth; longer-term rates > short-term rates.
Flattening Curve: Signals slowing growth; long-term rates ≈ short-term rates.
Inverted Curve: Often precedes recessions; short-term rates > long-term rates.
3. Trading Bond Yields Based on Interest Rate Cycles
Bond yield trading is essentially anticipating how yields will move with interest rate cycles. Traders can use the following approaches:
Directional Trading
Expecting Rate Hikes: Short-duration bonds are preferred; yields rise, prices fall.
Expecting Rate Cuts: Long-duration bonds gain; yields fall, prices rise.
Yield Curve Strategies
Steepening Trades: Bet that long-term yields rise faster than short-term yields (common in early expansions).
Flattening Trades: Bet that short-term rates rise faster than long-term rates (common near peaks).
Inversion Trades: Profitable in anticipating recessions; short-term yields exceed long-term yields.
Spread Trading
Government vs Corporate Bonds: Wider spreads indicate risk aversion; narrowing spreads indicate higher risk appetite.
Inter-Maturity Spreads: Exploit changes in yield differences across maturities using bond futures.
Interest Rate Derivatives
Futures & Forwards: Predict interest rate moves without buying the underlying bonds.
Options & Swaps: Hedge or speculate on yield changes; e.g., a payer swap profits if rates rise, a receiver swap profits if rates fall.
4. Macro Strategies Linking Cycles and Yields
Rising Rate Environment
Shorten Duration: Bonds with shorter maturities are less sensitive to rate hikes.
Floating Rate Instruments: Beneficial as their coupons adjust with market rates.
Inverse ETFs: Designed to profit when bond prices fall.
Falling Rate Environment
Extend Duration: Long-term bonds benefit from price appreciation.
High-Coupon Bonds: Lock in yields before rates fall further.
Mortgage-Backed Securities: Sensitive to rate drops, can amplify returns.
Neutral or Transitioning Cycle
Barbell Strategy: Combine short-term and long-term bonds to balance risk and opportunity.
Bullet Strategy: Concentrate on bonds maturing around expected rate cuts or hikes.
5. Practical Considerations and Risks
Interest Rate Risk
The core risk: bond prices move inversely with interest rates.
Mitigation: duration management, hedging with derivatives.
Credit Risk
Corporate bond yields may reflect default risk in addition to interest rate changes.
Liquidity Risk
Some bonds, especially longer-term or lower-rated ones, can be hard to trade without affecting prices.
Inflation Risk
Unexpected inflation erodes fixed income returns. Treasury Inflation-Protected Securities (TIPS) can hedge this.
Market Sentiment & Global Events
Geopolitical crises, pandemics, or global central bank coordination can override domestic cycles temporarily.
6. Case Study Example
Early 2020s Scenario:
Post-pandemic, central banks cut rates to near zero.
Long-term government bonds rallied as yields fell sharply.
Traders extended durations and used yield curve steepeners.
As inflation picked up in 2022–23, rate hikes began:
Short-duration bonds and floating rate instruments outperformed.
Yield curve flattened as market anticipated future cuts.
This shows how understanding the cycle and its phase allows tactical bond yield positioning.
7. Key Takeaways
Interest rate cycles dictate the overall environment for bonds.
Bond prices move inversely to yields; duration management is critical.
Yield curves offer insight into economic expectations and future rate moves.
Trading strategies include duration adjustments, curve trades, spread trades, and derivative hedges.
Macro awareness (inflation, GDP, employment, global rates) drives informed yield trading decisions.
Success comes from anticipating cycle phases, not just reacting to them.
In essence, bond yield trading is a disciplined game of timing and positioning around interest rate cycles. Understanding the macroeconomy, central bank policies, and curve dynamics can provide traders and investors with a significant edge, whether for hedging, income generation, or speculative profit.

Growth vs. Value Investing Cycles1. Defining Growth and Value Investing
Growth investing focuses on companies that exhibit strong potential for future earnings growth. These companies often reinvest profits to fuel expansion rather than paying dividends. Investors in growth stocks pay a premium for anticipated high growth, accepting higher valuation ratios such as Price-to-Earnings (P/E) or Price-to-Book (P/B) multiples.
Key characteristics of growth investing:
High earnings growth rate.
Dominant or disruptive industry position.
Often innovative, technology-driven, or new market leaders.
Typically lower or no dividends, reinvesting profits into expansion.
Value investing, in contrast, targets companies whose stock prices are considered undervalued relative to fundamentals. These companies may have slower growth prospects but often trade at a discount due to market overreactions, temporary setbacks, or low investor sentiment. Value investors rely on metrics like P/E ratio, P/B ratio, and dividend yield to identify undervalued opportunities.
Key characteristics of value investing:
Stocks trading below intrinsic value.
Stable, mature companies with predictable earnings.
Often offers dividends.
Typically operates in traditional sectors such as industrials, energy, or consumer staples.
2. The Nature of Investing Cycles
Investment styles, including growth and value, tend to perform in cycles influenced by:
Economic Growth and Recessions:
During periods of strong economic expansion, growth stocks often outperform. Investors are willing to pay high premiums for companies expected to capitalize on increased consumer demand, technological advancement, or market expansion.
Conversely, during economic slowdowns or recessions, value stocks generally perform better. These companies are often financially stable, generate steady cash flow, and provide dividends, appealing to risk-averse investors.
Interest Rate Movements:
Low-interest-rate environments favor growth stocks, as cheaper borrowing costs allow companies to expand aggressively. Investors are more inclined to pay high valuations for future earnings.
High-interest-rate environments penalize growth stocks because future earnings are discounted more heavily. Value stocks, which often rely on tangible assets and stable cash flows, tend to be more resilient in such periods.
Market Sentiment and Risk Appetite:
Bull markets with high investor confidence favor growth investing, as optimism about future prospects drives higher valuations.
Bear markets, uncertainty, or risk aversion shift preferences toward value stocks, as investors seek safer, undervalued assets with downside protection.
3. Historical Growth and Value Cycles
Historically, growth and value investing have alternated in dominance:
1990s – Growth Outperformance:
The late 1990s, marked by the dot-com boom, exemplify a prolonged growth cycle. Technology and internet stocks soared despite weak earnings, driven by investor optimism and disruptive innovation. Value investing lagged, as traditional sectors were less exciting to the market.
Early 2000s – Value Recovery:
Following the dot-com crash (2000–2002), growth stocks plummeted due to overvaluation and lack of profitability. Value stocks, characterized by tangible earnings and dividends, outperformed as markets rotated toward safety and fundamentals.
Mid-2000s – Growth Rebound:
Economic expansion fueled a brief resurgence in growth stocks, particularly in sectors like technology, consumer discretionary, and emerging markets.
2008 Financial Crisis – Value Resilience:
During the 2008 crisis, growth stocks suffered heavily due to uncertainty and high valuations. Value stocks with strong balance sheets and predictable cash flows outperformed as investors sought safety.
Post-2009 – Extended Growth Cycle:
After quantitative easing and low-interest rates post-2009, growth stocks enjoyed an unprecedented bull run, especially in technology and innovation-driven sectors. FAANG stocks (Facebook, Apple, Amazon, Netflix, Google) became emblematic of this era. Value lagged, particularly in traditional industries.
2022–2023 – Value Resurgence:
Rising inflation, higher interest rates, and global uncertainty shifted markets toward value stocks. Traditional sectors like energy, banking, and commodities outperformed high-growth technology stocks, demonstrating the cyclical nature of style investing.
4. Drivers of Growth vs. Value Cycles
The cycles are influenced by multiple interconnected factors:
Macroeconomic Conditions:
Growth thrives in low-rate, expanding economies.
Value prevails in high-rate, slowing, or uncertain economic environments.
Investor Psychology:
Herd mentality amplifies trends. In bullish periods, growth stocks may become overvalued, while in pessimistic periods, value stocks become oversold and attract attention.
Sector Dynamics:
Certain sectors naturally align with styles. Technology, biotech, and consumer discretionary often lead growth cycles. Industrials, utilities, energy, and financials frequently anchor value cycles.
Government Policies:
Fiscal stimulus, tax incentives, and regulatory frameworks can favor growth or value sectors. For instance, tech-friendly policies boost growth stock performance, while energy subsidies or infrastructure spending favor value sectors.
5. Investing Strategy Implications
Understanding these cycles helps investors:
Portfolio Rotation:
Savvy investors may rotate allocations between growth and value depending on economic, interest rate, and sentiment signals. This requires timing insights but can enhance returns.
Diversification:
Maintaining a blend of growth and value investments reduces exposure to extreme swings. During prolonged growth cycles, value cushions downside risk; during value cycles, growth stocks provide upside potential.
Valuation Awareness:
Paying attention to valuation extremes helps anticipate style rotations. Historically, when growth valuations become stretched, value stocks often outperform subsequently.
Long-Term Perspective:
Cycles demonstrate that no style dominates permanently. Investors benefit from patience, understanding that both styles can thrive in different market phases.
6. Key Takeaways on Growth vs. Value Cycles
Growth and value investing alternate in performance due to economic conditions, interest rates, market sentiment, and investor psychology.
Growth stocks perform best during low-interest rates, economic expansion, and high risk appetite periods.
Value stocks shine during high-interest rates, economic slowdowns, or market uncertainty.
Historical cycles, from the 1990s dot-com boom to post-2009 tech dominance and the 2022 value resurgence, illustrate this alternating pattern.
Investors can leverage cycles by portfolio rotation, maintaining diversified allocations, and monitoring valuations.
Recognizing cycles reduces emotional decision-making, enabling disciplined long-term investing.
Both styles offer complementary advantages: growth for capital appreciation, value for downside protection and income.
Conclusion
Growth vs. value investing cycles are a natural and predictable part of market behavior. Neither style is universally superior; each excels under specific macroeconomic and market conditions. Successful investors understand these cycles, position their portfolios accordingly, and maintain a balance between chasing high growth and protecting capital through value investments. Ultimately, recognizing and responding to these cycles can enhance returns, reduce risk, and provide a strategic advantage in navigating the complex world of equity markets.

NTPCNTPC
bullish trend is Showing on the chart.
buy signals in
technical indicators and
descending triangle chart pattern.
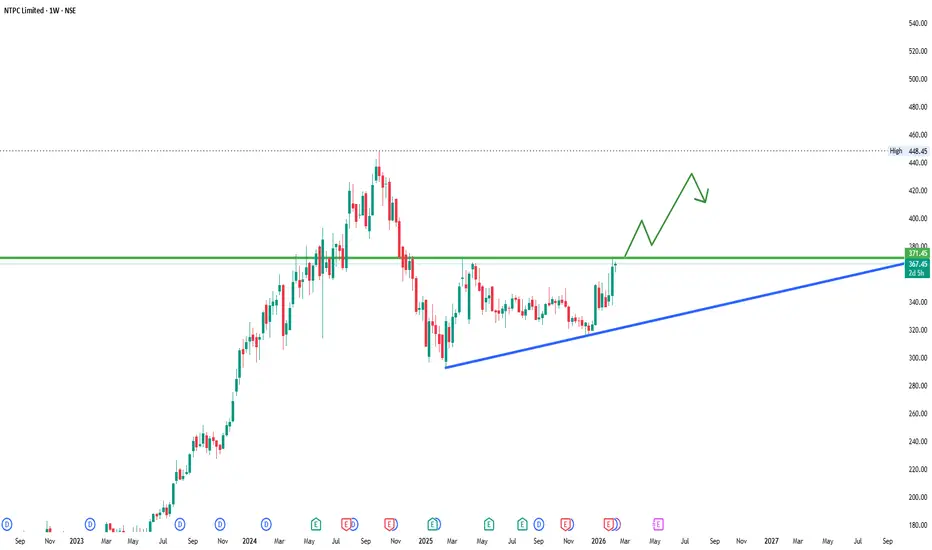
INDIGOINDIGO
bullish trend is Showing on the chart.
buy signals in
technical indicators and
Ascending Channel chart pattern.

$DOGE on the 15mins chart is shaping a potential double bottom CRYPTOCAP:DOGE on the 15mins chart is shaping a potential double bottom around 0.0915–0.0920. After a steady intraday downtrend, price swept the prior low (Bottom 1) and printed a similar reaction at Bottom 2. That tells us buyers are at least attempting to defend this zone.
Momentum is still cautious. The structure inside the highlighted range shows lower highs, meaning bulls need confirmation — not anticipation. A reclaim of the 0.0940 intraday resistance would shift short-term pressure and open the door for a squeeze back toward the top of the range.
If support fails cleanly below 0.0915, the breakdown could accelerate toward the 0.0900 liquidity pocket, where stops likely sit.
Support: 0.0915 / 0.0900
Resistance: 0.0940
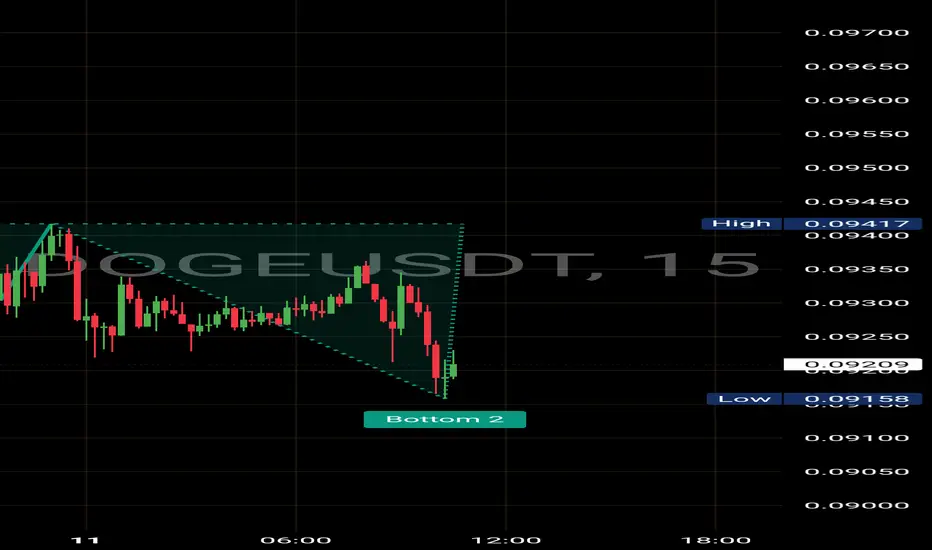
$BNB has officially broken down from the bearish pennant CRYPTOCAP:BNB has officially broken down from the bearish pennant — and price has now tapped the first downside objective.
As discussed, this structure was a continuation pattern, not a reversal. The impulsive leg from ~760 → 580 formed the flagpole, and the compression inside 660–630 built the pennant.
Once price lost 630–625 support with acceptance, acceleration kicked in — exactly as expected.
Now we’re sitting inside the first liquidity pocket (610–600).
If this zone fails to hold, next downside levels remain:
➡️ 585–570 (previous swing low zone)
➡️ 540–520 (full measured move of pennant)
Only a strong reclaim above 660–670 would invalidate this bearish structure.

$ZRO Dropped 84% But What's Coming Next Could Shock Everyone CSE:ZRO Dropped 84% But What's Coming Next Could Shock Everyone 🚀
#ZRO Has Corrected ~84% Inside A Multi-Month Descending Channel Since 2024, Now Testing The HTF Breakout Level.
Price Is Compressing At Channel Resistance With Strong Accumulation Around $1.50–$1.20 👇
✅ Strong HTF Demand: $1.50–$1.20
✅ Breakout Trigger: HTF Close Above Channel $2.50
✅ Structure Turns Bullish On Acceptance Above $2.50
✅ Possible Retracement Before Next Expansion Leg
✅ $1.80 = Good Entry Level 1 If Price Pulls Back
✅ $1.50–$1.20 = Major Accumulation Zone (Best Long-Term Entry)
⚠️ Close Below $1.20 = HTF Structure Weakens
Upside Targets If Breakout Confirms: $6.83 ➔ $13.00 ➔ $25.00 (Full Measured Move ~1,500%+)
Why I’m Bullish Long Term On CSE:ZRO 👇
→ Tether Made A Strategic Investment In LayerZero Labs
→ USDT0 Has Processed $70B+ In Cross-Chain Volume
→ Backed By Citadel, Ark Invest, Google Cloud & DTCC
→ Infrastructure Layer For Cross-Chain Finance + AI Economy
→ Price Already Reacted +35% On Institutional News
HTF Compression + Real Adoption + Institutional Backing = Asymmetric Setup.
Pure TA + Narrative Confluence | Not Financial Advice | Always Do Your Own Research
What's Your Target For CSE:ZRO ? Let Me Know 👇
Like + Share if You Found This Useful!
