BANCOINDIA Testing Powerful Demand Zone + Breakout Retest 🧠 Understanding the Smart Money Footprints 🧠
Demand and supply zones are not just colorful boxes on a chart — they represent the footprints of smart money . When institutions buy, they don’t enter all their orders at once like retail traders do. Instead, they accumulate positions in parts — leaving behind a visible trail that we can identify on charts through price imbalances. These imbalances structures — form demand and supply zones .
When price returns to these zones, it’s essentially revisiting the footprints of big players — the levels where unfilled institutional orders might still exist.
In BANCOINDIA, we can clearly see this institutional footprint. The stock is now trading near a high-quality demand zone . The structure here is clean and powerful — a perfect Rally–Base–Rally (RBR) formation.
The leg-out candle that formed this demand zone had strong follow-through and even broke past the previous all-time high , confirming intense buying pressure. Now that price is revisiting this zone, it’s showing potential for a fresh upside move.
📉 Traditional Technical Lens 📉
Let’s now analyze BANCOINDIA through the classical technical perspective.
The stock had earlier broken a significant resistance level with massive bullish volume . That breakout confirmed strong demand participation. Now, price is retracing back toward that same level — which, according to the Law of Polarity , should act as new support.
Moreover, the 50 EMA is aligning beautifully beneath the price. The ongoing pullback is approaching both the EMA 50 and the previous resistance — a confluence that further strengthens the bullish bias.
If we observe the volume , we can see that the selling volume is drying up compared to the prior rally. This shows a lack of bearish momentum, increasing the probability of a bounce from current levels.
🎯 Confluence & Trading View 🎯
When we combine both lenses — Demand & Supply Zone Analysis and Traditional Technical Analysis — we find strong confluence:
The stock is sitting inside a powerful Rally–Base–Rally Demand Zone .
The previous resistance has now turned into support (Law of Polarity).
The 50 EMA is acting as an additional support layer.
Volume analysis shows selling pressure drying up.
Together, these signals suggest a high-probability reversal zone. If BANCOINDIA respects this area, we could see the next leg of rally begin soon.
However — as all seasoned traders know — no setup is 100% guaranteed. Risk management is your best friend. Always define your stop loss before thinking about your target. Even the strongest setups can fail, and protecting your capital must come first.
Identify your demand zone and entry level precisely.
Place your stop loss logically below the zone.
Aim for a 1:2 or 1:3 risk-to-reward ratio .
Let the market do the work — not emotions.
"In trading, patience and risk control build fortunes — not predictions."
Lastly, Thank you for your support, your likes & comments. Feel free to ask if you have questions. 🚀
📚 This analysis is purely for educational purposes and is not intended as a trading or investment recommendation. I am not a SEBI registered analyst.
Community ideas

Nifty - Weekly analysis Oct 27 to Oct 31The price faced resistance at the 26100 - 26120 zone and fall down. Important support levels are 25600 and 25800. 25500 is a psychological level.
If the price opens flat, buy above 25820 with the stop loss of 25760 for the targets 25860, 25900, 25960, 26020, 26080, 26120 and 26180.
Sell below 25700 with the stop loss of 25760 for the targets 25640, 25600, 25560, 25520, 25480 and 25420.
We are having nearby support levels, namely 25500, 25600, and 25800. The price can change direction and become volatile in that area.
Always do your analysis before taking any trade.
Nifty - Monthly Expiry Analysis Oct 28We had a trending movement in the morning session and consolidation in the afternoon session. Nearby resistance is seen at 26100 - 26120.
Buy above 25940 with the stop loss of 25890 for the targets 25980, 26020, 26080, 26120 and 26160. This scenario will work if the price opens above 25900 and shows bullish strength.
As per the daily chart, the price is bullish.
Sell below 25840 with the stop loss of 25890 for the targets 25800, 25760, 25720, 24680 and 25620. This scenario will work if the price shows a strong bearish sign in the zone 25900 to 26000.
Always do your analysis before taking any trade.

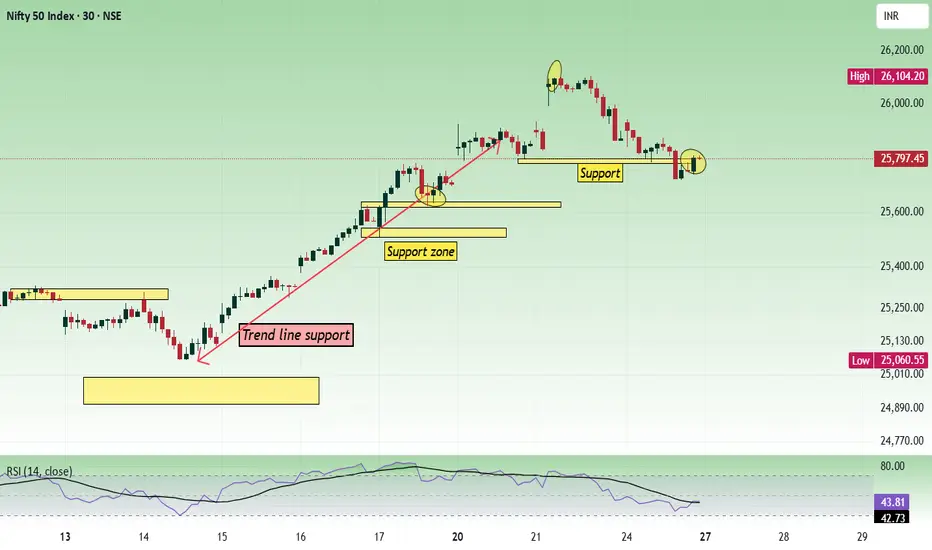
NIFTY : Trading levels and Plan for 27-Oct-2025 (educational)📘 NIFTY TRADING PLAN – 27-Oct-2025
📊 Timeframe: 15-Min | Analysis by LiveTradingBox
📈 Index Close: 25,797.45 (−0.01%)
🧭 Key Reference Levels
🟥 Last Intraday Resistance: 26,020
🟧 Opening Resistance: 25,910
🟨 Opening Support / Resistance Zone: 25,714 – 25,758
🟩 Last Intraday Support Zone: 25,553 – 25,581
🚀 Scenario 1: Gap-Up Opening (100+ Points Above Previous Close)
If Nifty opens near or above 25,900–25,950, it enters the Opening Resistance Zone. This area has repeatedly attracted sellers in the recent sessions. A gap-up may therefore test the patience of both bulls and bears as traders assess whether the move is sustainable or just another reaction to short-covering.
If Nifty sustains above 25,910 for 15–30 minutes with supportive volume, a momentum extension toward 26,020 and potentially 26,150 could unfold.
However, if the index fails to hold above 25,910, profit booking may drag prices back to the 25,758–25,714 zone.
Aggressive buyers should wait for a retest near 25,758 before entering, as this level could provide better risk/reward structure.
Only a sustained break above 26,020 with hourly candle confirmation may invite positional longs aiming toward 26,150+.
🟢 Educational Tip: After strong gap-up openings, avoid chasing the price in the first few candles. Wait for a base-building or retest setup to confirm market intent — remember, the first 15–30 minutes often define the trap zone.
⚖️ Scenario 2: Flat Opening Around 25,780 – 25,820
A flat start around the current closing levels suggests market indecision. The Opening Support Zone (25,714–25,758) will act as the first battlefield between buyers and sellers.
If Nifty holds this zone and crosses above 25,910, a bullish intraday bias could develop, targeting 26,020.
But if the index repeatedly fails near 25,910, expect sideways-to-weak bias, as intraday traders may prefer range setups between 25,750–25,910.
Breakdown below 25,714 with volume confirmation can trigger a short move toward 25,600 and then 25,553 (last support).
Patience is crucial; the best trades form when the market reveals its direction post-opening volatility.
🟠 Educational Insight: Flat openings reflect balance between overnight buyers and sellers. In such cases, structure-based trades — breakouts or breakdowns with volume confirmation — are far superior to speculative entries.
🔻 Scenario 3: Gap-Down Opening (100+ Points Below Previous Close)
If Nifty opens near 25,650–25,600, it steps into the Last Intraday Support Zone (25,553–25,581). This region is critical as it represents the prior demand zone from where intraday recoveries were observed.
Look for reversal signals like bullish engulfing, hammer, or higher low near 25,560 to anticipate short-covering rallies.
A rebound above 25,714–25,758 can confirm a recovery attempt targeting 25,910.
Conversely, a breakdown below 25,553 with heavy volume may lead to deeper selling toward 25,480–25,450 zones.
Avoid impulsive trades immediately at the open; let the first 15-minute candle settle before reacting.
🔴 Educational Note: Gap-downs often trigger emotional trades. Focus on reaction at key supports — a well-timed reversal trade from strong zones can yield high reward with limited risk.
💡 Risk Management Tips for Options Traders
🎯 Stick to defined setups: Trade only near marked zones with clear confirmation.
💰 Position sizing: Risk not more than 2% of your total capital on a single trade.
🛑 Stop Loss Discipline: Always use a strict stop loss based on an hourly close — avoid emotional widening.
⌛ Avoid early entries: The first 30 minutes are for observation, not execution.
📊 Book partial profits: Secure 30–40% gains early and trail stop loss to cost for remaining position.
📆 Avoid overnight option positions: Theta decay and event risks can distort reward potential.
🧩 Summary & Conclusion
Nifty currently trades between two crucial decision zones — 25,553–25,581 (Support) and 26,020 (Resistance).
A breakout above 26,020 may open gates for 26,150, while a breakdown below 25,553 could extend weakness toward 25,450.
The broader sentiment remains neutral-to-bullish as long as Nifty holds above 25,714. The plan should be to trade only confirmed breakouts or retests, ensuring entries align with volume and structure rather than impulse. Remember — discipline and timing are your best tools, not prediction. 🧘♂️
⚠️ Disclaimer:
I am not a SEBI-registered analyst. This analysis is shared purely for educational and informational purposes. Traders are advised to conduct their own research or consult a certified financial advisor before making any investment or trading decisions.

XAU/USD (Gold) chart on the 3-hour timeframe...XAU/USD (Gold) chart on the 3-hour timeframe, I can see my using the Ichimoku Cloud and have marked a range with a potential breakdown area and a target point already indicated on the chart.
Here’s what the chart suggests:
Current price: around 4031 USD
Range low (support): around 4030 USD (which is currently being tested)
Range high (resistance): around 4190–4200 USD
Breakdown target (measured move): around 3940–3950 USD
📉 Analysis:
Price has broken below the range box, indicating a bearish breakout.
The Ichimoku Cloud ahead is bearish and thick, showing potential resistance.
A measured move from the height of the range (≈ 150–170 points) projects downward to around 3940–3950 USD.
My chart already marks 3944.299 as the target point, which aligns well with this projection.
✅ Target Summary
Type Level (USD) Comment
Short-term target 3,944 Measured move target after range breakdown
Extended target 3,900–3,880 Possible continuation if bearish momentum sustains
Invalidated above 4,090–4,100 If price re-enters the range and closes above the cloud

SOL/USDT (1H timeframe)...SOL/USDT (1H timeframe):
Here’s a clear technical breakdown 👇
🧭 Chart Overview:
Current price: around $200.40
Trend: Uptrend, but showing short-term pullback
Support area: $190 – $195
Resistance area: $205 – $210
🔍 Key Observations:
The ascending trendline is acting as dynamic support.
Price recently rejected near the $210 resistance zone and is pulling back toward the trendline and Ichimoku cloud.
The target points marked on my chart suggest downside retracements if support breaks.
---
🎯 Target Levels:
If price stays above the trendline/support → bullish continuation:
Target 1: $207
Target 2: $212
Target 3: $220 (major breakout target)
If price breaks below the trendline/cloud support → bearish correction:
Target 1: $195 (short-term support / first target point)
Target 2: $188 (lower target zone marked on chart)
Target 3: $180 (major downside target if correction deepens)
---
⚠ Summary:
📈 Bullish scenario: Hold above $198 → move to $207–$212.
📉 Bearish scenario: Break below $198 → drop to $195 → $188.

USD/CAD (3H timeframe) chart...USD/CAD (3H timeframe) chart 👇
🧭 Chart Overview:
Current price: ≈ 1.3979
Trend: Bearish breakdown from support and trendline.
Price has cleanly broken below both the ascending trendline and Ichimoku cloud, confirming a downside continuation.
---
🔍 Key Technical Details:
The previous support zone (1.4010–1.4040) has turned into resistance.
Momentum is bearish after retesting that area and rejecting it.
Two target points are clearly marked on my chart.
---
🎯 Target Levels:
If bearish momentum continues 👇
Target 1: 🟢 1.3900 — first major support / first target
Target 2: 🟢 1.3730–1.3750 — second major target zone (full extension of breakdown)
---
⚙ Trade Setup Suggestion:
Entry (Sell): Below 1.3980 (confirmation of continuation)
Stop Loss: Above 1.4045 (above broken support)
Take Profit 1: 1.3900
Take Profit 2: 1.3730
---
⚠ Summary:
📉 Structure = Bearish
🎯 Targets = 1.3900 → 1.3730
🔄 Resistance = 1.4010–1.4040 (sell zone if retested)

Gold 1H – Slight Correction or Bullish Reaccumulation Ahead?XAUUSD – Intraday Trading Plan | by Khang_Trader
📈 Market Context
Gold is currently trading around $4,110/oz as traders digest a mix of macroeconomic signals and shifting expectations surrounding the Federal Reserve’s next moves.
The market focus today centers on U.S. housing-starts and jobless-claims data.
Strong data → could trigger short-term selling pressure on gold.
Weak data → may fuel safe-haven demand, extending the current rally.
Treasury yields remain steady, while dovish rate-cut bets for early 2026 are gaining traction.
Expect liquidity sweeps around session highs/lows before a clear directional move, as institutional traders fine-tune their positioning within the week’s range.
🔎 Technical Analysis (1H / SMC Perspective)
The overall market structure remains bullish, with recent BOS confirming continuation after a prior accumulation phase.
A minor Change of Character (ChoCH) has appeared, signaling a short-term correction — likely a liquidity grab before the next bullish leg.
Liquidity below $4,090-$4,100 has been swept, bringing price into the discount zone near $4,050-$4,080.
A potential re-accumulation zone is forming around that area — buyers should wait for M15/M30 BOS or ChoCH confirmation before entering.
Upside liquidity targets align with the $4,350-$4,380 region — a premium supply zone where sellers may re-enter.
🔴 Sell Setup
Entry: 4378 – 4376
Stop-Loss: 4386
Take-Profit Targets:
1️⃣ 4325
2️⃣ 4260
📌 Only consider this setup if price reaches the supply zone and shows bearish confirmation (BOS/ChoCH on lower timeframe).
🟢 Buy Setup
Entry: 4050 – 4080
Stop-Loss: 4045
Take-Profit Targets:
1️⃣ 4150
2️⃣ 4300
3️⃣ 4350 +
📌 Look for BOS or ChoCH confirmation on M15 before execution. Avoid entering right before U.S. data releases.
⚠️ Risk Management Tips
Avoid trading during high-impact news — spreads can widen and cause slippage.
Scale in/out gradually; take partial profits at liquidity zones.
Once structure confirms continuation, trail stop-loss to lock profits.
A clean break below $4,000 would invalidate the bullish continuation scenario — re-evaluate bias if that happens.
Maintain a clear Risk : Reward ratio (ideally 1 : 3 or better).
✅ Summary
Bias: Bullish as long as price holds above $4,000.
Buy zone: 4050-4080 (watch for confirmation).
Sell zone: 4376-4378 (look for reaction and BOS down).
Key invalidation: Below 4000.
Watch U.S. data this session — it will likely dictate short-term volatility and direction.
FOLLOW RYAN FOR MORE USEFUL TRADING IDEAS!!!

Trading Volume Secrets Finally OutIntroduction: The Hidden Power Behind Market Movements
In the world of financial markets, price is often the first thing traders look at — but it’s not the whole story. Beneath every price chart lies another powerful force: trading volume. While price tells us what is happening, volume reveals why. Understanding trading volume can uncover the true intentions of large institutional players, validate price trends, and expose false breakouts before they trap unsuspecting traders.
For years, professional traders and institutions have quietly used volume analysis as their secret weapon — guiding their decisions on when to buy, sell, or stay out. Today, we reveal those trading volume secrets and explain how you can use them to your advantage.
1. What Is Trading Volume?
Trading volume represents the total number of shares, contracts, or units traded in a given period. In simple terms, it measures market activity and participation.
For example, if 10 million shares of a stock are exchanged in one day, its trading volume for that day is 10 million. High volume often means strong investor interest, while low volume reflects uncertainty or lack of conviction.
But beyond raw numbers, volume tells a deeper story — it shows how committed traders are to a price move. A rally with low volume is like a building on weak foundations; it may not stand for long. Conversely, a price move backed by heavy volume indicates strength and sustainability.
2. Why Volume Is the “Truth Teller” of the Market
Volume is often called the fuel of the market because price cannot move significantly without participation. Large institutions such as mutual funds, hedge funds, and banks execute trades in high volume, and their footprints appear in the volume data.
Let’s break down why volume is considered the ultimate confirmation tool:
Price without volume is illusion: If prices rise but volume stays low, it usually signals a temporary move — often driven by retail traders or short covering.
Volume precedes price: Many times, spikes in volume appear before a major trend reversal. Smart money often accumulates (buys quietly) or distributes (sells gradually) before the market reacts.
Volume confirms strength: Strong uptrends are characterized by increasing volume on rallies and decreasing volume on pullbacks. Weak trends show the opposite.
In essence, while prices can be manipulated in the short term, volume reveals the conviction behind the move.
3. The Hidden Patterns of Volume
Let’s explore the patterns and clues traders can extract from volume behavior:
a. Rising Volume with Rising Price
This is the hallmark of a strong bullish trend. When prices climb and volume increases simultaneously, it indicates growing confidence among buyers. Institutions are entering positions, and retail traders often follow later.
b. Falling Volume with Rising Price
This is a warning sign. It suggests that the rally may be losing momentum, with fewer participants supporting higher prices. Such moves are often followed by corrections.
c. Rising Volume with Falling Price
When volume expands as prices fall, it signals strong selling pressure — possibly from large investors exiting. This pattern often appears before or during a bearish trend.
d. Falling Volume with Falling Price
This pattern indicates a weakening downtrend. Sellers are losing interest, and a reversal could be near.
e. Volume Spikes
Sudden, unusually high volume often marks key turning points. For example, after a long decline, a massive surge in volume might signal capitulation — the moment when panic selling exhausts itself and a reversal begins.
4. The Volume–Price Relationship
One of the most powerful ways to read markets is through Volume Price Analysis (VPA) — a method popularized by legendary trader Richard Wyckoff. The concept is simple but profound:
“Price shows you the move. Volume shows you the intention.”
In VPA, traders analyze how price bars and volume bars interact to spot accumulation (buying) and distribution (selling) phases.
Key Scenarios:
Wide range up bar with high volume: Strong buying interest — bullish confirmation.
Wide range up bar with ultra-high volume but small price progress: Indicates potential selling into strength (distribution by smart money).
Narrow range down bar with high volume: Could signal absorption — buyers quietly accumulating as weak holders sell.
Narrow range bar with low volume: Market is quiet; often a precursor to a breakout or breakdown.
5. The Smart Money Volume Trap
One of the biggest volume secrets lies in understanding institutional behavior. Big players cannot simply buy or sell millions of shares at once without moving the market against themselves. Instead, they use volume manipulation tactics:
Accumulation Phase
Institutions quietly buy from retail sellers at lower prices.
Volume gradually increases but prices stay range-bound.
Fake breakdowns may occur to scare retail traders into selling.
Markup Phase
After accumulating enough, institutions push prices higher.
Volume rises sharply as retail traders jump in — too late.
The trend appears “obvious” now, but smart money is already positioned.
Distribution Phase
Prices stay high, but volume remains elevated.
Institutions offload their holdings to late entrants.
Once selling pressure exceeds buying demand, the trend reverses.
Markdown Phase
The market declines sharply as retail panic sets in.
Volume spikes again — institutions may start re-accumulating at lower levels.
Recognizing these volume cycles can help traders follow the smart money instead of fighting it.
6. Volume Indicators and Tools
Several technical indicators help traders interpret volume more effectively. Here are the most valuable ones:
a. On-Balance Volume (OBV)
Developed by Joseph Granville, OBV adds volume on up days and subtracts it on down days. It helps confirm trends:
If OBV rises while price rises → bullish confirmation.
If OBV falls while price rises → bearish divergence (possible reversal).
b. Volume Moving Average
A moving average of volume smooths out fluctuations, showing long-term participation trends. If current volume exceeds the average, a significant move may be starting.
c. Volume-Weighted Average Price (VWAP)
VWAP is the average price weighted by volume over a specific period. Institutional traders use it to gauge fair value and execute large orders without distorting the market.
d. Accumulation/Distribution Line (A/D)
This indicator measures the relationship between price and volume to determine whether a stock is being accumulated (bought) or distributed (sold).
e. Chaikin Money Flow (CMF)
CMF combines price and volume to assess buying and selling pressure. A positive CMF suggests accumulation, while a negative value signals distribution.
7. Volume and Breakouts: Separating Truth from Traps
Breakouts are among the most profitable — and most dangerous — trading setups. The secret to identifying genuine breakouts lies in volume:
True breakout: Strong volume confirms that many participants are involved, supporting the move.
False breakout: Low or declining volume suggests a lack of conviction, often leading to a quick reversal.
A simple rule:
No volume, no trust.
Before entering a breakout trade, always check if the breakout candle is backed by higher-than-average volume.
8. Using Volume in Different Markets
Volume analysis is not limited to stocks — it’s powerful across multiple asset classes:
a. Stock Market
Volume confirms institutional participation, validates price patterns (like head-and-shoulders or triangles), and signals breakouts.
b. Forex Market
While spot forex lacks centralized volume data, traders use tick volume (number of price changes) as a proxy. It closely mirrors real volume trends.
c. Futures and Commodities
Volume helps identify contract rollovers, open interest changes, and institutional positioning in commodities like oil, gold, or wheat.
d. Cryptocurrency Market
Crypto volume data is transparent and real-time. Tracking exchange volume and blockchain transaction volume can reveal whale (large holder) activity.
9. Volume Divergence: The Secret Reversal Signal
Volume divergence occurs when price moves in one direction, but volume does not confirm it. This often signals an upcoming reversal.
Example:
Price keeps making new highs, but volume is shrinking → buyers are losing strength.
Price falls to new lows, but volume declines → selling pressure is fading.
Such divergences often precede significant turning points — a key secret used by experienced traders.
10. How to Use Volume in Your Trading Strategy
Here’s a practical framework to integrate volume into your trading decisions:
Identify the trend direction using price action or moving averages.
Confirm trend strength by checking if volume supports the move.
Spot accumulation or distribution zones by observing volume spikes in sideways ranges.
Validate breakouts or breakdowns using volume surges.
Watch for divergence between price and volume to anticipate reversals.
Use volume indicators like OBV or VWAP to add confirmation.
Avoid low-volume environments, as they often lead to false signals and poor liquidity.
11. Psychological Secrets Hidden in Volume
Volume is not just a technical metric — it reflects trader psychology. Every spike in volume represents emotional intensity — fear, greed, or panic. Understanding this psychology can give traders an edge:
High volume at peaks: Euphoria and greed dominate; retail traders rush in.
High volume at bottoms: Panic selling and capitulation occur; smart money steps in.
Steady volume rise: Confidence builds gradually — a healthy trend.
Volume drop: Uncertainty, hesitation, or lack of interest.
Reading volume is like listening to the market’s heartbeat. It tells you when enthusiasm grows, when fear spreads, and when calm returns.
12. Common Mistakes in Volume Analysis
Even though volume is powerful, traders often misuse it. Avoid these pitfalls:
Ignoring context — volume must always be read alongside price action.
Comparing volume across different assets — what’s high for one stock may be low for another.
Focusing only on daily volume — intraday and weekly patterns provide richer insights.
Assuming every spike means reversal — sometimes it’s just news-driven volatility.
13. The Future of Volume Analysis
With algorithmic and high-frequency trading dominating modern markets, volume analysis is evolving. Artificial intelligence tools now analyze not just how much volume trades, but who is trading it — institutions, retail investors, or algorithms.
Smart traders use volume profile tools to study how volume is distributed across price levels, identifying zones of high interest called value areas. These act as support and resistance levels far stronger than those based on price alone.
Conclusion
Trading volume is far more than a simple statistic — it’s the hidden force that drives markets. It reflects participation, conviction, and emotion, providing traders with vital clues that price alone cannot offer.
By mastering volume analysis, traders can see beneath the surface of price movements — spotting accumulation before rallies, distribution before crashes, and false breakouts before they trap the crowd.
In essence, volume is the truth teller of the market. When price and volume move together, trends thrive. When they diverge, caution is warranted. Understanding these volume secrets transforms ordinary chart reading into professional market analysis — the same skill that separates the pros from the amateurs.

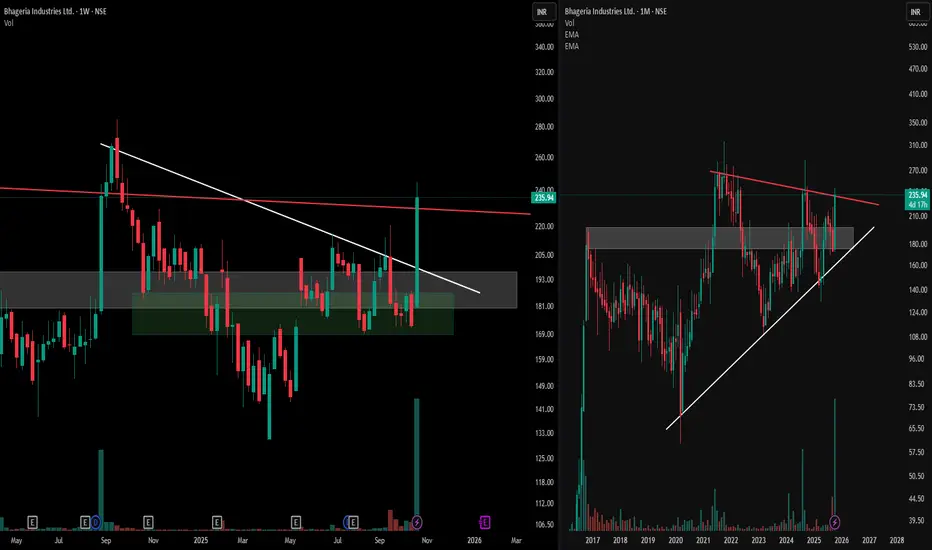
Mastering MTFA Charts : Symmetrical & Descending PatternsObserve the synergy of multiple time frames with this detailed analysis of Bhageria Industries Ltd.
Target Points -
1) The right panel displays a monthly chart, highlighting a broad symmetrical triangle formation within a prominent supply-demand zone—notice how the structure showcases the interplay of lower highs and higher lows, reflecting a period of equilibrium and market compression.
2) The left panel brings the focus to the weekly time frame, where a descending triangle pattern unfolds, providing additional insight into the ongoing price structure.
3) This multi-time frame approach emphasizes how patterns from broader time frames interact with shorter-term consolidations, enhancing our ability to spot critical decision areas on the charts.
4) Using both the monthly and weekly perspectives together, traders and learners can deepen their understanding of structural price action, pattern development, and the relevance of context provided by supply and demand zones. Dissecting these formations side by side promotes disciplined, informed chart reading without bias towards anticipating outcomes.
This analysis is for educational purposes only and does not constitute financial advice.
24 Oct 2025 - Happy Diwali Uptrend coming to an end? PostMortem Nifty Stance Bullish 🐂
Nifty has been in a bullish stance since the 3rd of October 2025, and we have amassed total gains of 960pts so far. If you have not made money this month, there is something wrong with your strategy, because this was the easiest month in the last 3 or 4 years to make money. The reason is that we have had an unchecked, one-way journey with nil reversal or choppiness.
If you were an option seller, you might have lost money, as the implied volatility (VIX) was at its all-time low, and the quick surge in the underlying (Nifty) would have taken out your stop losses. If you had not covered your shorts, your losses would have widened. As the count of speculators has gone down, it's hard to guess it from X, as very few people are sharing P&L screenshots these days.
Coming back to our EMA crossover strategy, we are looking at 960+ points of unrealized gains. At one point, the gains exceeded 1,250+, all thanks to Trump's tweets indicating that Indian tariffs may be reduced to 15% from the current 50%. Our technical analysis is no match for his tweets, and the only way to protect ourselves is to use a fully hedged credit/debit spread instead of naked longs or shorts.
From the chart, you can see that the faster EMA (orange line) is dipping and could cross the blue line on Monday if we maintain a narrow ATR of 100 points or keep falling. We have the monthly expiry coming Tuesday, and it could be a flatter expiry, as we have already moved a lot on price in this series. If we fall on Tuesday, I would be very excited to play the Sensex expiry on Thursday as well.
The support levels for Nifty are 25681, 25219, and 25003 (hoping we don't fall that much). The resistance is faint at 25906, breaching which could take us to the ATHs soon.
---
If you liked this article, consider sharing it with someone who could benefit from this.

NIFTY Analysis 27 october 2025 ,Daily Morning update at 9 amNifty may open near 25866 and move sideways above12ema
Buy above 25880 , Targets 25902 and25945
Sell below 25756, Targets 25700 and 25643

Ujjiwan heading Towards 112.50Ujjivan having chart patterns HNS, cup and Handle, Pole and flag with Harmonics in action..

Head & Shoulder completes in Ultratech Cement Ltd.A head and shoulder pattern is finished in Ultracemco, and on the breach of the neckline, the short trading setup will be triggered.
All the targets are marked on the chart.
Only if this breaches the selling level marked (11876), it will be validated. Otherwise, it will test the height of the right shoulder again, creating a new wedge pattern.

Decent setup. Double top been retested with double bottom as well RSI syncing with price.
550 & 900 with Stop 320 intraday and 300 MCB.
Next review @ 850+

HYPER-LIQUID COIN – Rebound from Key FlipZone | 3D AnalysisAfter an extended correction, HYPE has reacted strongly from the major demand zone between $30–$35, which previously acted as the breakout base earlier this year.
The recent bullish candle shows clear demand absorption and a possible shift in momentum back to the upside.
Technical Highlights:
• 📊 Demand Zone: $30–$35 — tested and respected
• 📈 Structure: Higher timeframe bullish market structure still intact
• 🧭 Short-term EMAs: Price reclaiming both 9EMA and 21EMA on 3D
• 💪 RSI: Recovering from mid-range, signaling renewed strength
• 🎯 Targets:
• TP1: $62.8 (intermediate resistance)
• TP2: $75 (major swing target)
• ❌ Invalidation: Daily/3D close below $30
If price continues to hold above the midrange and the EMAs flip supportive, the next leg of the uptrend could unfold toward the $70+ zone.
Bias: Bullish continuation as long as $30 holds
Timeframe: 6 to 9 months

Silver as said on Friday until 50$ not break sell on rise only As said on Friday sell on rise until 50$ break , still sell on rise avoid buying at current price 45.50 to 44$ possible
How My Harmonic pattern projection Indicator work is explained below :
Recent High or Low :
D-0% is our recent low or high
Profit booking zone ( Early / Risky entry) : D 13.2% -D 16.1 % is
range if break them profit booking start on uptrend or downtrend but only profit booking, trend not changed
SL reversal zone (Safe entry ) : SL 23.1% and SL 25.5% is reversal zone if break then trend reverse and we can take reverse trade
Target : T1, T2, T3, T4 and .
Are our Target zone
Any Upside or downside level will activate only if break 1st level then 2nd will be active if break 2nd then 3rd will be active.
Total we have 7 important level which are support and resistance area
Until , 16% not break uptrend will continue if break then profit booking will start.
If break 25% then fresh downtrend will start then T1, T2,T3 will activate
1,3,5,10,15,20 minutes are short term levels.
30 minutes 60 minutes , 2 hours,3 hours, ... 1 day and 1 week chart positional and long term levels

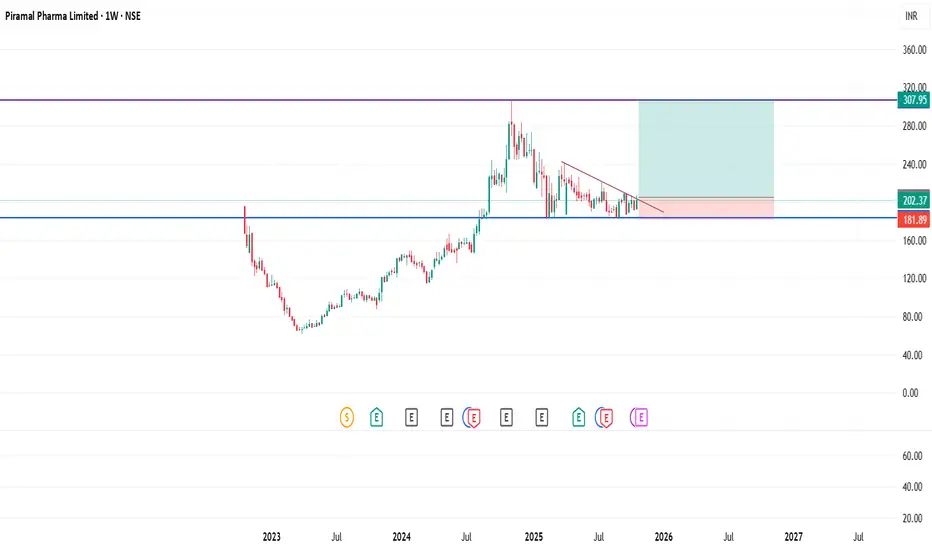
PPLPHARMA Investment opportunityPure Price action:
After strong rally from bottom levels, piramal pharma has retraced and taking support on previous resistance (first horizontal line), As per textbook price action stock may target second horizontal line which is 50% from the current levels.
good levels for long term inverstors.
Bank of India - Pick of the Year 2025🏦 Bank of India – Pick of the Year 2025
Chart Type: 3-Month (Long-Term View)
CMP: ₹133.90
Ultimate Target: ₹517.45
Support Zone: ₹105–₹115
📊 Technical Outlook:
BANKINDIA is showing a massive long-term bottom formation after nearly a decade of consolidation.
A clear MACD bullish crossover on the quarterly chart confirms multi-year trend reversal.
Volume expansion in the last few quarters shows strong institutional accumulation.
RSI turning upward from the mid-zone supports continuation of bullish momentum.
Once ₹150–₹160 zone is crossed, the stock can enter a major re-rating phase with a multi-year breakout setup.
🎯 Trade Plan (Positional Investors)
Action Level Comment
Accumulation Zone ₹120–₹140 Ideal range for long-term entry
Stoploss (Long Term) ₹95 (Quarterly Close Basis) Below long-term base
Target 1 ₹210 First resistance zone
Target 2 ₹310 Major breakout level
Target 3 ₹517 (Ultimate Target) Long-term cycle completion
⚙️ Setup Type:
✅ Investment / Multi-Year Positional
⏰ Holding Period: 2–3 Years
📈 Risk–Reward: ~1:5
🔮 Arthavidhi View:
Bank of India is turning into a multi-year trend reversal story similar to its 2003–2007 bull phase. The structure, volume, and MACD pattern resemble early-stage cyclical upturns.
If ₹150+ sustains, it could trigger a secular rally toward ₹517 over the next few years.
💎 Pick of the Year – 2025

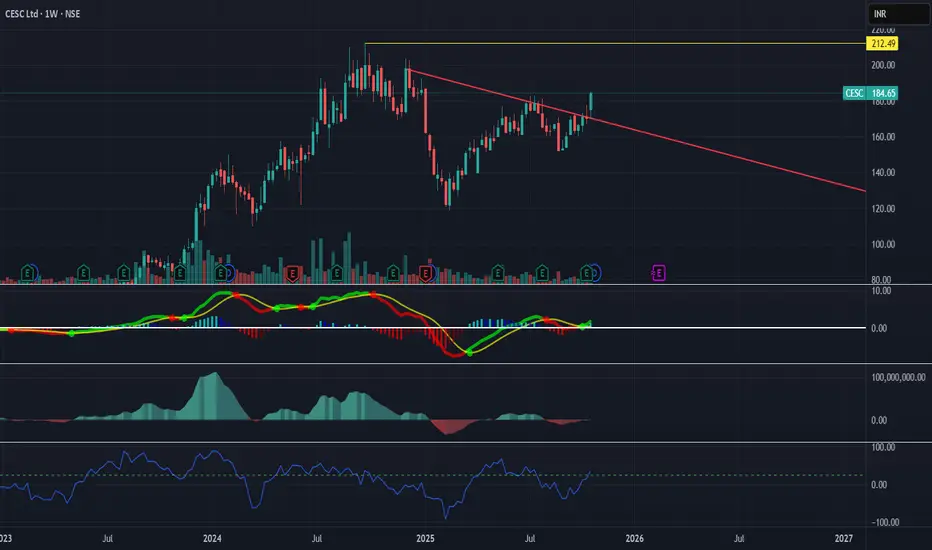
CESC - Chart of the Week⚡ CESC LTD – Trendline Breakout on Weekly Chart
Chart Type: Weekly (1W)
CMP: ₹184.65
Breakout Zone: ₹180–₹185
Next Target: ₹212
Support Zone: ₹165–₹170
📊 Technical View:
CESC has broken out of a long-term falling trendline with strong bullish candles and volume pickup.
MACD bullish crossover confirms trend reversal momentum.
RSI turning upward from mid-level supports renewed strength.
Sustained close above ₹185 will confirm a structural breakout after long consolidation.
🎯 Trade Plan
Action Level Comment
Entry ₹185–₹188 On weekly close above ₹185
Stoploss ₹165 Below recent swing low
Target 1 ₹200 First resistance zone
Target 2 ₹212 Positional target
Target 3 ₹235+ If momentum sustains
⚙️ Setup Type:
✅ Positional / Swing Trade
⏰ Holding Period: 4–6 Weeks
📈 Risk–Reward: ~1:2
🔮 Arthavidhi View:
CESC has ended its downtrend and is entering a new bullish phase with confirmation from MACD and RSI. Power sector momentum may further fuel this move toward ₹212+. Watch weekly close above ₹185 for confirmation
Policy Bazaar Cmp 1686 Double bottom @ support LinePolicy Bazaar Cmp 1686 dated 24-10-2025
1. Double bottom @ support Line
2. Price Rise with Volume
Buy above 1690 SL 1630 target 1705-1720-1735-
1755-1770-1780-1790-1805
It is just a view, please trade at your own risk.

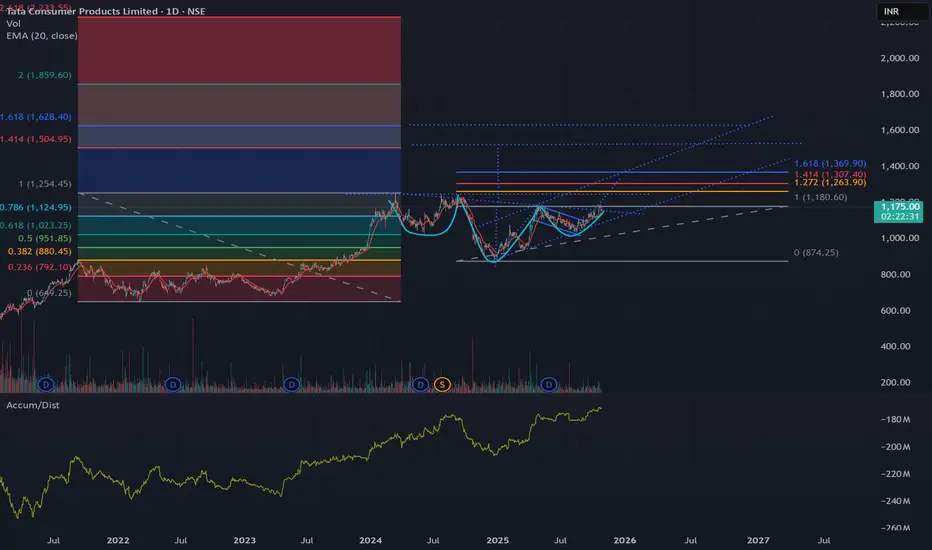
Tata Consumer to the range of 1350 to 1500Based on multiple chart patterns ABCD harmonics, Fibonacci, IH&S the stock can easily touch 1350 quickly and 1500 in near term.
Need to see the fundamentals to support the price as the stock price may fall after the results due to coffee and tea price shoot up and margin contraction.
Ujjivan on BreakoutBanking Sector on ATH
Ujjivan bank on Weekly Breakout
Heading For:
Short Term ABCD 63.05
Long Term ABCD 82.84
