Nifty 50 ZONE post tradeIntraday trends showed clear directional moves; discipline and level-based entries would have worked best.
💡 Takeaway:
Always trade with risk management — zones are guides, not guarantees.
Patience + discipline beats chasing setups
Community ideas

Nifty Intraday Analysis for 16th February 2026NSE:NIFTY
Index has resistance near 25675 – 25725 range and if index crosses and sustains above this level then may reach near 26925 – 25975 range.
Nifty has immediate support near 25275 – 25225 range and if this support is broken then index may tank near 25025 – 24975 range.
Upside momentum is capped by mounting geopolitical tensions in the Middle East and ongoing AI disruption. Any positive opening is expected to be met with selling pressure.

Banknifty Intraday Analysis for 16th February 2026NSE:BANKNIFTY
Index has resistance near 60600 – 60700 range and if index crosses and sustains above this level then may reach near 61100 – 61200 range.
Banknifty has immediate support near 59800 - 59700 range and if this support is broken then index may tank near 59300 - 59200 range.
Upside momentum is capped by mounting geopolitical tensions in the Middle East and ongoing AI disruption. Any positive opening is expected to be met with selling pressure.

Weekly Wrap : #Nifty50 Markets Set for a Comeback?The first step of a successful trader is to build a Trade plan & review what he has done. (educational purpose for all )
*Trend is up.
*Trade plan: Buy on Dip
* Critical Levels:
* Resistance:25800/26000
* Support: 25500/25600
Jai Hind.
Disclaimer :
This video is only for educational purposes. Please consult your financial advisor before you take any trade.

Finnifty Intraday Analysis for 16th February 2026 NSE:CNXFINANCE
Index has resistance near 28300 - 28350 range and if index crosses and sustains above this level then may reach near 28575 - 28625 range.
Finnifty has immediate support near 27900 – 27850 range and if this support is broken then index may tank near 27625 – 27575 range.
Upside momentum is capped by mounting geopolitical tensions in the Middle East and ongoing AI disruption. Any positive opening is expected to be met with selling pressure.

Midnifty Intraday Analysis for 16th February 2026NSE:NIFTY_MID_SELECT
Index has immediate resistance near 13750 – 13775 range and if index crosses and sustains above this level then may reach 13900 – 13925 range.
Midnifty has immediate support near 13500 – 13475 range and if this support is broken then index may tank near 13350 – 13325 range.
Upside momentum is capped by mounting geopolitical tensions in the Middle East and ongoing AI disruption. Any positive opening is expected to be met with selling pressure.

Weekly Analysis with buy/Sell scenarios in BTC👋👋👋 Friends, What's your view on BTC???
Last week, Bitcoin (BTC) traded with high volatility and a corrective bias, briefly dropping toward the critical $60,000 support zone before staging a sharp rebound toward $68,000–$70,000, but failing to sustain above $70K and closing the week slightly negative; the decline was driven by profit booking and long liquidation, leading to a sharp drawdown of nearly 15–20% at one stage, indicating leveraged positions being flushed out. Key developments included cooling momentum in spot Bitcoin ETF inflows, signaling reduced institutional buying, along with macro uncertainty around US inflation and interest rate expectations, which pressured risk assets, while capital rotation toward safe havens like gold further impacted sentiment. Additionally, declining trading volumes and increased hedging activity reflected cautious participation and lack of strong bullish conviction.
Structurally, BTC remains in a range between $60K–$70K, with lower highs indicating supply on rallies. For the coming week, two key scenarios emerge: bullish case – a sustained move above $70K–$72K can trigger short covering and push BTC toward $75K+; bearish case – failure to reclaim $70K may lead to a retest of $60K support, and a breakdown below this level could accelerate downside toward $55K–$58K. Overall, BTC remains range-bound with downside risk, and the next move will largely depend on macro data, ETF flows, and overall risk sentiment.
Critical Points
1. Price is ranging between ~$60K-~$70K.
2. Pressure is clear downside and we can expect some moves between the identified range.
3. We should expect any big movement out of this range only.
4. Price may approach POI identified in last week once lower zone is broken with volume and sustained below it.
5. Price may consolidate at this level and form MSS at this POI and possibly reverse for further highs.
6. Most probably price will take liquidity of FVG/RDRB level and create MSS/CISD/TS/iFVG in LTF.
7. Price should show rejection/reversal in respective LTF (4H/1H) at Key Level/FVG zone.
8. Take the trade only once clear entry model i.e. turtle soup. iFVG break, CDS or MSS happens on LTF
All these combinations are signalling a high probability and high reward trade scenario.
Note – if you liked this analysis, please boost the idea so that other can also get benefit of it.
Also follow me for notification for incoming ideas.
Also Feel free to comment if you have any input to share.
Disclaimer: This analysis is for educational purposes only and does not constitute investment advice. Please do your own research (DYOR) and check with your financial advisor before making any trading decisions.

Will Bitcoin Recover or continue to perishBTC/USD Analysis (Weekly Chart)
- Bitcoin's primary trend is bullish, although on a weekly chart, the prices, which were trending with a rising wedge, gave a bearish breakout.
- However, the prices are retracing higher after testing the lower order block (black zone).
- Currently, prices are resting within a stronger order block (blue zone), and prices are now expected to rise above the order block (69500)
- The RSI is also making a hidden bullish divergence, confirming that bulls are gaining strength.
- The prices might rise towards 83800, with an immediate hurdle near the psychological 75000 level

Tata Steel_Day Time frame Trend & Structure
The chart shows a rounded bottom (cup formation), indicating a shift from a downtrend to a potential bullish reversal.
Price has gradually moved up from the December lows, suggesting accumulation.
Breakout Zone
A key resistance zone around ₹187–189 is visible.
Price has broken above this zone with a strong bullish candle, signaling improving momentum.
If price sustains above this level, the breakout may hold.
Momentum
Recent candles reflect strong buying interest and higher highs–higher lows.
Momentum remains positive as long as price stays above the breakout area.
Key Levels
Support: ₹187–185 (breakout retest zone), then ₹178–180
Resistance / Targets: ₹195 followed by ₹200 (psychological level)
Outlook
Sustaining above ₹187 keeps the bias bullish.
A failure to hold above this level may lead to consolidation or a pullback.
⚠️ Disclaimer
This chart analysis is for educational and informational purposes only and does not constitute investment or trading advice.
Stock market investments are subject to market risk.
Past performance is not indicative of future results.
Please consult a SEBI-registered financial advisor before making any investment decisions.

Weekly chart of Aster DM Healthcare Ltd (NSE)Fibonacci Insight (Approx.)
38.2% retracement ≈ ₹560
50% retracement ≈ ₹520
Price bounced between 38.2%–50%, which is ideal for trend continuation in strong stocks.
📌 Disclaimer : Educational purpose only. Not a SEBI registered analyst. Not a buy/sell recommendation.

Nifty 15m – Follow-Up on Previously Shared Reference LevelsThe liquidity levels shared in the previous session continue to guide price action.
Price reacted and consolidated around these zones, confirming their importance.
Both upside and downside moves have respected these reference areas.
Sustained acceptance above the current balance may support continuation toward higher targets.
Failure to hold could invite a move back into lower liquidity zones.
These levels remain active — plan intraday trades with structure, confirmation, and risk control.

Nifty50 analysis(16/2/2026).CPR: NARROW +descending cpr: trending.
FII: -7,395.41 sold.
DII: 5553.96 bought.
Highest OI:
CALL OI: 25500 and 25600
PUT OI: 25000
Resistance: - 25600
Support : - weak support only
conclusion:.
My pov:
1.market clearly in a down trend, every timeframe shows bearish only, fii sold huge, dii bought stable the market.
2. 25300 to 25200 is the price action support if it broken , market next target is 25000, recent low is will then next
3.every lower highs will be observed by bearish, until market stabilize.
What IF:
if 25600 c&c in day candle then market is in consolidation.
target is 25300 and 25000.
NOTE:
1.if want to know or trial the trend keep 8ma as stoploss until price cross 8ma.
psychology fact:
The hard, cold reality of trading is that every trade has an uncertain outcome.-Mark douglas
notes:
8moving average ling is blue colour.
20moving average line is green colour
50moving average line is red colour.
200moving average line is black colour.
cpr is for trend analysis.
MA line is for support and resistance.
Disclaimer:
I'm not Sebi registered so i started this as a hobby, please do your own analysis, any profit/loss you gained is not my concern. I can be wrong please do not take it seriously thank you.

Axis Bank | Gann Square of 9 Intraday Observation | 18 August 20Disclaimer:
This analysis is for educational purposes only. I am not a SEBI-registered advisor. This is not financial advice.
Symbol: AXISBANK (NSE)
Date Observed: 18 August 2023
Time Frame: 15-Minute Chart
Study Used: Gann Square of 9 (Normal Price Capacity)
This idea shares a historical intraday observation where Axis Bank’s price movement stayed within a normal Square of 9 price range, followed by a visible reaction after price–time alignment.
📊 Market Context & Reference Selection
During the session, price showed gradual upward movement starting later in the morning.
In upward conditions, the low of the reference candle (~931) was treated as the 0-degree level, following commonly used Gann principles.
From this reference, the Square of 9 was applied to observe expected intraday price expansion.
This process focuses on structure and measurement, not forecasting.
🔢 Square of 9 Levels Observed
Based on the selected reference:
0 Degree: ~931
45 Degree (Observed Normal Upside Capacity): ~946
The 45-degree level is monitored as a potential reaction zone when reached early in the session.
⏱️ Observed Price–Time Behavior
Price moved upward from the reference area and interacted with the 45-degree zone around 10:30 AM.
This interaction occurred well before typical intraday time thresholds.
After reaching this zone, the market showed temporary selling pressure.
Similar reactions have been historically observed when normal intraday capacity is completed early.
The entire session’s range remained within this capacity, reflecting balanced price behavior.
📘 Educational Takeaways
Importance of selecting a valid 0-degree reference
Measuring normal intraday price range using Square of 9
Observing time alignment along with price levels
Recognizing reaction zones rather than fixed turning points
Maintaining a disciplined, rule-based analytical approach
This example illustrates how price-time tools can be used to interpret intraday behavior objectively.
📌 Shared strictly for educational and historical chart-study purposes.
#AxisBank #GannSquareOf9 #WDGann #IntradayAnalysis #MarketEducation #PriceTime #TechnicalAnalysis #RuleBasedStudy

Axis Bank | Gann Square of 9 Intraday Observation | 28 June 2023Disclaimer:
This analysis is for educational purposes only. I am not a SEBI-registered advisor. This is not financial advice.
Symbol: AXISBANK (NSE)
Date Observed: 28 June 2023
Time Frame: 15-Minute Chart
Method: Gann Square of 9 (Normal Price Capacity Study)
This idea presents a historical intraday observation where Axis Bank’s price action aligned with a normal Square of 9 upside capacity level, followed by a visible reaction once price and time came into balance.
📊 Market Context & Reference Selection
During the session, Axis Bank showed upward momentum starting after the early candles.
In rising conditions, the low of the reference candle (~967) was treated as the 0-degree level, following commonly used Gann principles.
This reference was used to study the stock’s expected intraday price expansion, based on historical behavior.
The focus remains on measurement and observation, not prediction.
🔢 Square of 9 Level Mapping
Based on the selected reference:
0 Degree: ~967
45 Degree (Observed Normal Upside Capacity): ~983
The 45-degree level is often monitored as a potential reaction zone when price reaches it earlier in the session.
⏱️ Observed Price–Time Behavior
Price moved upward steadily from the reference area.
The 45-degree zone was reached around the later part of the session but still before the typical intraday time threshold.
After interacting with this zone, the market showed temporary selling pressure.
Such reactions have been historically observed when normal price capacity is completed early.
This behavior reflects the price–time balance concept, where movement completion can coincide with short-term pauses or reversals.
📘 Educational Takeaways
Importance of identifying a valid 0-degree reference
Measuring normal intraday price capacity using Square of 9
Observing time alignment along with price levels
Understanding reaction zones rather than fixed turning points
Maintaining a rule-based and emotion-free approach
This example demonstrates how structured analysis can help interpret intraday behavior objectively.
📌 Shared strictly for educational and historical chart-study purposes.
#AxisBank #GannSquareOf9 #WDGann #IntradayAnalysis #MarketEducation #PriceTime #TechnicalAnalysis #RuleBasedStudy

Shakti Shows Weakness ! What to do ?💡 If you liked the idea, don’t forget to Boost 🚀
Your comments and views are always most welcome.
SHAKTI PUMPS
Screenshot shared via the Chart
Trade Set up
CMP 574
Add on dips till 525
SL CLB 485
Expected Tgt 650-700-750 & upwards
TSL MUST
For more market insights & structured trade ideas,
📲 Visit my profile and hit Follow
Warm regards,
Naresh G
SEBI Registered Research Analyst
💬 Comment below if you want me to analyse any stock for you 🔍

XAUUSD (Gold) | Breakout Trade Setup | 16th Feb'2026XAU/USD is currently trading at 5005, with neutral intraday momentum while maintaining a strong bullish bias on the higher timeframe.
Moving averages continue to favor buyers (9 Buy vs 3 Sell), reflecting underlying strength in trend structure. However, oscillators remain neutral, with RSI around 49 — sitting near the midpoint and indicating balanced short-term momentum. Price is hovering close to the pivot level at 4993, suggesting indecision in the immediate term, while the medium-term structure remains firmly bullish.
Key technical levels to watch:
Resistance: 5014 / 5052 / 5072
Support: 4956 / 4935 / 4898
In a bullish scenario, holding above the 4990–5000 zone keeps upside pressure intact. A sustained breakout above 5015 could trigger momentum toward 5050–5070, aligning with the broader uptrend.
In a bearish scenario, a breakdown below 4955 may open the path toward 4935 and potentially 4898. Additional confirmation would come from RSI slipping below 45, signaling increasing downside pressure.
Best intraday approach:
Consider buying near support around 4960–4970 with a tight stop-loss.
Alternatively, trade a confirmed breakout above 5015 for momentum continuation.
Overall view: The higher timeframe trend remains bullish, while intraday structure is neutral and range-sensitive. Patience around key levels is essential.
Disclaimer: This analysis is for educational and informational purposes only and does not constitute financial advice. Trading involves significant risk, and market conditions can change rapidly. Always conduct your own research and use proper risk management before making any trading decisions.

Great Eastern Shipping - Weekly Breakout SetupOn the weekly timeframe, Great Eastern Shipping Co. Ltd. is approaching a crucial resistance zone around 1300–1306.
🔹 This zone has acted as strong supply in the past.
🔹 Price is now reclaiming key moving averages with strong structure.
🔹 Momentum building after a rounded base formation.
A decisive weekly close above 1306 can trigger a strong breakout move.
🎯 Upside Target: 1900
📈 Potential Upside: ~35%+
However, failure to sustain above this zone may result in a deeper pullback toward lower supports.
This is a high-risk, high-reward zone — breakout confirmation is important.
⚠️ Disclaimer: I am not an expert. This is just my personal view on the chart. Please do your own research before taking any trade.

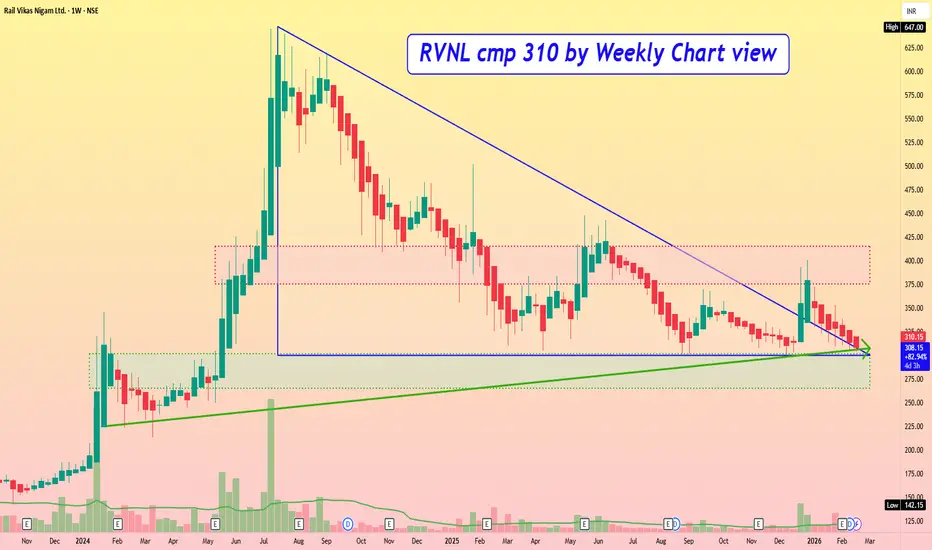
RVNL cmp 310 by Weekly Chart viewRVNL cmp 310 by Weekly Chart view
- Support Zone 265 to 302 Price Band
- Resistance Zone 375 to 415 Price Band
- Rising Support Trendline providing a stable shoulder
- Descending Triangle formed at Support Zone anticipating upside breakout
- Volumes seen by Selling pressure but demand based buying cushioning it out
- Support Zone forming strong base ground and holding price and volumes front
JBCHEPHARM 1 Week Time Frame 📌 Weekly Support & Resistance Levels (Recent Technicals)
Resistance Zones (Upside Targets):
R3: ~₹1,978–₹1,980
R2: ~₹1,937–₹1,942
R1: ~₹1,906–₹1,910
(Weekly break above these suggests bullish continuation)
Pivot / Mid (Key Reference):
Pivot Zone: ~₹1,865–₹1,870
(Above this suggests positive bias, below = cautious)
Support Zones (Downside Floors):
S1: ~₹1,834–₹1,839
S2: ~₹1,793–₹1,829
S3: ~₹1,763–₹1,776
(Breaks below these levels open deeper weekly correction risk)
📊 Context (Weekly Chart Interpretation)
✔ Above ~₹1,910 (R1):
Weekly closes above this level strengthen bullish structure, target next at ~₹1,937–₹1,978.
✔ Between ~₹1,865–₹1,910:
This is a neutral consolidation band — weekly direction remains uncertain and range-bound.
✔ Below ~₹1,834:
Loss of this support suggests weekly bearish momentum; next downside towards ~₹1,760 region.
🔍 Weekly Strategy Guide (Technical Context Only — not investment advice):
Bullish weekly bias: Weekly close above ₹1,906–₹1,910.
Neutral / consolidating: ₹1,865–₹1,906 range.
Bearish risk: Weekly close below ₹1,834.

NATCOPHARM 1 Month Time Frame 📊 Current & 1-Month Price Context
Over the past month the stock has traded roughly between ₹806 – ₹894 on the NSE, with observed closes in that range.
Recent prices have been volatile but staying within this ~₹800–₹900 band.
🔹 Near-Term Support Levels (1-Month Focus)
Key support zones you might watch:
₹806 – ₹810 — recent 1-month low area / first major floor.
₹817 – ₹821 — short-term pivot support and lower boundary of consolidation.
₹840 – ₹850 — mid-range support that has acted as a buffer on pullbacks recently.
These levels are typical areas where buyers have previously stepped in or price has bounced within the month.
🔺 Near-Term Resistance Levels (1-Month Focus)
Potential upside resistance levels:
₹868 – ₹875 — initial resistance from recent consolidation highs.
₹880 – ₹894 — higher resistance zone aligned with recent swings and weekly highs.
₹900+ — psychological/round number resistance (also coincides with some moving averages).
These levels often act as supply zones where price has slowed or reversed in recent weeks.
📌 Summary — 1-Month Price Band
Typical recent trading zone: ~₹806–₹894 per share on NSE.
Support cluster: ~₹806–₹840
Resistance cluster: ~₹868–₹900+

#NASDAQ FINAL DOWNWARD MOVE📊 Nasdaq Elliott Wave Update
The Nasdaq began its daily correction on 29 Oct 2025 📉, forming its A wave on 21 Nov 2025 with a low at 23,854.
- 🔎 The A wave unfolded in 3 subwaves, signaling a flat correction.
- 📈 As expected, the B wave retraced >61.8%, rising to 26,165.
Now, the index is progressing through its C wave:
- 🌀 C waves typically fall in a 5-wave structure.
- ✅ 4 waves are complete, and the 5th wave is unfolding.
- 🎯 This final leg could potentially drive the Nasdaq down toward 24,000.

POONAWALLA 1 Week Time Frame 📊 Weekly Timeframe – Key Levels (Accurate & Recent)
🔹 Weekly Pivot (Central Reference)
Pivot: ~₹477–₹483
This is the price zone where weekly sentiment flips — above is bullish bias, below is bearish/neutral.
🔸 Upside Resistance Zones
These are levels where price may struggle or turn around on the weekly chart:
1. Immediate Resistance: ₹483–₹490
~ Trendline and horizontal supply resistance zone. Break above this suggests bullish momentum continuation.
2. Higher Target Resistance: ₹500–₹515
~ Next logical upside if ₹490 breaks with volume.
3. Major Upper Resistance: ₹530+ / ₹550+
~ Longer-term weekly supply area and recent historical resistance.
🔹 Downside Support Zones
These are key weekly support levels where price can find buyers:
1. Support Level 1: ₹460–₹465
~ First support around recent swing lows.
2. Support Level 2: ₹440–₹420
~ Stronger intermediate support zone (multiple weekly candles tested here).
3. Major Structural Support: ₹365–₹340
~ Deep support from long-term weekly structure and consolidations.
📈 Weekly Trend & Indicators Snapshot
Weekly price is near resistance and trendline area (~₹480–₹490) — this is a critical zone for trend continuation or pullback.
Moneycontrol weekly technical shows moving averages and MACD still positive, indicating uptrend bias on weekly timeframe.
Etmoney pivot estimates also align to weekly R1 near ₹500 and S1 near ₹464 on weekly scale.
🧠 How to Use These Weekly Levels
Bullish Weekly Setup
Weekly close above ~₹490 → confirmation of breakout
Next target zones: ₹500 → ₹515 → ₹530+
Neutral / Pullback Setup
Range play between ₹460–₹490
Watch for rejections and reversal candlestick patterns
Bearish Weekly Setup
Weekly close below ~₹460 → possible retest of ₹440 → ₹420
Breakdown below ₹420 can lead to deeper supports

HIGH VOLUME WITH BREAK OUT STOCKPerfect High-Volume Breakout Conditions
Use all 3 together:
Price breaks 20-day / 50-day High
Volume ≥ 2× average volume (20-day)
Close above breakout level (not intraday spike)
Optional pro filters:
RSI > 55
Above 200 DMA (trend confirmation)
