DXY Monthly Analysis: Key Support Holding, Bullish Move Ahead?📊 DXY Monthly Chart Analysis (March 27, 2025)
Key Observations:
Current Price Action:
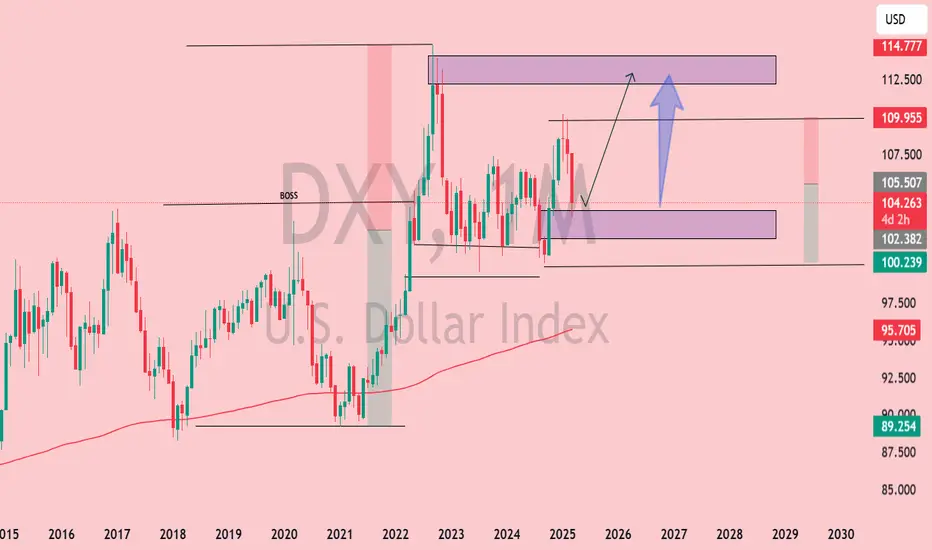
The U.S. Dollar Index (DXY) is trading near 104.267, with notable resistance ahead.
Price is consolidating within a key demand zone (~102.5–104) after rejecting higher levels.
Technical Levels:
Support Zone: 100.2–104 (Highlighted in purple)
Resistance Zone: 112.5–114.7 (Highlighted in purple)
Major Resistance: 114.77 (Previous high, acting as a supply zone)
200-MA Support: Located below current price, offering a long-term bullish confluence.
Market Structure:
Price remains in a higher time-frame bullish trend but is experiencing a correction.
The "BOSS" level (Break of Structure) suggests a prior bullish breakout.
If the demand zone holds, a bullish continuation towards 112.5–114.7 is possible.
Projected Move:
A bounce from 102–104 could trigger a rally toward the upper resistance zone (~112.5).
A break below 100.2 could indicate a shift in trend and further downside.
Conclusion:
DXY is at a critical decision point. Holding the current support zone (~102–104) could fuel a bullish continuation toward 112–114, while a breakdown below 100.2 would weaken bullish momentum.
PAIR

USDCAD Bearish Setup (Target Range 400 Pips)Pair Name : USDCAD
TimeFrame : 4Hrs
Direction : Short
Type : Swing
Target Range : 400 Pips
Bearish Break : 1.25800
-------------------------------------------------------------------------
Neat and clean chart with clear setup, no junk on chart.
-------------------------------------------------------------------------
If you like this idea, then smash like button and follow us for regular updates.
-------------------------------------------------------------------------
Note:- Do you own due diligence before taking any trades.
Thanks

BSV/BTC. Will this skyrocket aka MOON?I've been waiting for this a long time. I bought in earlier. I purchase this pair on TDXP.app
It's really something. As soon as BTC crashes, and all the alts pump as in 2017. I think the crypto market will consider BSV as an altcoin for now until BSV over takes BTC. But for now there is money to be made on this pair to buy this low. Go easy on leverage.
This is not financial advice, this is an idea I am continuing with. It's so low, how much lower can it go. Maybe a double bottom? I'm already in, if it double bottoms then I'll go in some more.
Cheers.

Pair : Bullish Nestle vs Tata ConsumerThe pair ratio has corrected to long term crucial turning point (range).
It is also standing at 61.8% retracement of rally from Jan'18 - Feb'19
RSI is in oversold territory
Going by history, the pair ratio is ripe for reversal from 38.58 now, to potentially 44+

Pair - Asian Paints, Berger PaintsThe pair ratio was consolidating for 3 years (Nov'16 - Oct'19) in the range of 3.899 - 5.030
It broke down in Oct'19.
161.8% retracement of the above consolidation was at 3.201. The ratio made failed attempts to breakdown below this level, only to revert back to 3.899.
The ratio has again reached (almost) the same retracement level of 3.201, with RSI making higher lows.
As long as the ratio is above 3.201, it would attempt to move up to 3.630, 3.899

Pair - BankNifty, NiftyThe pair chart formed bullish crab pattern with PRZ (1.618 XA) at 2.020, stop loss at (2.00 XA) 1.870.
It has confirmed bullish RSI divergence.
A failed breakdown from 2016 lows of 1.942.
As long as prices are above 1.942, the ratio looks set to revert to 2.280

Pair Trade : Buy Sun Pharma, Sell CiplaBullish RSI divergence confirmed in the pair ratio.
A similar formation was seen in Jul'19 - leading to a sharp rally in the pair.
From the current ratio of 0.750, the pair can revert towards 0.875

Just projection on INRJPY.Hello! Friends,
I came with new research and idea but, before to start talking about technical Let's share your LOVE by giving me LIKES and COMMENTS.
Thanks in advanced .
I have given projection where everything is clear.
--------------------------------------------------------------------------
"" WEEKLY CHART ""
--------------------------------------------------------------------------

USDCAD in strong uptrend buy on retracementAfter macroeconomic data releases from the U.S. and Canada lifted the USD/CAD pair to a fresh 19-month high at 1.3563. Pair trending in strong uptrend and falling crude oil have major contribution in Canadian economic data ABOVE 1.3600 TGT 1.3645-1.3675

HDFC BANK VS KOTAK BANK PAIR OPPORTUNITY BUY HDFC AND SELL KOTAKAs you all know pair trading is market neutral study. Great breakdown seen in hdfcbank/kotak bank chart and now pull back
and rejection from its 50% retracement level
