Nifty Data Suggests Next Month is Bullish!The market finally gave traders what they were waiting for – NSE:NIFTY closed above the much-watched 25200 resistance level.
But let’s not celebrate just yet; today’s move was largely driven by short covering.
Sellers still outnumber buyers by nearly 25 million volume, a sign that genuine buying interest hasn’t fully stepped in.
That said, the weakness we saw in the previous sell-off is clearly fading, and momentum is gradually returning to the market.
Today’s candle on Nifty forms a classic liquid bar, suggesting increased participation and possible continuation.
Putting these pieces together, tomorrow could play out as a sideways-to-bullish session.
But the bigger story lies ahead – rollover data hints at a bullish bias for the next series. If the current data holds, we might be looking at Nifty testing 26000 in the coming month.
My broader market view remains bullish.
For tomorrow, Nifty’s range is likely to remain tight:
Support around 25180, Resistance near 25250. A sustained move above 25250 can push us towards 25350.
Sector-wise, I continue to keep a close eye on textiles, NSE:CNXPHARMA , and Auto Components. For now, my capital remains parked in NSE:CNXENERGY , but I’m ready to rotate funds the moment a structural shift emerges in these priority sectors.
NSE:BANKNIFTY , on the other hand, seems far more decisive. Buyers dominated today with 10 million more volume than sellers, and the candle too is a liquid bar – a clear sign of strength. A new high appears just around the corner.
Expected range: Support near 56930 and Resistance around 57275.
As for the trades I got into earlier, they worked out beautifully:
NSE:OLECTRA closed 4.39% higher
NSE:NAVA gained 3.23%
NSE:GODREJAGRO rallied 4.72%
NSE:PARADEEP surged 5.56%
That’s it for today. take care, trade with discipline, and let’s prepare tonight for another profitable session tomorrow.
PARADEEP
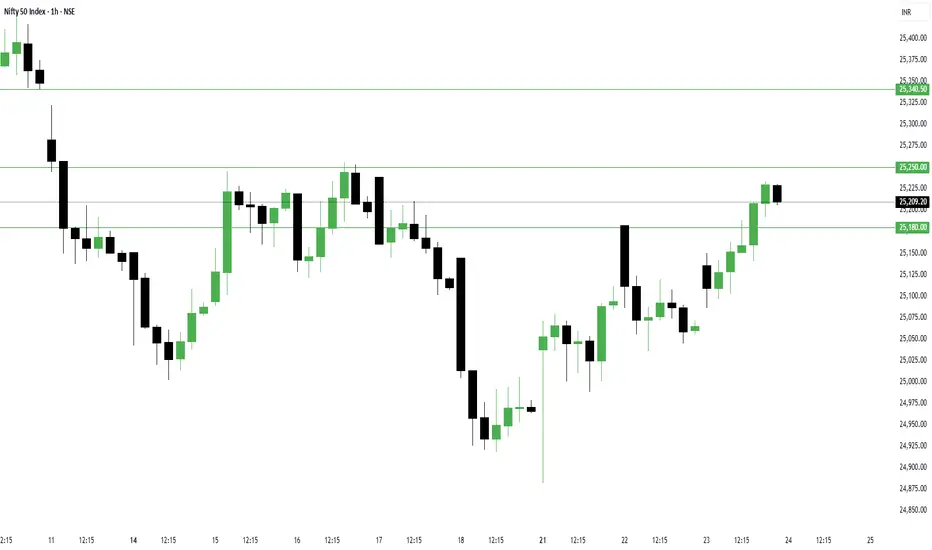
Chart always tells the truth - Nifty and Banknifty The chart always tells the truth.
We studied that NSE:NIFTY would bounce, and it did — what a bounce!
But keep in mind, fear is still present in the market. Traders can sell even on the smallest negative trigger. Today’s move was largely because of short covering.
Today’s Nifty candle is bullish, but buyers’ volume is only 40 million higher than sellers, while on Friday sellers had 43 million more than buyers.
This clearly shows that sellers are still active.
So, a bullish candle + low volume + short covering = likely sideways action tomorrow.
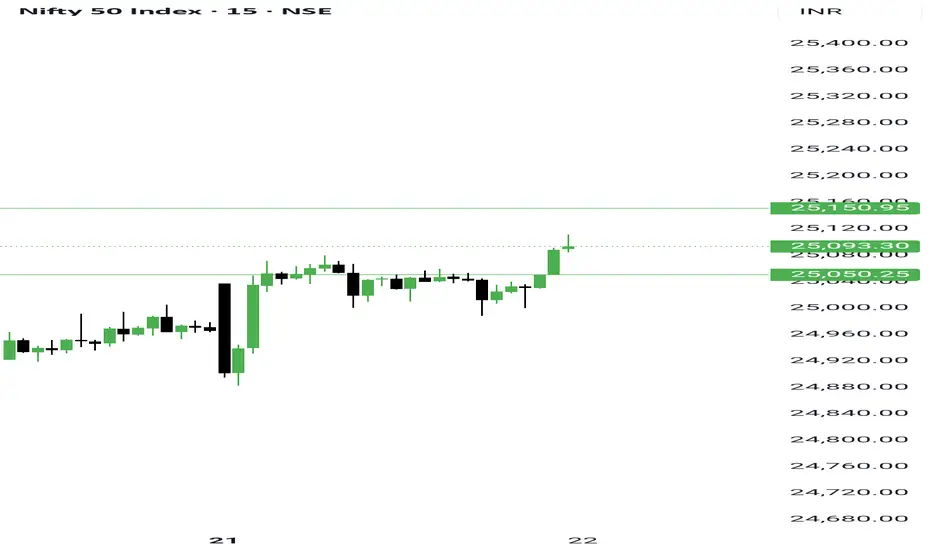
Nifty levels:
- Support: 25050
- Resistance: 25175 — above this, we could see short covering up to 25350
The market remains bullish, and this is the right time to build a list of stocks where character or structure change has happened.
If you can spot such small-cap stocks, you can easily aim for 40-50% upside in next 3-4 months.
Talking about NSE:BANKNIFTY — even after such a big green candle, sellers outnumbered buyers by 7 million in volume. So be cautious while trading here.
BankNifty levels:
- Support: 56770
- Resistance: 57200
Sector-wise, the craze is still around IPOs. Focus on recently listed NSE:NIFTY_IPO stocks (1-2 years old) where character changed in the last rally.
Here’s how my recent picks performed today:
NSE:MASTEK - +7%
NSE:PARADEEP - +7.63%
NSE:JYOTICNC - +5%
NSE:BDL - +2.80%
NSE:LTF - +3.66%
NSE:UPL - +3.92%
NSE:CARRARO - +5.6%
NSE:KPEL - +4.7%
NSE:MMTC - +3.79%
That’s all for today.
Take care.
Have a profitable tomorrow.
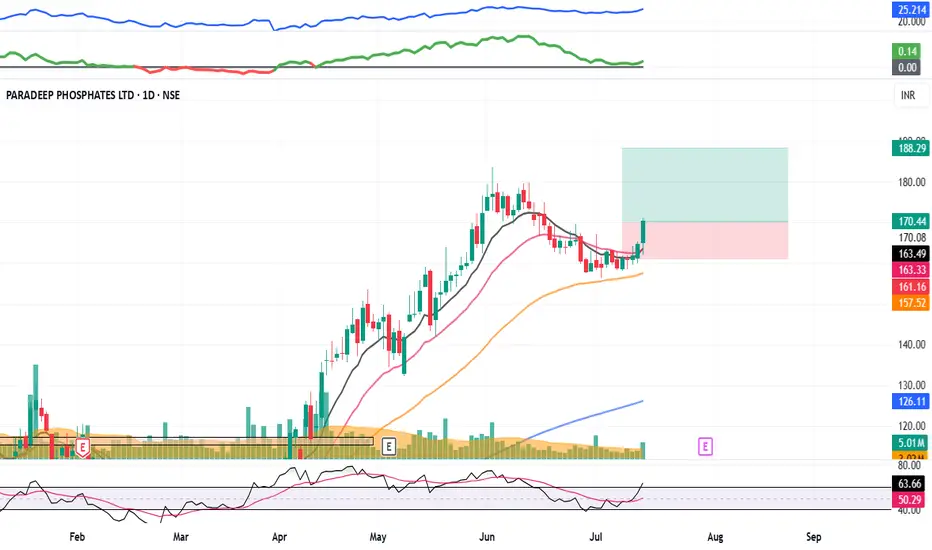
PARADEEP : Momentum Pick#PARADEEP #swingtrade #trendingstock #momentumtrade
PARADEEP : Swing Trade
>> Low PE Stock
>> Good Retracement and consoldation
>> Stock Ready for next leg of Rally
>> Good Strength & Volume
>> Risk Reward Favourable
Swing Traders can lock profit at 10% and keep Trailing
Please Boost, comment and follow us for more Learnings
Disc : Charts shared are for learning purpose only, not a Trade recommendation. Do your own research and consult your financial advisor before taking any position.
All time high breakoutChart -> PARADEEP Daily
CMP: 133
Good Range to Buy: 126 to 133
Targets: 147, 156, 173
SL: 116 Daily Close
Disclaimer: This is for educational purposes only, not any recommendations to buy or sell. As I am not SEBI registered, please consult your financial advisor before taking any action.

Paradeep Phosphates Ltd. at Buy SupportParadeep Phosphates Ltd. at Buy Support. CMP 109.
Resistance at 113.60, break further for beyond.

PARADEEP : Stage 1 Breakout Continuation#PARADEEP #breakout #trendingstock #momentumtrade
PARADEEP : Swing Trade
>> Stage1 Breakout + Rally now consolidation
>> Ready for Continuation
>> Trending setup
>> Good Strength & Volume
>> Low Risk High Reward Trade
Swing Traders can lock 10% profit & keep trailing
Note : In the current Market Scenario even the best of Trading setup's can fail so Trade only Good setup's with proper Risk Management, set of rules for Stop-loss & proper position sizing.
Please give a Boost or comment if u r Liking the analysis & Learning from it. Keep showing ur Love by following
Disclaimer : This is not a Trade Recommendations & Charts/ stocks Mentioned are for Learning/Educational Purpose. Do your Own Analysis before Taking positions.

PARADEEP PHOSPHATS by KRS Charts5th Nov 2024 / 10:12 AM
Why PARADEEP ❓❓
1. Strong Fundamentals in its segment, Technically Higher Highs and Higher Lows are visible. ✅
2. Was Surviving in a Range now Breakout it.
3. AVG/ Better ENTRY if gets will be 98 to 96 Rs.
4. SL is little further down due to previous Gap up in Smaller TF can fill if come down.
Target 134 Rs.
SL will be 84 Rs.

PARADEEPPARADEEP given resistance breakout after long 5 months consolidation. Probability of new run is v high.

PARADEEP - Range Breakout
PARADEEP - Range Breakout
4-Month Range:
The stock was trading within a clear range for approximately 4 months, between ₹76 (support) and ₹95 (major resistance).
During this period, the price was consolidating, indicating indecision or accumulation by market participants. The price tested both the upper and lower boundaries of the range several times, but never made a decisive breakout until recently.
Minor Resistance:
There was a minor resistance around ₹88, which the price had difficulty breaching during the consolidation phase.
This level also acted as a support level during the later stages of the range-bound movement, holding up the price when tested.
Major Resistance and Breakout:
The stock encountered major resistance around ₹95 multiple times but was unable to break through decisively until recently.
After consolidating for a while near this level, the price finally broke out above ₹95, signaling a shift in momentum from consolidation to a potential new uptrend.
The breakout was accompanied by increased volume, which adds further validity to the breakout, as higher volume confirms stronger market participation.
Post-Breakout Action:
The price spent some time just below the major resistance (around ₹92) before the final breakout, indicating the market was gaining strength.
After the breakout, the price has shown a strong move, confirming a successful breakout and marking the start of a potential bullish run.
Targets:
Target 1: ₹100 – This is a psychological resistance level where traders might start booking some profits.
Target 2: ₹107 – A higher resistance level based on prior price action, suggesting the next potential price target if the stock continues its upward trajectory.
Stop Loss:
Stop Loss: ₹88 – Placing the stop loss just below the minor resistance/support level is a conservative way to manage risk. If the price drops below ₹88, it might signal that the breakout is failing, and the stock could return to the consolidation zone.
Volume and Momentum:
The breakout is supported by an increase in volume, as seen by the volume bars rising during the breakout, which confirms strong buying interest.
The RSI (Relative Strength Index) is currently at 64, which indicates that the stock is in a bullish zone but not yet overbought, giving further room for upward movement before it faces any potential selling pressure.

PARADEEP PHOSPHATES - SWING TRADE SETUPBreakout < Restest < Bounce with good volumes from retest levels!
Nice flag setup as well!
Good to go long!

Paradeep Phosphates Ltd | AGRI Momentum StockParadeep Phosphates Ltd | AGRI Momentum Stock
Incorporated in 1981, Paradeep Phosphates Limited is a manufacturer of non-urea fertilizers and India’s second largest private sector phosphatic company.
Financial: strong
Market Cap = 6,264 Cr. Current Price = 76.8 Face Value = 10.0
ROCE = 11.0 % ROE = 11.0 % Debt to equity =1.14
Promoter holding = 56.1 % Quick ratio = 0.71 Current ratio = 1.06
Profit Var 3Yrs = 17.4 % Sales growth 3Years = 47.1 % Return on assets =3.38 %
here I discuss trending sector stock paradeep phosphates. I am technically bullish in this chart. stock is entered in unterritorial chart pattern. now we have to see how it works.
as well as stock financial is also good. And coming election would be also plus point for this agri sector stock.
Note: I am not SEBI registered financial Adviser. I solely present my views on chart .I do not charge any kind of service. This is not buy sell recommendation.
If you like my ideas than like boost and follow me for more ideas.
Thanks and comment freely

Paradeep Phospates Weekly Chart BreakoutAfter consolidated for 5weeks near resistance gave Breakout today and price made strong closing. Potentially head higher for short to medium term..!

PARADEEP: UP move soonParadeep is in pole and flag pattern and an ascending triangle. Closing above 71 can accelerate the trend. Follow the targets mentioned on Trendlines.
NOTE: I'm not a SEBI REG. Study before investing.

72 : Breakout Level Ascending Triangle Pattern in Daily Chart
Invest above 72 breakout and close above 75
Target : 106
SL : 60
Risk is yours and Reward is too yours totally

Paradeep Phosphates Ltd - Multiple Breakouts Paradeep Phosphates Ltd is India's second largest phosphate manufacturing company from Pvt sector. Multiple breakouts are seen in the chart. Parallel channel breakout, Cup & Handle breakout, trend line breakout - all are confirmed. Dividend date is on Sep 2023. A small correction can be expected after that. Have support at 68 levels. Technically chart looking good. 100 levels are within arms reach

Paradeep Phosphates- bullish- c & h breakout done.Paradeep Phosphates- C & H breakout done. both fib ext and c & h target are exactly matching. ready to buy. As its a chemical stock, the trends also favouring. can see a quick move next week. Target is 92

PARADEEP - Bullish Momentum BreakoutNSE: PARADEEP is closing with a bullish momentum breakout candle supported with volumes.
Today's volumes and candlestick formation indicates strong demand and stock should move to previous swing highs in the coming days.
The stock has been moving along the horizontal support for the past few days which is indicating demand.
One can look for a 8% to 12% gain on deployed capital in this swing trade.
The view is to be discarded in the event of the stock breaking previous swing low.
#NSEindia #Trading #StockMarketindia #Tradingview #SwingTrade

Pardeep PhosphateLong entry can be taken after the BO of the resistance area. This stock forms the HH & HL. Also RSI level above 60 on higher time frames. Good risk to reward trade. This is for your educational purpose only.This is for your educational purpose only.

Paradeep Phosphates stock analysis I daily make educational content video for swing / positional trading
