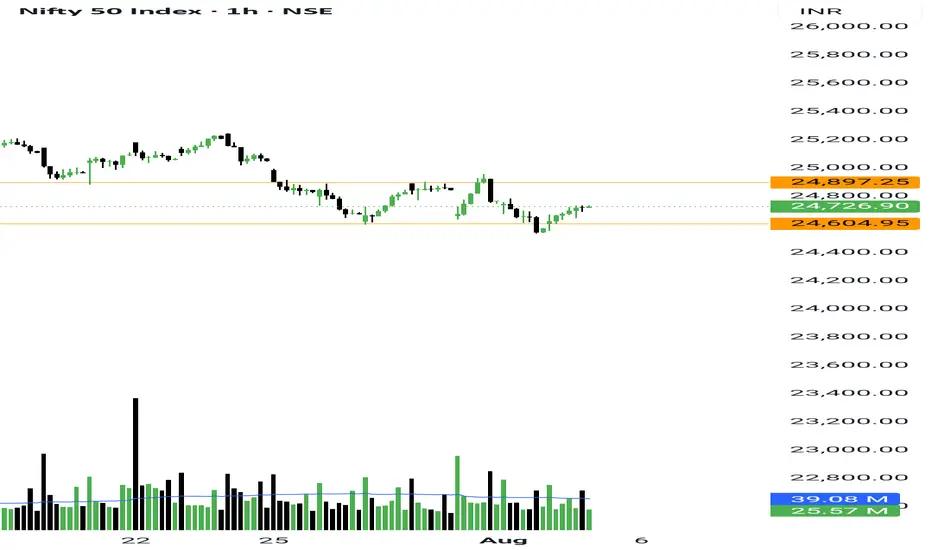
Banknifty and Broader Market improved. Nifty still lagging behinAs I mentioned in yesterday’s commentary — if NSE:NIFTY stays above the Pivot level of 24,628, we may see an upmove. And that’s exactly what happened.
Now, Nifty's Pivot has moved up to 24,671.
If Nifty opens below this and stays below it, we might see a down move again.
The Pivot Percentile is 0.21%, which means the move can be sharp in whichever direction the market goes.
The good sign is that on the Intraday chart, Nifty is shifting from a downtrend to an uptrend.
But on the Daily chart, the downtrend is still clearly visible.
Also, in the last hour of trade yesterday, buyers’ volume dropped from 37 million to 26 million, which is a bit concerning.
Putting everything together, the market can remain sideways today.
But keep in mind — if Nifty crosses the Pivot and holds above it, we might again see an upside move.
Today’s Important Levels:
- Support: 24,695
- Resistance: 24,800
NSE:BANKNIFTY looks strong today.
Its Pivot is at 55,603 and the Pivot Percentile is just 0.03% — this means the range is tight, and a sharp move can come soon.
If BankNifty crosses and holds above 55,752, we may see a strong upmove.
And if BankNifty goes up, Nifty can also follow.
Sector Focus:
The Auto sector looks strong today. You can look for good intraday setups there.
How my recent trades performed:
1. NSE:ATHERENERG – Up 14.01%
2. NSE:DELHIVERY – Up 7.39%
3. NSE:UPL – Up 7% (Still holding)
4. NSE:GMDCLTD – Up 6.98%
5. NSE:CUPID – New All-Time High, Up 5.78%
6. NSE:PARADEEP – Up 4.97%
7. NSE:IXIGO – Up 5.19%
8. NSE:CDSL – Up 6.33%
9. NSE:GENUSPOWER – Up 5.15%
That’s all for today.
Take care and have a profitable day ahead!
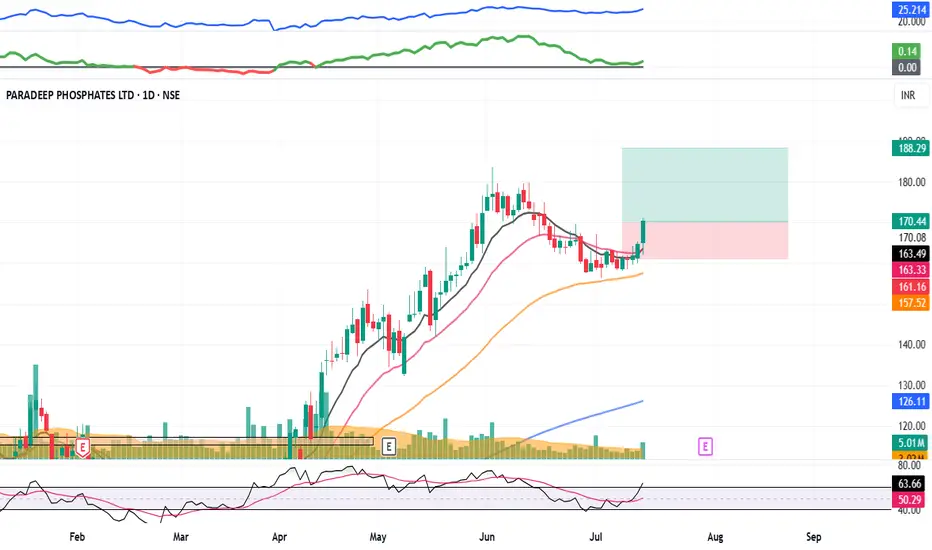
Paradeephosphateltd
PARADEEP : Momentum Pick#PARADEEP #swingtrade #trendingstock #momentumtrade
PARADEEP : Swing Trade
>> Low PE Stock
>> Good Retracement and consoldation
>> Stock Ready for next leg of Rally
>> Good Strength & Volume
>> Risk Reward Favourable
Swing Traders can lock profit at 10% and keep Trailing
Please Boost, comment and follow us for more Learnings
Disc : Charts shared are for learning purpose only, not a Trade recommendation. Do your own research and consult your financial advisor before taking any position.
Paradeep Phosphates Ltd. at Buy SupportParadeep Phosphates Ltd. at Buy Support. CMP 109.
Resistance at 113.60, break further for beyond.

PARADEEP PHOSPHATS by KRS Charts5th Nov 2024 / 10:12 AM
Why PARADEEP ❓❓
1. Strong Fundamentals in its segment, Technically Higher Highs and Higher Lows are visible. ✅
2. Was Surviving in a Range now Breakout it.
3. AVG/ Better ENTRY if gets will be 98 to 96 Rs.
4. SL is little further down due to previous Gap up in Smaller TF can fill if come down.
Target 134 Rs.
SL will be 84 Rs.

PARADEEP - Range Breakout
PARADEEP - Range Breakout
4-Month Range:
The stock was trading within a clear range for approximately 4 months, between ₹76 (support) and ₹95 (major resistance).
During this period, the price was consolidating, indicating indecision or accumulation by market participants. The price tested both the upper and lower boundaries of the range several times, but never made a decisive breakout until recently.
Minor Resistance:
There was a minor resistance around ₹88, which the price had difficulty breaching during the consolidation phase.
This level also acted as a support level during the later stages of the range-bound movement, holding up the price when tested.
Major Resistance and Breakout:
The stock encountered major resistance around ₹95 multiple times but was unable to break through decisively until recently.
After consolidating for a while near this level, the price finally broke out above ₹95, signaling a shift in momentum from consolidation to a potential new uptrend.
The breakout was accompanied by increased volume, which adds further validity to the breakout, as higher volume confirms stronger market participation.
Post-Breakout Action:
The price spent some time just below the major resistance (around ₹92) before the final breakout, indicating the market was gaining strength.
After the breakout, the price has shown a strong move, confirming a successful breakout and marking the start of a potential bullish run.
Targets:
Target 1: ₹100 – This is a psychological resistance level where traders might start booking some profits.
Target 2: ₹107 – A higher resistance level based on prior price action, suggesting the next potential price target if the stock continues its upward trajectory.
Stop Loss:
Stop Loss: ₹88 – Placing the stop loss just below the minor resistance/support level is a conservative way to manage risk. If the price drops below ₹88, it might signal that the breakout is failing, and the stock could return to the consolidation zone.
Volume and Momentum:
The breakout is supported by an increase in volume, as seen by the volume bars rising during the breakout, which confirms strong buying interest.
The RSI (Relative Strength Index) is currently at 64, which indicates that the stock is in a bullish zone but not yet overbought, giving further room for upward movement before it faces any potential selling pressure.

PARADEEP PHOSPHATES - SWING TRADE SETUPBreakout < Restest < Bounce with good volumes from retest levels!
Nice flag setup as well!
Good to go long!

PARADEEP: UP move soonParadeep is in pole and flag pattern and an ascending triangle. Closing above 71 can accelerate the trend. Follow the targets mentioned on Trendlines.
NOTE: I'm not a SEBI REG. Study before investing.
