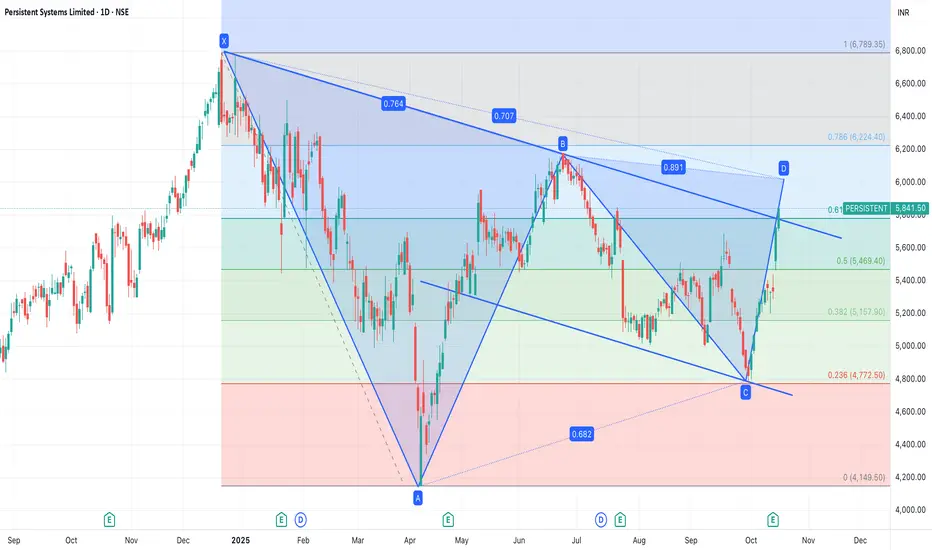
Persistent Systems Breakout parallel channelPersistant system has given a breakout and now I think it is ready to break its 52 week high. It will cross 6800-7000 is possible.
Parallel Channel
L&T Technology Services: Correction Complete Near Golden Ratio?After a textbook five-wave impulse from ₹2,924 (2022 low) to ₹6,000 (2024 high), L&T Technology Services appears to have completed a proportional A–B–C correction, finding support precisely near the 0.618 retracement (₹4,099) of the entire advance.
Wave Structure
The advance from the 2022 low unfolded as a clean 5-wave impulse, capped by Wave 5 near ₹6,000.
The subsequent decline subdivides neatly into A–B–C, with Wave C forming a perfect five-wave internal pattern.
Sub-wave (v) of C bottomed around ₹3,951 — just below (iii), confirming structural completion with ideal symmetry.
Fibonacci & Channel Confluence
The decline halted exactly at the 0.618 retracement of the prior impulse — a zone that often attracts buying in post-impulse corrections.
The downward-sloping corrective channel that’s guided Wave C is now flattening, with price repeatedly testing its upper boundary.
A sustained breakout above ~₹4,300–₹4,400 would signal that the market may be transitioning into a new impulsive phase.
Trade Perspective (Educational View)
Scenario 1 – Bullish:
A weekly close above ₹4,400 confirms breakout from the C-wave channel, opening the door toward ₹5,200 → ₹5,650 in subsequent impulsive waves.
Scenario 2 – Extended Correction:
Failure to clear the channel and a close below ₹3,950 would extend the correction toward deeper retracements near ₹3,600 or even ₹3,400.
Summary
L&T Technology Services has now checked every box of a mature corrective phase — Fibonacci alignment, structural symmetry, and wave alternation.
A breakout above the declining channel would be the first real hint that the larger uptrend is ready to resume. Until then, patience beats prediction.
Disclaimer :
This analysis is for educational purposes only and does not constitute investment advice. Please do your own research (DYOR) before making any trading decisions.

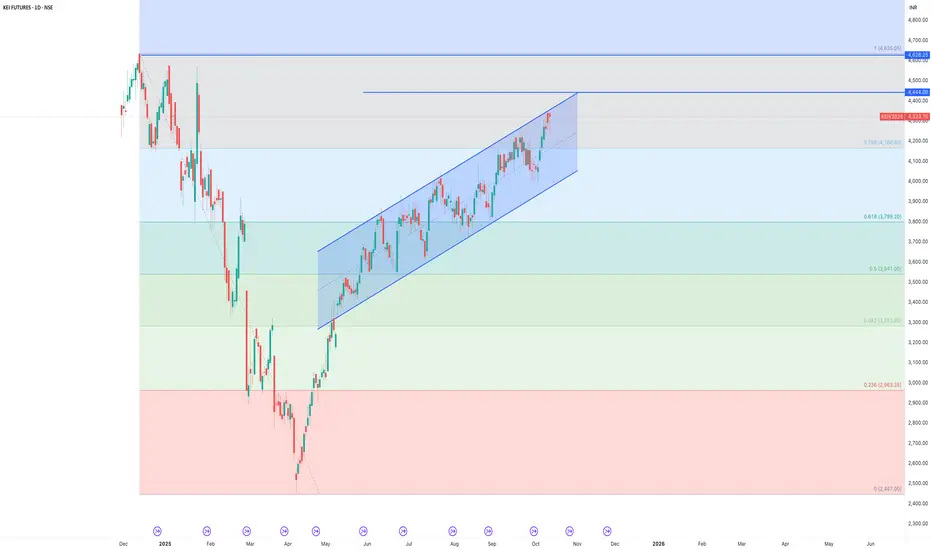
KEI in parrallel channel breakout possibleKeep ann eye on KEI industries breakout possible and it may touch or break previous 52 week high.
4650-4700 possible targets.
Eternal (D) - Hits New High But Stalls at Channel ResistanceZomato has been trading in a predictable, well-defined pattern, but recent price action, including a new all-time high today, is showing significant signs of exhaustion that could signal a short-term reversal.
The Ascending Channel
Since July 2025, the stock has been trading within a clear ascending channel , consistently respecting the upper boundary as resistance and the lower boundary as support. This pattern has provided a reliable roadmap for the stock's trajectory.
Today (Tuesday, October 14, 2025), while the stock did register a new All-Time High (ATH), it importantly failed to break out of the channel's resistance and was rejected from this upper boundary. This price action suggests that selling pressure is emerging at this predictable level.
Warning Signs of Waning Momentum
Several indicators support the view that the current up-move is losing steam, despite the new high:
- Bearish Divergence: The Relative Strength Index (RSI) is in a "lowering state" while the price is making new highs. This is a classic bearish divergence , a strong indicator that the underlying momentum of the trend is weakening.
- Declining Volume: The recent rally towards the top of the channel has been accompanied by decreasing volume, which suggests a lack of strong conviction from buyers at these higher levels.
While the short-term EMAs remain in a bullish state, the rejection at resistance combined with these warning signs presents a compelling case for a potential pullback.
Outlook
Based on the consistent channel pattern and the clear signs of weakening momentum, the most probable scenario is that Zomato will reverse from this resistance level and trend down towards the channel's support line.
The key action to watch for in the coming days is a confirmation of this reversal, such as a close below today's low or the formation of a strong bearish candle. A decisive, high-volume breakout above the channel's resistance would be needed to invalidate this bearish outlook.

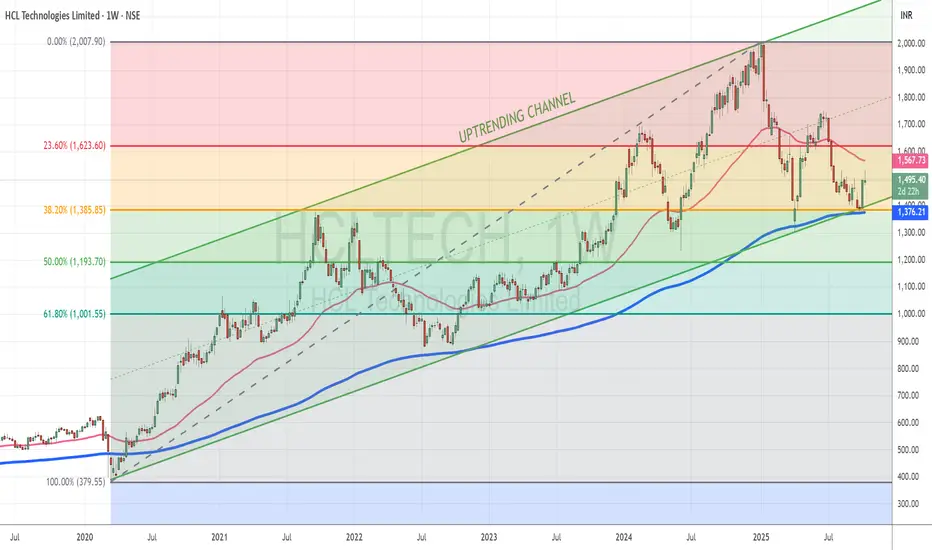
HCLTech shows signs of reversal after global-policy-driven correTopic Statement:
HCLTech, like other IT peers, has been dragged down by global economic policies but now shows early signs of recovery from key support levels.
Key Points:
1. The stock corrected down to the 38.2% Fibonacci retracement level at 1385, where it found strong support
2. Price reversed after touching the lower boundary of its bullish channel, reinforcing the trend structure
3. Currently trading below the 50-day EMA, the stock is oversold in the short term and presents a possible accumulation opportunity
Siemens Down to Support zone??!!Siemens has been travelling inside a Ascending Expanding Channel Pattern(bold yellow line) from March 2025( making higher highs and higher lows )
Now it is in the down move to making a higher low (to support level)
This down move is being done by market in the form of Descending channel pattern making lower highs and lower lows(shown as purple line)
There is also a Head & Shoulders pattern ...which has given BREAKDOWN with Good Volume support (yesterday-13-10-2025)
Siemens is looking to take support at 2900 levels(2920)
SL can be bit choppy (either the high of Breakdown candle/high of right shoulder)
Bearish view can be negated once the red dotted line breaks!!!
Let's wait and watch!!!
Thank you!!!!
Just my view...not a tip nor advice!!!!

VBL Looking Bearish??!!!VBL - On Weekly timeframe,
Inverted cup&handle pattern and a breakdown visible!!! (shown below)
On Dailytimeframe,
VBL is travelling inside a Descending channel pattern making highs and lowerhighs...lows and lowerlows...
SL & Target levels shown @ chart!!!
Let's wait & watch!!!
Thank you!!!
Just my view...not a tip nor advice!!!!

BTC: TEST OF RISING CHANNEL TOP AND POSSIBLILITY OF FREE FALL• BTC is trading in an upward trending channel for the last 4 years.
• It has recently tested the channel top in the last 4 months.
• 3 attempts made to break the channel top, but it fails to sustain above 125000.
• Aggressive selling happens in last week pushing the price near short term channel bottom.
in.tradingview.com
• Looking at the intensity of selling it seems it would break the short time frame channel bottom near 108500.
• Long term short position could be initiated with a target of T1 near channel mid-point and T2 near channel bottom 55000.
• Like to sell long team CE with high premium once the short term channel bottom broken.
• Play with money management and keep psychology intact.
• Educational purpose only.
• Happy trading.

India Hotels enters bearish zone under heavy selling pressureTopic Statement:
India Hotels has faced persistent selling since the start of the year, breaking its uptrend and entering a bearish phase.
Key Points:
1. The stock is now moving within a down-trending channel, making channel-based trading effective
2. Price is trading below both the 50 and 200-day EMAs, marking it as highly oversold in the short to medium term
3. Strong support has been established at the 700 level, which serves as a key accumulation zone for long-term investors

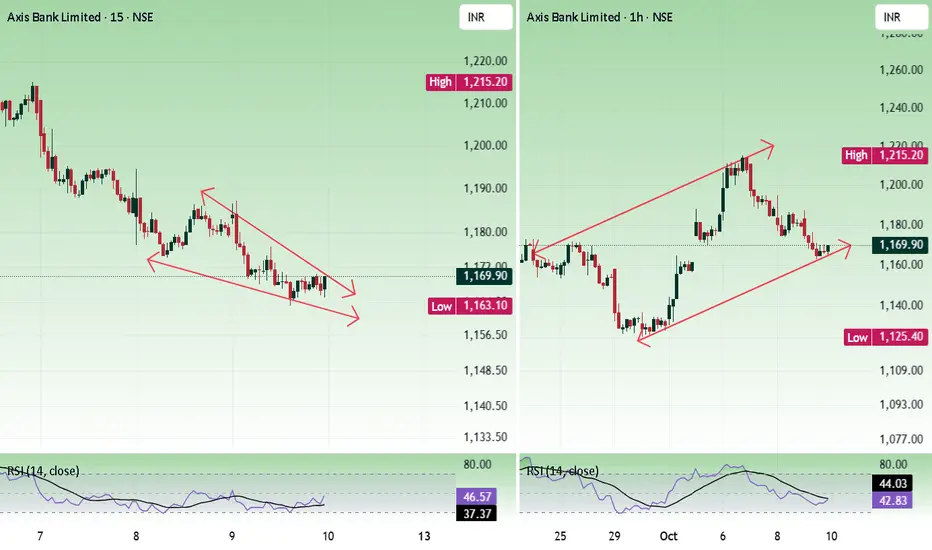
Axis bankPrice faced resistance at the 1200 - 1220 zone and falling. In higher time, the price is moving inside an ascending triangle. In a lower time frame, a falling wedge has formed. Both are bullish patterns. Holding 1160 is important for bulls.
Buying is risky if the price dont have volume strength.
Buy above 1168 with the stop loss of 1161 for the targets 1174, 1182, 1190, and 1198.
Sell below 1156 with the stop loss of 1164 for the targets 1148, 1140, 1132, and 1126.
Always do your analysis before taking any trade.
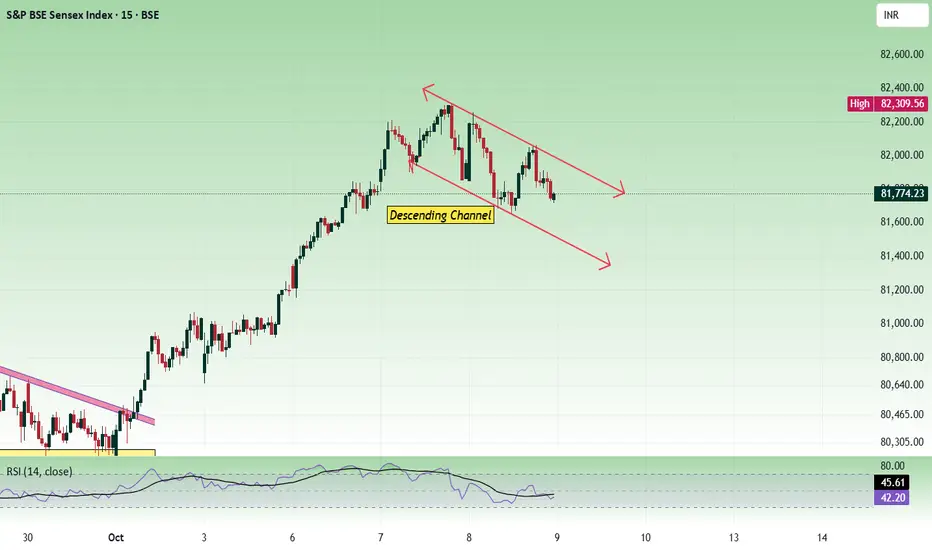
Sensex - Expiry Day Analysis Oct 9Price was facing resistance from the 82300 zone and falling. This movement was forming a descending channel as the fall was in a zig-zag manner. Nearby support is at the 81500 zone and resistance at the 82000.
Buy above 82040 with the stop loss of 81900 for the targets 82120, 82260, 82400, 82520, and 82600.
Sell below 81820 with the stop loss of 81920 for the targets 81740, 81620, 81500, 81380, and 81220.
Expected expiry day range is 81400 to 82000.
Always do your analysis before taking any trade.
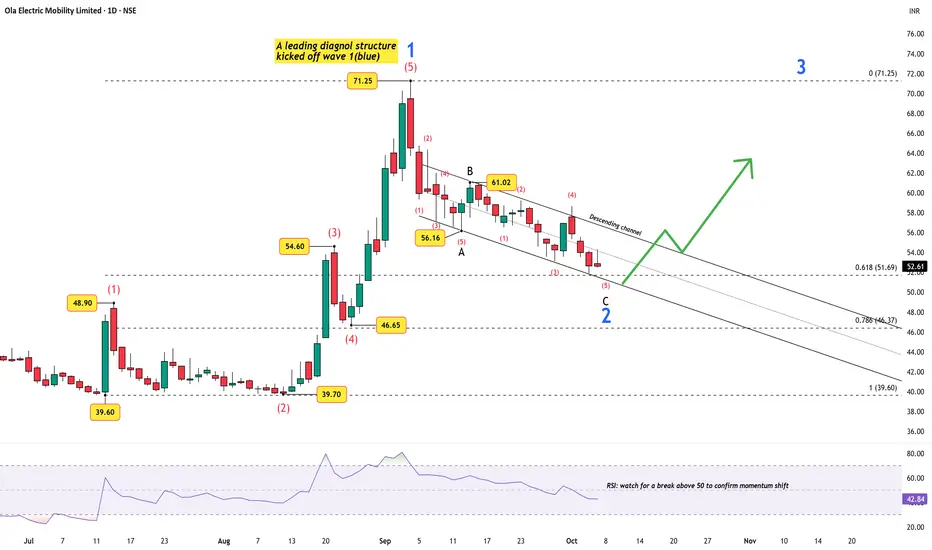
Charging Up for Wave 3 — Ola’s Motor Just Got Certified!The electric vehicle (EV) space in India is heating up again — and Ola Electric seems to be quietly positioning itself for the next leg of growth. The company’s recent government certification for its in-house ferrite motor marks an important milestone: a domestically designed motor that avoids costly rare-earth materials, potentially boosting margins and cutting import dependence.
This development strengthens Ola’s role in India’s push toward self-reliant, cost-efficient electric mobility, just as the market eyes the next growth phase in EV adoption.
Technically, the stock appears to be cooling off after its first strong impulse. The chart reveals a leading diagonal structure kicking off Wave 1, followed by a Wave 2 correction unfolding as a 5-3-5 zigzag inside a descending channel . Price now hovers near the 0.618 to 0.786 Fibonacci retracement zone (₹51–₹46) — historically a prime setup area before a potential Wave 3 expansion.
The RSI near 43 suggests downside momentum is fading, but the confirmation cue will be a break above 50 , signaling a shift in control to buyers.
In short: fundamentals are recharging while the technical battery is nearly full. Accumulation makes sense only once either
price dips toward ₹46–₹47 (deep retracement pocket), or
A breakout from the descending channel confirms that Wave 3 is ready to drive the next rally.
For now, Ola’s story is less about “if” and more about “when.”
Disclaimer: This analysis is for educational purposes only and does not constitute investment advice. Please do your own research (DYOR) before making any trading decisions.
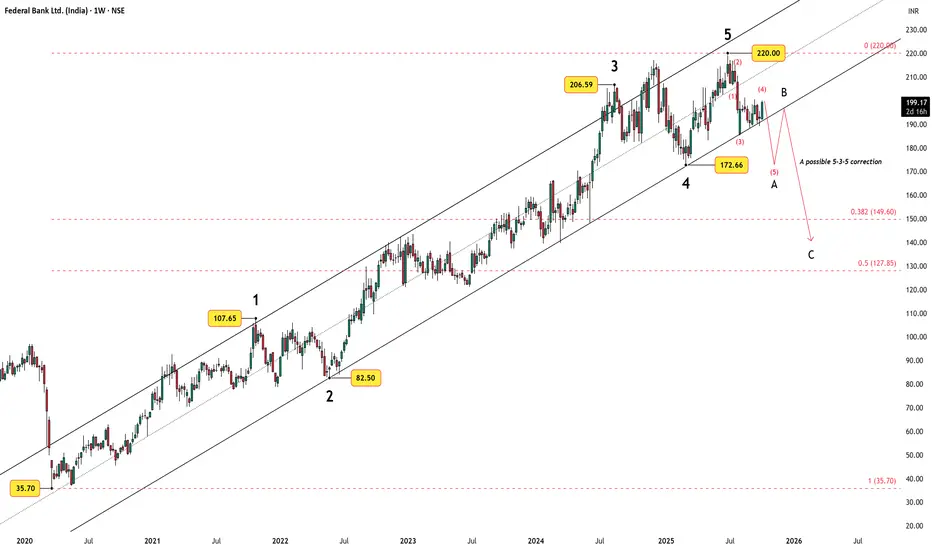
Federal Bank: Wave 4 Triangle Near Completion, Wave 5 AheadAfter a clean five-wave impulse from the 2020 low near ₹35.70 to the 2024 peak at ₹220, Federal Bank appears to be transitioning into a larger corrective phase.
Weekly Outlook
The broader structure suggests the start of a 5-3-5 zigzag correction , marked as A–B–C .
Wave A is still unfolding — only Wave 4 of A appears complete, with Wave 5 expected next to finish the first leg of the correction.
Once Wave 5 concludes, price could rebound toward the lower channel trendline to form Wave B, a counter-trend rally within the broader correction.
Thereafter, a deeper Wave C decline may follow, potentially stretching into the ₹149–₹128 zone, which aligns with the 0.382–0.5 Fibonacci retracement range of the 2020–2024 advance.
This developing structure reflects a natural pause after a long impulse cycle, with the market now transitioning into a corrective rhythm.
Daily Chart Details
Zooming in, the internal structure of Wave A shows a clear five-wave drop, with Wave (4) evolving as a contracting triangle pattern.
The MA50 has started curling toward the MA200, hinting at a possible bearish crossover — a classical confirmation of trend transition.
If price breaks below the triangle base, Wave (5) could extend toward ₹186–₹178, derived from Wave 1 projected from Wave 4’s end.
The targets will be adjusted once the final (e)-wave of the triangle is confirmed, as a minor uptick remains possible.
A sustained move above ₹206.39 would invalidate the immediate bearish setup and delay the decline.
Conclusion:
Federal Bank’s structure aligns with a typical post-impulse correction, and the interplay between Elliott Wave and moving averages provides a clear framework to track this phase.
Disclaimer:
This analysis is for educational purposes only and does not constitute investment advice. Please do your own research (DYOR) before making any trading decisions.
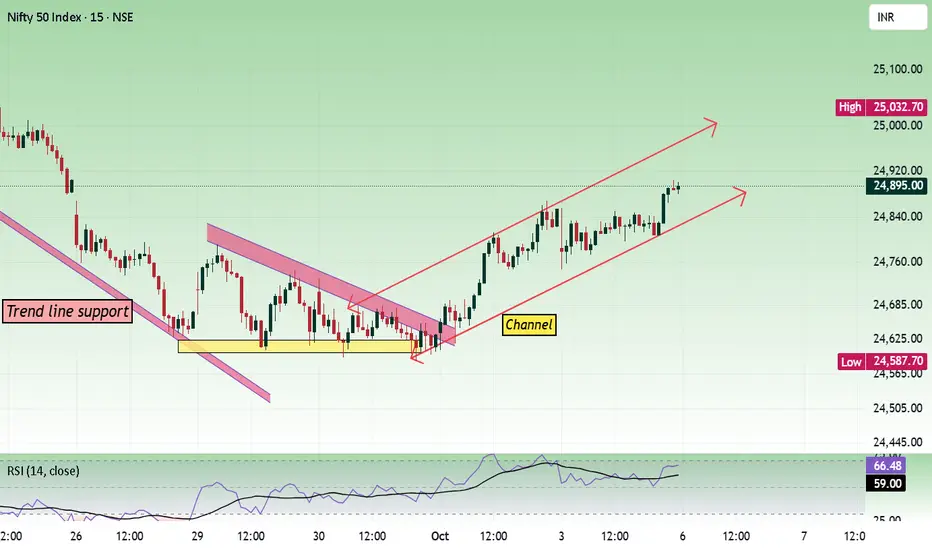
Nifty - Weekly Review Oct 6 to Oct 10In a lower time frame, the price is moving within an ascending channel. Channel movement requires more patience to identify trade setups and execute them. In the daily time frame, the price is taking a trendline support.
Nearby resistance is seen at the 25000 zone.
Buy above 24920 with the stop loss of 24860 for the targets 24960, 25000, 25040, 25100, 25160, 25220, and 25280.
Sell below 24760 with the stop loss of 24820 for the targets 24720, 24660, 24600, 24560, and 24520.
Always do your analysis before taking any trade.
Britannia holds mild bullish trend with steady support zonesTopic Statement:
Britannia remains a mildly bullish stock, resilient to broader market corrections and ideal for structured trading.
Key Points:
1. The stock recently formed a double top candlestick pattern, indicating possible short-term resistance
2. Price can be accumulated when it falls below the 50-day EMA, a level that has historically provided good entries
3. It moves within an up-trending bullish channel, making it well-suited for disciplined channel-based trading strategies

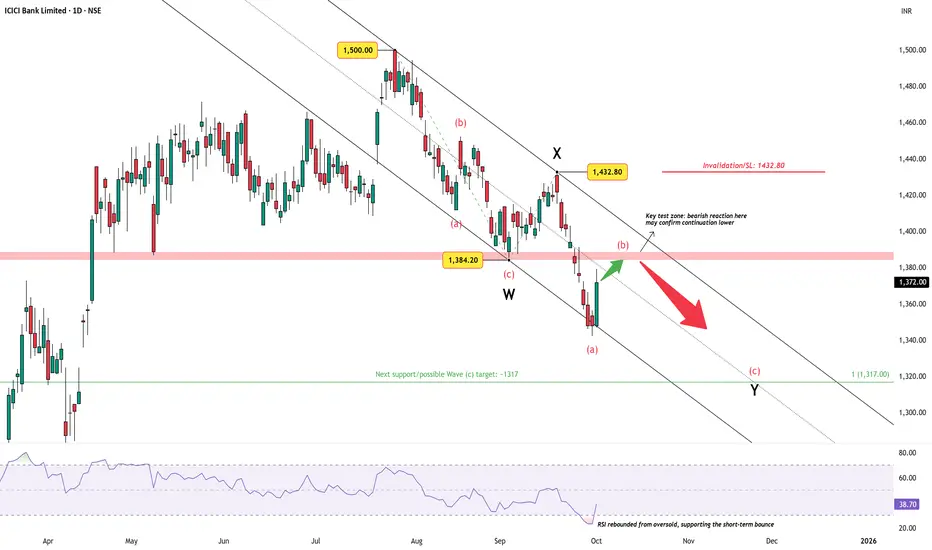
ICICI Bank – Relief Rally into ResistanceAfter topping at ₹1500 , ICICI Bank has corrected over 10% into late September, carving out a clear W–X–Y corrective structure. The recent bounce from oversold RSI levels was expected, but price is now heading straight into the crucial resistance band near ₹1384 .
A bearish reaction here would validate the ongoing correction, opening the path toward the next support / Wave (c) target at ~₹1317 .
However, any sustained move above ₹1432.80 would invalidate the bearish view and suggest a different structure in play.
Overall, the setup currently favors caution on rallies, with focus on whether sellers defend the resistance band.
Disclaimer: This analysis is for educational purposes only and does not constitute investment advice. Please do your own research (DYOR) before making any trading decisions.
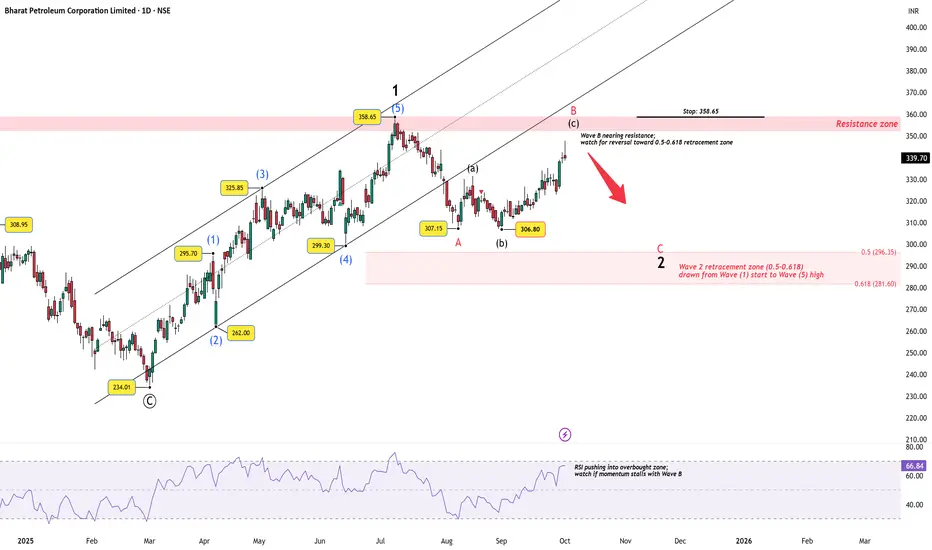
BPCL– Wave B Nearing Resistance, Wave 2 Correction Still in PlayBack on August 20, I highlighted that BPCL had completed a 5-wave advance from 234.01 to 358.65 , marking higher degree Wave 1, and that a corrective Wave 2 was in progress. (Earlier technical analysis write-up is attached here: )
At that time, only Wave (a) of the correction was visible. Since then, price action has unfolded further:
Wave B is now rising into a strong resistance cluster near 350–358.
Unless price decisively breaks above 358.65 , the move remains corrective.
A final Wave C decline into the 0.5–0.618 retracement zone (296–281) remains the higher probability path.
Momentum check: The RSI is pushing higher alongside Wave B, but if momentum stalls here, it would confirm the setup for a downward leg.
Key Levels:
Resistance / Stop: 358.65
Retracement Zone: 296 – 281
Summary: The corrective roadmap outlined in August is still intact. With Wave B nearing exhaustion, focus now shifts to a potential Wave C decline toward 296–281, before the larger bullish structure resumes with Wave 3.
Disclaimer: This analysis is for educational purposes only and does not constitute investment advice. Please do your own research (DYOR) before making any trading decisions.
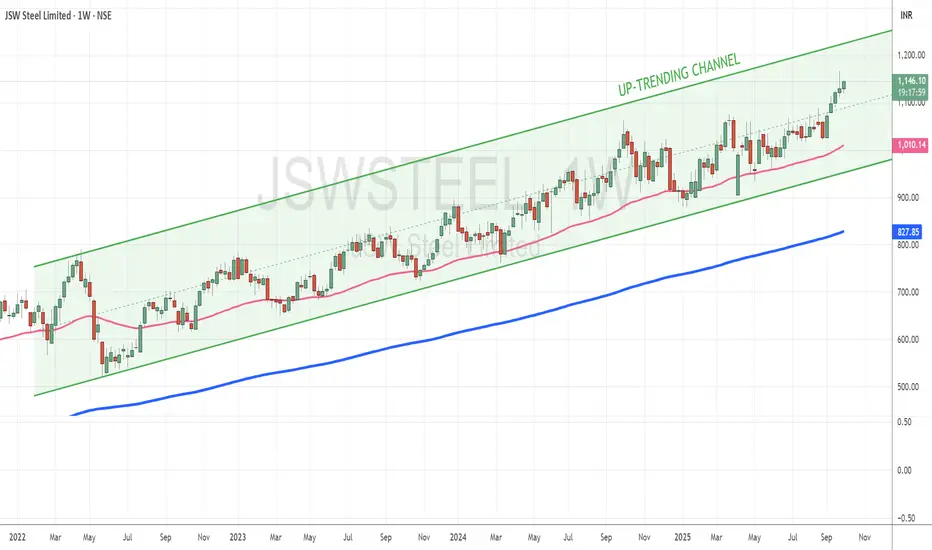
JSW Steel powers through bullish channel with momentumTopic Statement:
JSW Steel is on a relentless bullish run, steadily climbing within a strong up-trending channel that continues to attract accumulation.
Key Points:
1. The stock is moving consistently in a strong bullish channel, making directional trading highly structured and reliable
2. It rarely dips below the 50-day EMA, and when it does, it presents a strong investment or accumulation opportunity
3. The clearly defined channel makes it ideal for disciplined channel-based trading strategies
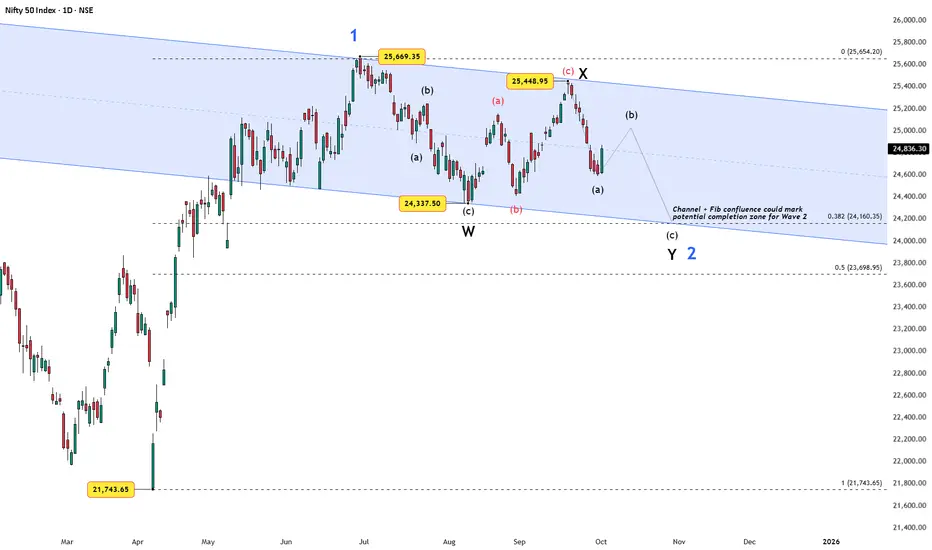
Nifty 50 – Wave 2 Correction and the Confluence ZoneDisclaimer: This analysis is for educational purposes only and does not constitute investment advice. Please do your own research (DYOR) before making any trading decisions.
After bottoming at 21,743.65 in March 2025, Nifty launched a strong impulsive rally that topped at 25,669.35, marking Wave 1 of a new higher-degree advance.
Since then, price has been moving inside a downward-sloping channel , forming what appears to be a Wave 2 correction.
The subdivisions so far suggest a W–X–Y structure :
Wave W ended at 24,337.50.
Wave X topped at 25,448.95.
Wave Y is now unfolding, with (a) in place, (b) potentially in progress, and (c) likely still pending.
To assess possible completion zones, Fibonacci retracements of Wave 1 offer key checkpoints:
0.382 retracement at ~24,160, aligning with the channel base.
0.5 retracement at ~23,699, a deeper but still acceptable Wave 2 target.
This channel + fib confluence provides a meaningful area where Wave 2 could terminate, setting the stage for the next bullish leg — Wave 3.
Key Levels:
Resistance : 25,450 – 25,670 (breakout here invalidates the immediate Wave 2 scenario).
Support : 24,160 (0.382 fib and channel base).
Deeper support : 23,700 (0.5 fib).
Alternate scenario: If price continues sideways without decisive weakness, the correction may evolve into a triangle for Wave 2 instead of a W–X–Y.
Takeaway: As long as price respects the channel and fib zones, Wave 2 remains corrective in nature. A sustained break higher would open the path for Wave 3 — the next impulsive advance.
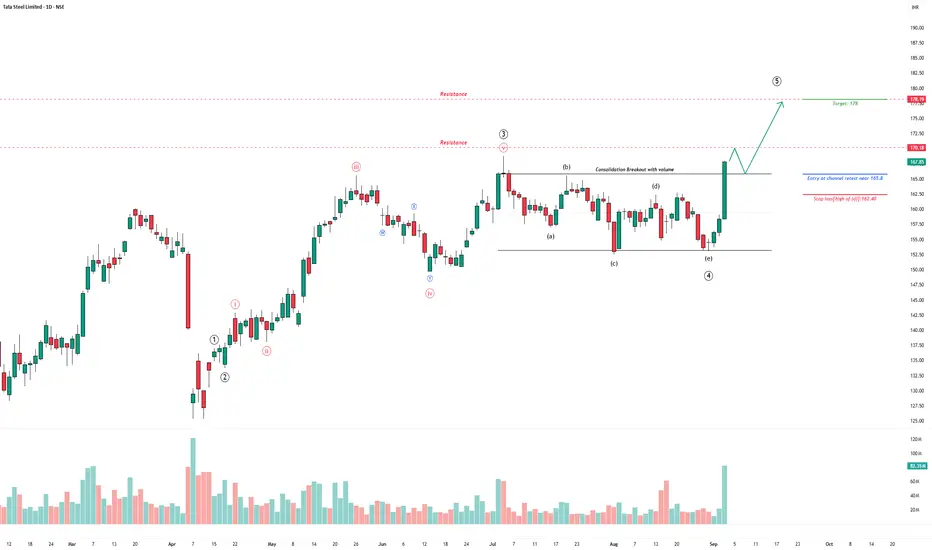
Tata Steel – Consolidation Breakout with VolumeAfter weeks of sideways price action, Tata Steel has broken out of its consolidation phase with a powerful surge in volume.
The breakout candle not only cleared the consolidation range but did so with conviction — volume spiked to multi-week highs, confirming participation. If price holds above the breakout zone, immediate resistances are lined up at ₹170 and ₹178.
Trade Plan
Entry on retest near ₹165.8.
Target: ₹178.
Stop-loss: ₹162.4.
Invalidation
A close below ₹162.4 would weaken the breakout narrative and invalidate this setup.
Disclaimer:
This analysis is for educational purposes only and does not constitute investment advice. Please do your own research and consult a financial advisor before making any trading decisions.
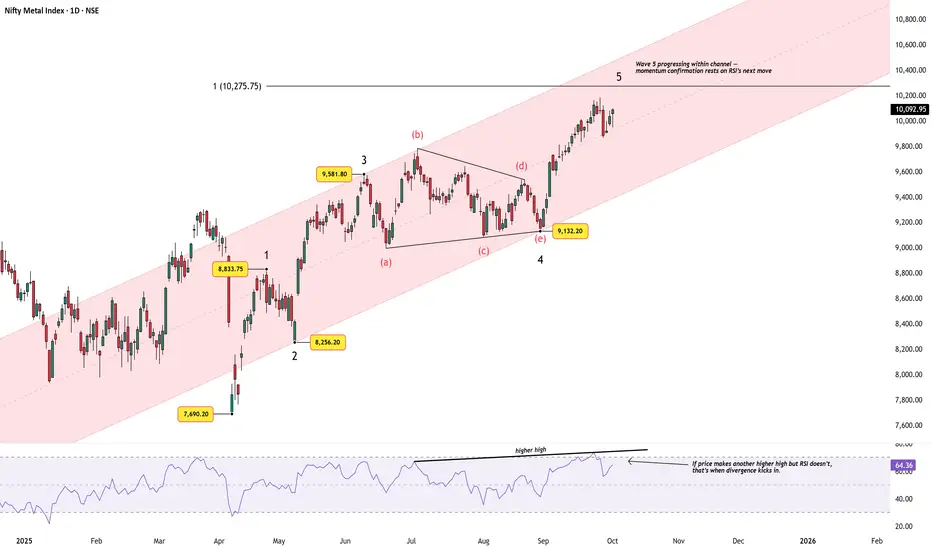
Nifty Metal Index – Fifth Wave Progression Within ChannelChart Structure:
The Nifty Metal Index continues to respect its rising channel, now advancing in Wave 5 after a clean contracting triangle in Wave 4. The impulse structure remains intact, with price steadily hugging the channel’s midline and now stretching toward the upper half.
Elliott Wave View:
Wave 1 topped near 8,833.75, after a strong rally from 7,690.20.
Wave 2 retraced into 8,256.20, holding close to the 0.382 retracement of Wave 1.
Wave 3 extended sharply to 9,581.80.
Wave 4 unfolded as a clean contracting triangle (a–b–c–d–e), ending at 9,132.20.
Wave 5 is currently progressing within the channel, with price advancing to 10,275.75, towards the 1.0x Fib extension level of Wave 1 projected from Wave 2.
Momentum Check:
RSI has confirmed the latest higher high, keeping momentum aligned with price. The key to watch now: If price makes another higher high but RSI fails to do so, that’s when bearish divergence would emerge.
Summary:
The index maintains a constructive Elliott Wave structure, but we are in late-wave territory. The channel provides a natural guide — holding the midline favors further upside, while a sustained breach of the lower channel would warn that Wave 5 has matured.
Disclaimer: This analysis is for educational purposes only and does not constitute investment advice. Please do your own research (DYOR) before making any trading decisions.
JSW Steel - Upward Parallel Chanel 📈 JSW Steel is moving in a well-defined Upward Parallel Channel on the weekly timeframe, reflecting a strong and sustained uptrend. The price action has consistently respected the channel boundaries, confirming steady buying interest.
📊 Overbought Condition:
However, the stock is currently trading near the upper band of the channel, with momentum indicators suggesting an overbought zone. This raises the possibility of a cool-off phase or a retracement toward the mean reversion (mid-channel support).
🔎 Momentum Indicators:
RSI readings indicate stretched levels, warranting caution for fresh long entries at current prices.
Volume trends remain supportive of the overall uptrend, but short-term corrections cannot be ruled out.
🎯 Projection & Outlook:
While the medium- to long-term trend stays firmly bullish, traders should watch for a possible retracement toward mid-channel support before fresh accumulation. Sustaining within the channel ensures the continuation of the uptrend, while any breakout above the channel could accelerate momentum further.
⚠️ Disclaimer:
This is a technical projection for educational purposes only and not an investment recommendation. Traders should adopt proper risk management while framing any strategy.
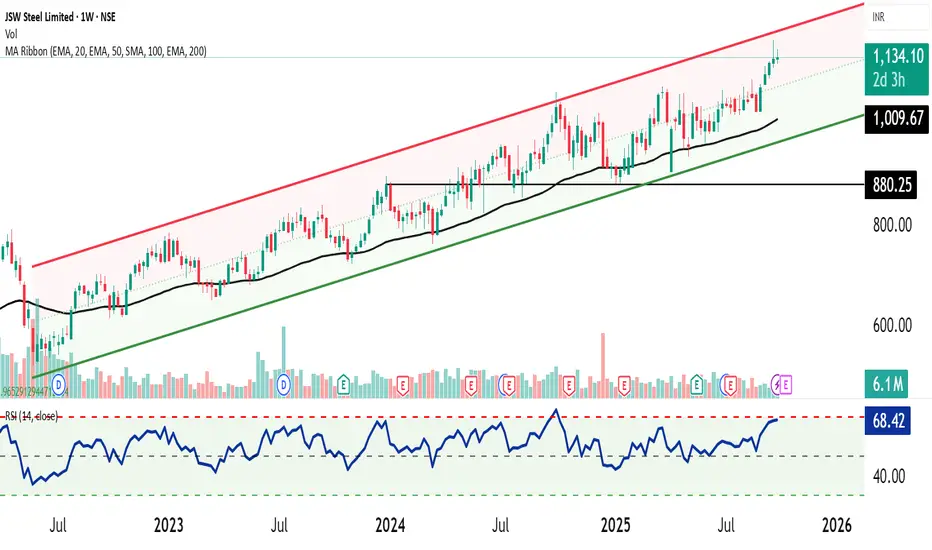
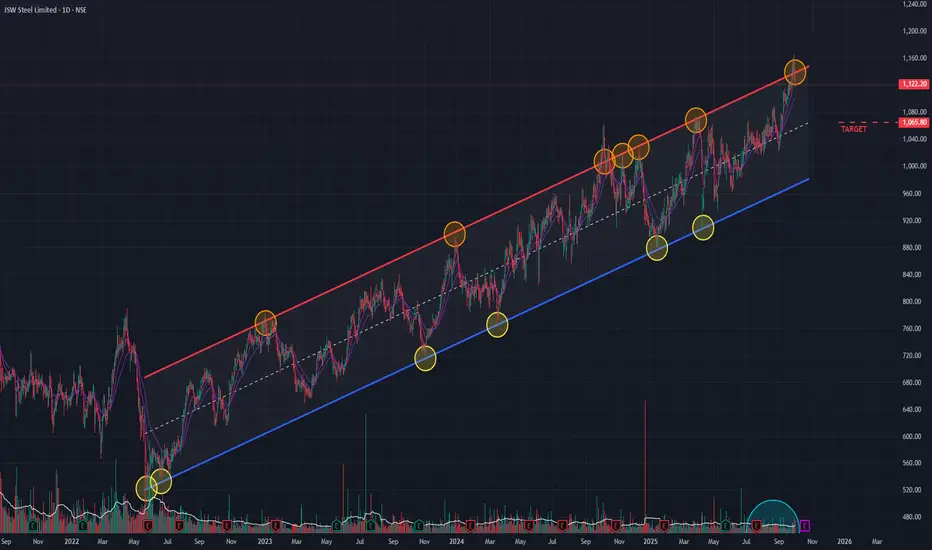
JSW Steel (D) - Tests Upper Boundary of Long-Term ChannelJSW Steel is currently trading at a critical juncture, testing the upper resistance trendline of a well-defined channel pattern that has been in place since May 2022. Historically, this trendline has acted as a strong barrier, often leading to a price reversal back towards the lower end of the channel.
Bearish Indicators Emerge 📉
Several technical indicators are suggesting that the upward momentum is waning and a potential downturn could be imminent:
- RSI Divergence: The Relative Strength Index (RSI) is showing bearish signs on the daily chart and is also starting a negative crossover on the weekly chart.
- Momentum Shift: Short-term Exponential Moving Averages (EMAs) on the daily chart are entering a negative crossover , signaling a potential shift in short-term momentum to the downside.
- Rising Bearish Volume: There has been a noticeable increase in selling volume as the stock approaches this resistance, indicating strengthening bearish pressure.
Outlook and Key Levels
Given the stock's position at a historical resistance level combined with multiple bearish technical signals, a cautious approach is warranted.
If the channel pattern holds true, the stock could reverse from this level and head downwards. A potential downside target in this scenario would be the support level near ₹1,065 . The price action in the coming sessions will be crucial to confirm this potential reversal.