Bajaj Finserv rides a long-term bullish waveTopic Statement:
Bajaj Financial Services continues its evergreen bull run, supported by strong technical structure and improved affordability following its June 2025 stock split and bonus.
Key Points:
1. The stock is trading within a bullish up-trending channel, making it ideal for structured channel trading
2. Price rarely dips below the 200-day EMA, and such moments have historically been excellent long-term accumulation opportunities
3. Dips below the 50-day EMA offer favorable entry points for short-term swing trades or quantity accumulation
4. The stock faces stiff resistance at the 2000 level, which has historically acted as a ceiling
5. The June 2025 stock split and bonus have made the stock more affordable, resulting in increased volumes and improved liquidity
Parallel Channel

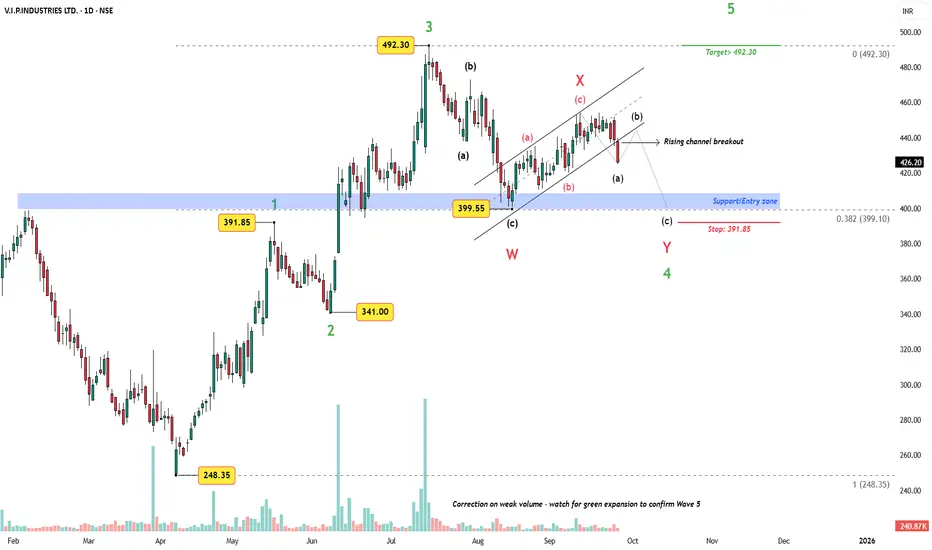
VIP Industries – Rising Channel Breakdown, Support Zone in FocusChart Structure
The stock completed a wave 3 advance up to 492.30. What followed is a corrective W–X–Y structure, which probably might test the previous breakout zone around 408–400. This aligns with the 0.382 Fibonacci retracement and previous Wave 1 high, providing strong support.
Key Observations
The corrective leg has unfolded on weak volume, typical of a Wave 4 structure.
Recent breakdown from the rising channel suggests a final (c) leg of Wave Y into the blue support zone.
A possible wave (b) retest of the broken channel cannot be ruled out before the final dip.
As per Elliott Wave rules, Wave 4 must not overlap Wave 2 (391.85) – keeping structural integrity intact.
Trade Plan
Entry Zone: Strictly in the 408–400 support band.
Stop-Loss: 391.85 (under prior Wave 1 high, violation would invalidate the count).
Target: A new high above Wave 3, i.e., ≥492.30, as Wave 5 should extend beyond Wave 3.
Volume Insight
Correction is unfolding on weak volume – confirmation of Wave 5 will require a green volume expansion from the support zone.
Conclusion
As long as 391.85 holds, the Wave 4 correction is near its end. A rally into Wave 5 with targets above 492 remains the primary scenario. However, patience is key – entry only in the marked support band.
Disclaimer: This analysis is for educational purposes only and does not constitute investment advice. Please do your own research (DYOR) before making any trading decisions.
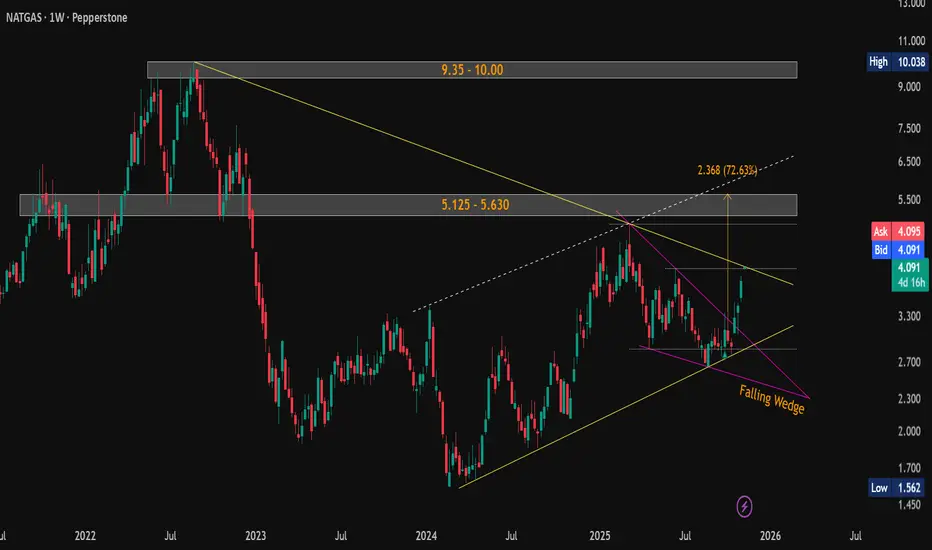
#NaturalGas ($NG) Weekly Update — Testing Critical Resistance!CMP: $4.092
💥 Up +38% from mentioned support ( $3.013–$2.956 ) and +46% from lows in a month . 🚀
The falling wedge breakout played out strongly, and price is now testing the critical resistance of the falling yellow trendline near the previous swing high $4.067 .
A weekly close above this trendline will confirm a major breakout , potentially triggering the next leg higher.
📊 Key Levels:
🛡 Supports: $4.067 / $3.013–$2.956 / $2.692–$2.643
🚧 Resistances / Targets: $5.125–$5.630 / $9.35–$10.00
Structure now forming a larger Symmetrical Triangle between rising and falling yellow trendlines — watch for breakout confirmation .
⚠️ Possible short-term pause/retest before continuation.
#NaturalGas #NG #Commodities #FallingWedge #RisingChannel #SymmetricalTriangle #ChartPattern #PriceAction
📌 #Disclaimer: This analysis is shared for educational purposes only. It is not a buy/sell recommendation. Please do your own research before making any trading decisions.
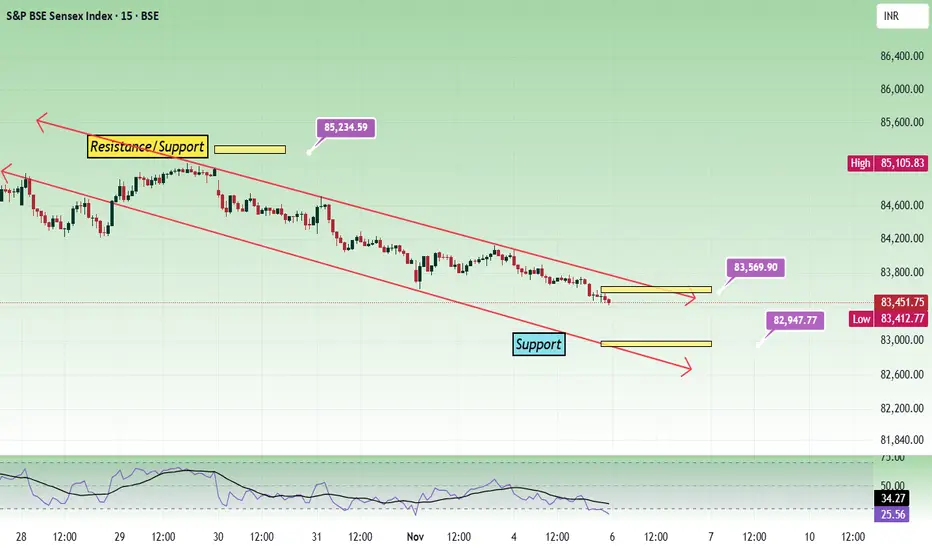
Sensex - Expiry Day Analysis Nov 6The price faced resistance at 85k and falling from there inside a descending channel. The daily chart shows that the price is having bearish strength. Channel movement is tricky to trade. Observing how the price is reacting at the channel support/resistance is important to take a trade with conviction.
If the price opens a gap up or above the channel resistance, buy above 83760 with the stop loss of 83640 for the targets 83860, 83980, 84060, 84200 and 84360.
If the price faces resistance at the 83500 to 83600 zone and if it shows bearish strength, sell below 83500 with the stop loss of 83640 for the targets 83400, 83260, 83120, 83020, 82900 and 82780.
Expected expiry day range is 83100 to 83900.
Always do your analysis before taking any trade.
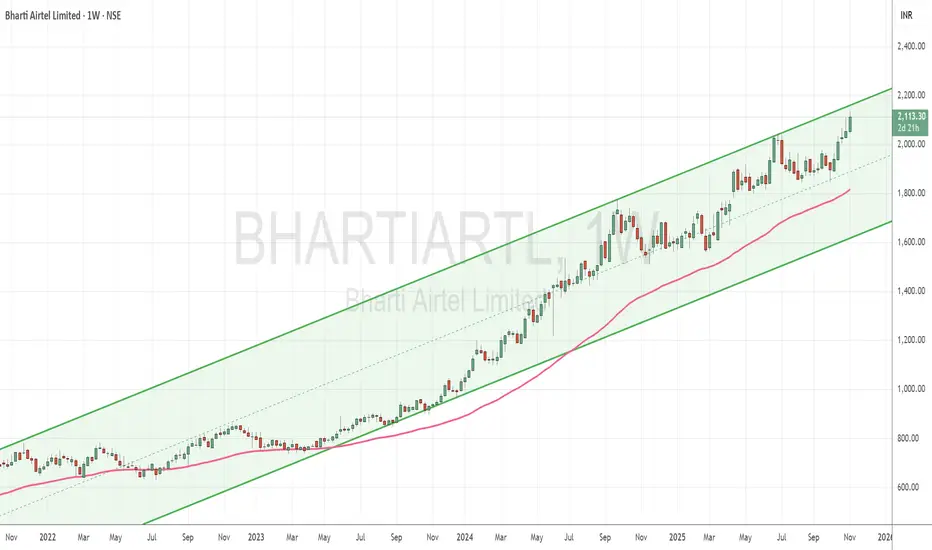
Bharti Airtel climbs relentlessly but risks overbought correctioTopic Statement:
Bharti Airtel is on a strong bull run, maintaining momentum within a defined channel, though overbought conditions hint at a potential correction risk.
Key Points:
1. The stock is moving in a bullish up-trending channel, making it ideal for channel-based trading
2. Price generally remains above the 50-day EMA, signaling continued strength
3. The stock is currently highly overbought, and a sharp correction may be on the horizon as risk builds
LTFLTF shares have been trading within a defined channel and are currently positioned above their 200-day, 150-day, and 50-day moving averages. Over the last three months, this positioning—combined with a gradual price increase—indicates a potential for further upward momentum.
However, to manage risk effectively, implementing a stop-loss strategy remains essential.

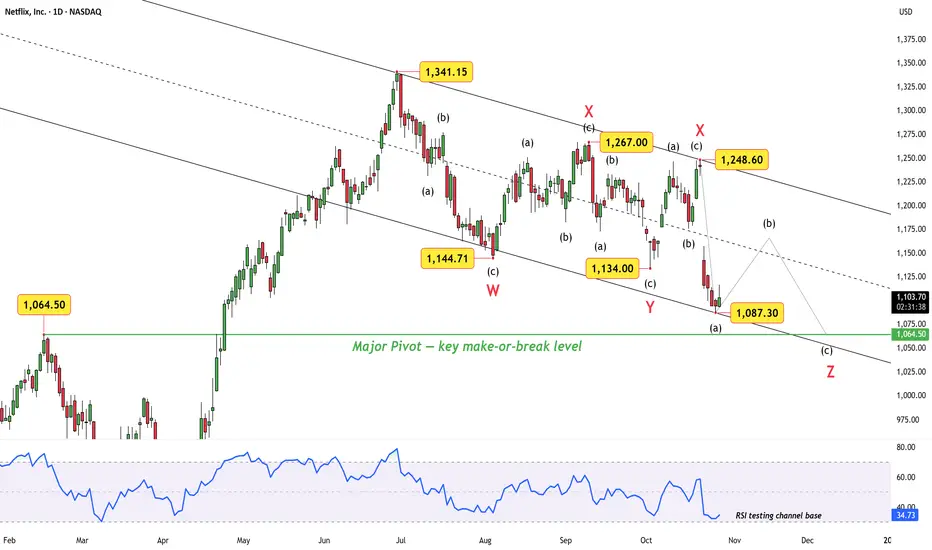
Netflix: Wave Z or a Surprise Truncation Ahead?After a textbook W–X–Y–X structure, Netflix now appears to be sketching the final leg “Z” inside a well-defined descending channel. Each corrective wave has respected the parallel boundaries — a sign of structural discipline rather than chaos.
The latest drop to $1,087.30 tagged the channel’s lower rail and the Major Pivot near $1,064.50, precisely where the RSI has also reached its long-term support zone. This alignment hints that the market may be nearing exhaustion — but whether it’s the end of “Z” or just a pause before one more flush remains the key question.
A sustained break below the pivot confirms completion of the triple correction, while a sharp rebound from here could mark a truncated Z, setting the stage for a larger recovery.
Disclaimer: This analysis is for educational purposes only and does not constitute investment advice. Please do your own research (DYOR) before making any trading decisions.
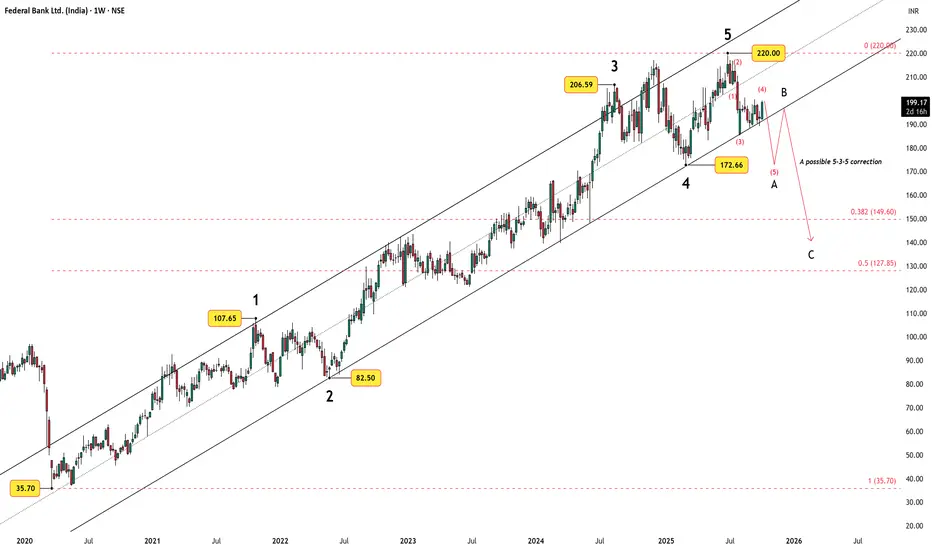
Federal Bank: Wave 4 Triangle Near Completion, Wave 5 AheadAfter a clean five-wave impulse from the 2020 low near ₹35.70 to the 2024 peak at ₹220, Federal Bank appears to be transitioning into a larger corrective phase.
Weekly Outlook
The broader structure suggests the start of a 5-3-5 zigzag correction , marked as A–B–C .
Wave A is still unfolding — only Wave 4 of A appears complete, with Wave 5 expected next to finish the first leg of the correction.
Once Wave 5 concludes, price could rebound toward the lower channel trendline to form Wave B, a counter-trend rally within the broader correction.
Thereafter, a deeper Wave C decline may follow, potentially stretching into the ₹149–₹128 zone, which aligns with the 0.382–0.5 Fibonacci retracement range of the 2020–2024 advance.
This developing structure reflects a natural pause after a long impulse cycle, with the market now transitioning into a corrective rhythm.
Daily Chart Details
Zooming in, the internal structure of Wave A shows a clear five-wave drop, with Wave (4) evolving as a contracting triangle pattern.
The MA50 has started curling toward the MA200, hinting at a possible bearish crossover — a classical confirmation of trend transition.
If price breaks below the triangle base, Wave (5) could extend toward ₹186–₹178, derived from Wave 1 projected from Wave 4’s end.
The targets will be adjusted once the final (e)-wave of the triangle is confirmed, as a minor uptick remains possible.
A sustained move above ₹206.39 would invalidate the immediate bearish setup and delay the decline.
Conclusion:
Federal Bank’s structure aligns with a typical post-impulse correction, and the interplay between Elliott Wave and moving averages provides a clear framework to track this phase.
Disclaimer:
This analysis is for educational purposes only and does not constitute investment advice. Please do your own research (DYOR) before making any trading decisions.
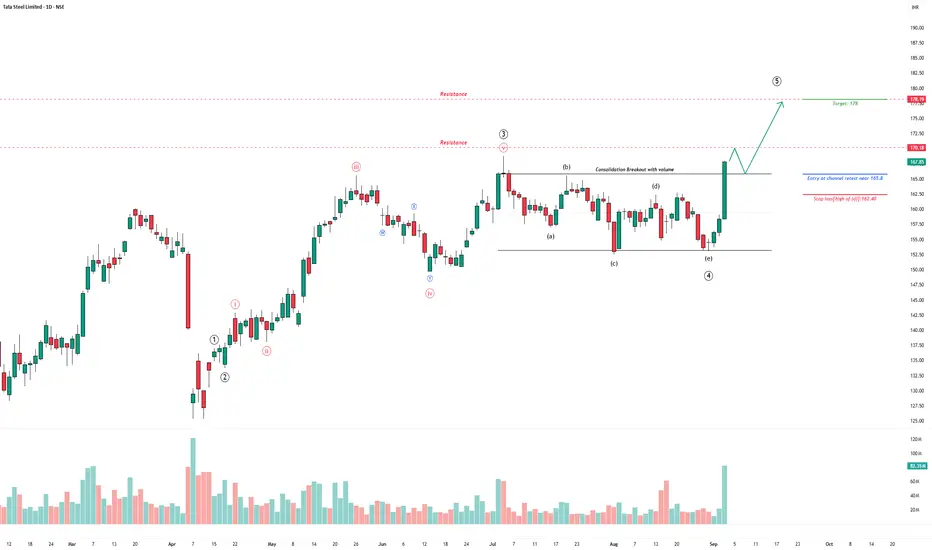
Tata Steel – Consolidation Breakout with VolumeAfter weeks of sideways price action, Tata Steel has broken out of its consolidation phase with a powerful surge in volume.
The breakout candle not only cleared the consolidation range but did so with conviction — volume spiked to multi-week highs, confirming participation. If price holds above the breakout zone, immediate resistances are lined up at ₹170 and ₹178.
Trade Plan
Entry on retest near ₹165.8.
Target: ₹178.
Stop-loss: ₹162.4.
Invalidation
A close below ₹162.4 would weaken the breakout narrative and invalidate this setup.
Disclaimer:
This analysis is for educational purposes only and does not constitute investment advice. Please do your own research and consult a financial advisor before making any trading decisions.
ICICI Bank marches upward, nearing major Fibonacci resistanceTopic Statement:
ICICI Bank continues its long-term bull run, supported consistently by technical levels, but now approaches a key resistance near the 1500 mark.
Key Points:
1. The stock trades reliably within a well-defined up-trending channel, maintaining long-term bullish structure
2. Price is repeatedly supported by the 50-day EMA, acting as a dynamic floor throughout its rallies
3. It has only dipped below the 200-day EMA during rare deep corrections, like the COVID crash of 2020
4. Based on the Fibonacci levels plotted from the 2020 correction, the 423.6% extension lies near 1500 — a level already reached, where the stock may now face stiff resistance

Flag breakout inside a long-term rising channel
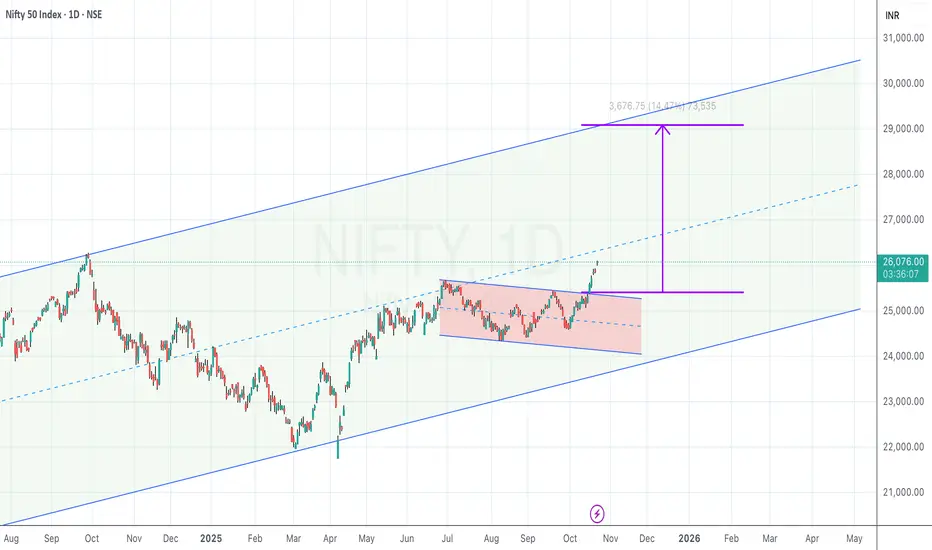
NIFTY spent the last few months in a falling/sideways range (highlighted box) within a larger rising channel.
Price has broken out on the upside and is pushing above the box top / local supply.
A classic measured-move from the height of the box projects ~3,650–3,700 pts higher, aligning with the upper channel—pointing to ~29,400–29,600.
Why it works
Structure alignment : Local flag breakout with the primary up-channel.
Confluence : Measured move ≈ upper channel touch, giving a logical exhaustion zone for profit-taking.
What can go wrong
False breakout : Quick rejection and close back under 25,700.
Macro/event risk : Gap moves around data/events can bypass stops—position accordingly.
Bias: Bullish while above 25,700 on daily closes.
This is a technical study for educational purposes, not investment advice. Manage risk.
BTC : RISING CHANNEL BREAK DOWN WITH 1:4 RR• BTC is trading inside upward trending channel from 17th October.
• Tried to break the channel top at 8.30 P.M. 21th October IST however breakout failed
• Big boys use this fake BO as liquidity trap and entered short.
continuous selling there after and now market testing the channel low.
• Underlying volume confirms the big boy's signature.
• At IST 11 a.m. market is trading near channel bottom.
• Go short if a candle close below 107450 with a sl 108250.
• All the three-target mentioned in the chart
• Trade with position sizing and psychology.
• Education purpose only.
• Happy trading.

Reliance eyes breakout as bulls return post earningsTopic Statement:
Reliance has gained bullish momentum following strong earnings and a market rally, now approaching a key resistance zone with breakout potential.
Key Points:
1. The stock is climbing toward a triple top formation, which carries a high probability of a bullish breakout
2. It is trading above both the 50-day and 200-day EMAs, indicating strength but also making it relatively expensive in the short term
3. Price continues to move comfortably within its established up-trending channel, maintaining a well-supported bullish structure

Can Fin Homes: Fifth Wave Ignites with Volume BoostAfter completing the third wave advance up to ₹817 and a corrective Wave (4) near ₹708, Can Fin Homes has broken past the prior swing high with a clean volume expansion.
Wave Structure
Impulse sequence from ₹615 (Wave 2) to ₹817 (Wave 3), followed by a deep yet proportional Wave 4.
The current move looks like Wave (5) unfolding with minor waves 1-2-3 already visible.
Price has cleared the swing barrier at ₹826 — watch for a healthy retest near ₹826–₹830 before Wave 4 of (5) and a final push higher.
Momentum Check
The volume spike adds conviction to the breakout, signaling genuine demand rather than a one-day pop.
Targets
Fibonacci projection 1.618 ≈ ₹932 marks the next logical resistance zone.
Invalidation
A sustained drop back below ₹817 would question the breakout and delay the fifth-wave progression.
Strategy
Stay bullish, but don’t chase — let price retest the breakout zone before fresh entries.
Disclaimer : This analysis is for educational purposes only and does not constitute investment advice. Please do your own research (DYOR) before making any trading decisions.

NiftyPvtBankThe private bank index, currently around 28,427, has been steadily rising since June 2024.
The stocks accumulated by big players last year are now witnessing strong follow-up buying in 2025.
The trend clearly points toward a potential move to the 29,800–31,100 zone.
Bulls need to defend the 27,300 level — any mild retracement toward this area could offer a good opportunity to add near the stop-loss.

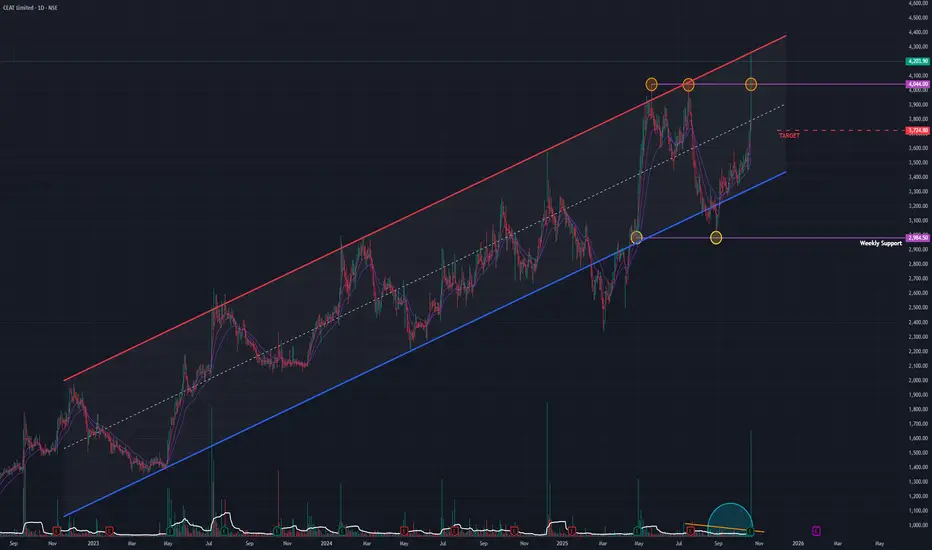
CEAT (D) - Critical Crossroads: Breakout vs. Channel ReversalAfter a multi-year uptrend, CEAT Ltd has arrived at a major inflection point. While it has broken a key horizontal resistance and hit a new all-time high, it has also run into the upper boundary of a long-term channel, a point that has historically marked a reversal. This creates a classic standoff between two powerful technical signals.
The Bullish Case: The Breakout
The primary argument for the bulls is the recent show of strength and the clearing of a significant hurdle:
- New All-Time High (ATH): The stock has successfully pushed into new territory, which is an inherently bullish sign.
- Horizontal Breakout: It has decisively broken out and closed above the horizontal resistance line formed by both the previous ATH and the upper limit of its recent consolidation phase.
- Consolidation & Dry Volume: Prior to this move, the stock was in a healthy consolidation phase since April 2025, during which volume was drying up . This is a classic sign that selling pressure was diminishing, often setting the stage for an upward move.
The Bearish Case: The Channel Resistance
Despite the breakout, the stock is still operating within the rules of a much larger, long-term pattern:
- The Parallel Channel: Since April 2020, the stock has been trading within a well-defined ascending parallel channel . It has consistently respected the upper trendline as a point of strong resistance and the lower trendline as support.
- Rejection at the Top: Today, by hitting its new ATH, the stock has also simultaneously hit the upper resistance trendline of this channel . Historically, every time the price has reached this boundary, it has reversed and trended back down towards the channel's support.
Conclusion and Key Scenarios to Watch
The price action in the next few trading sessions is critical and will likely resolve this technical conflict.
- Bullish Breakout Scenario: For the uptrend to accelerate, the stock must do something it has never done: achieve a decisive, high-volume close above the upper trendline of the parallel channel . If this occurs, it would invalidate the channel pattern and could signal a powerful new leg up, with a potential target of ₹5,100 .
- Bearish Reversal Scenario: If history repeats itself and the channel resistance holds, the stock will likely be rejected from this level. A failure to stay above the recent horizontal breakout would be the first sign of weakness, potentially leading to a reversal back down to the channel's median, around the ₹3,725 level.
In short, the market is at a "prove it" moment. The bulls have broken a minor resistance, but the bears are defending a major long-term boundary. The winner of this battle will likely dictate the trend for the coming months.
Nifty Mad Bull Unleashed !! 30000Nifty has Broken out of The Falling Trendline after testing the Bottom of the Rising Parallel Channel!
Ready to test ATH with Target set at 30,000ish
🐂
No Rocket Science Simple Tech Analysis
Every Dip Can be Bought!

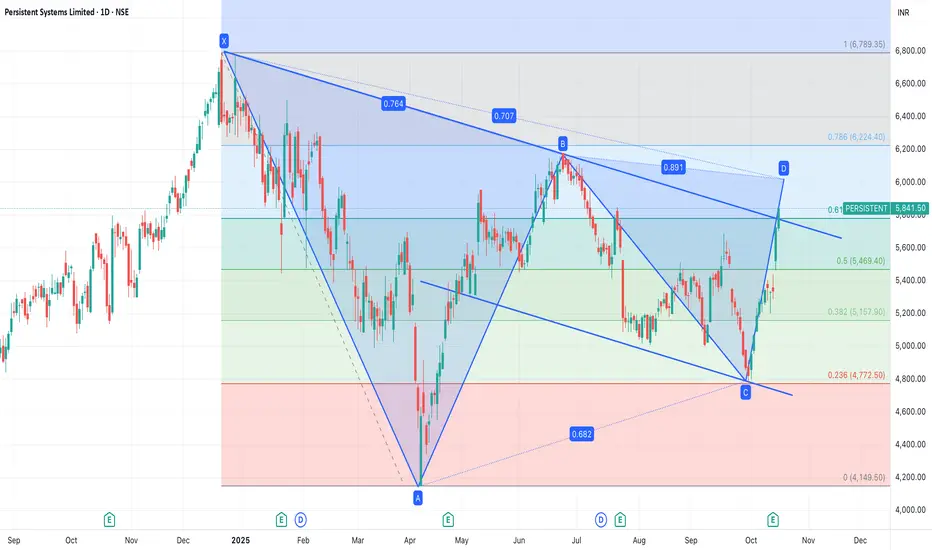
Persistent Systems Breakout parallel channelPersistant system has given a breakout and now I think it is ready to break its 52 week high. It will cross 6800-7000 is possible.
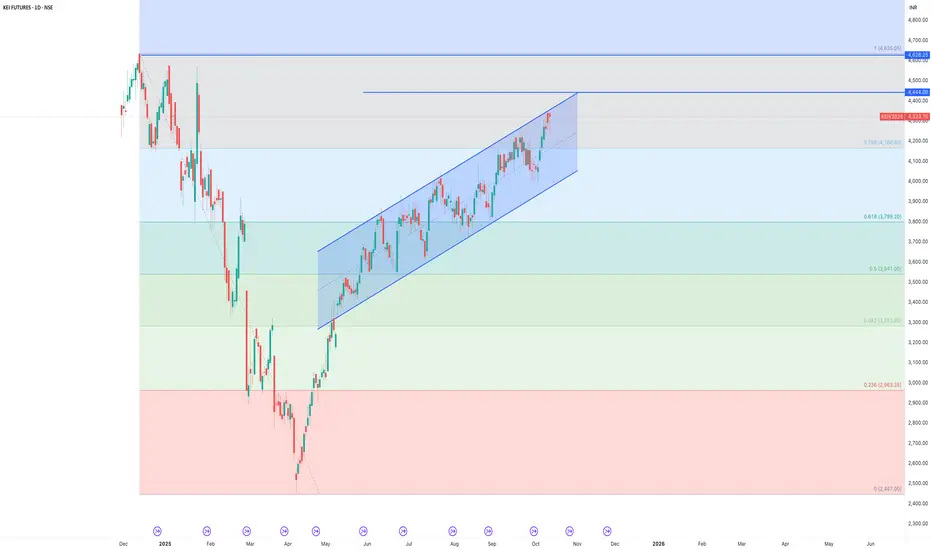
KEI in parrallel channel breakout possibleKeep ann eye on KEI industries breakout possible and it may touch or break previous 52 week high.
4650-4700 possible targets.
Eternal (D) - Hits New High But Stalls at Channel ResistanceZomato has been trading in a predictable, well-defined pattern, but recent price action, including a new all-time high today, is showing significant signs of exhaustion that could signal a short-term reversal.
The Ascending Channel
Since July 2025, the stock has been trading within a clear ascending channel , consistently respecting the upper boundary as resistance and the lower boundary as support. This pattern has provided a reliable roadmap for the stock's trajectory.
Today (Tuesday, October 14, 2025), while the stock did register a new All-Time High (ATH), it importantly failed to break out of the channel's resistance and was rejected from this upper boundary. This price action suggests that selling pressure is emerging at this predictable level.
Warning Signs of Waning Momentum
Several indicators support the view that the current up-move is losing steam, despite the new high:
- Bearish Divergence: The Relative Strength Index (RSI) is in a "lowering state" while the price is making new highs. This is a classic bearish divergence , a strong indicator that the underlying momentum of the trend is weakening.
- Declining Volume: The recent rally towards the top of the channel has been accompanied by decreasing volume, which suggests a lack of strong conviction from buyers at these higher levels.
While the short-term EMAs remain in a bullish state, the rejection at resistance combined with these warning signs presents a compelling case for a potential pullback.
Outlook
Based on the consistent channel pattern and the clear signs of weakening momentum, the most probable scenario is that Zomato will reverse from this resistance level and trend down towards the channel's support line.
The key action to watch for in the coming days is a confirmation of this reversal, such as a close below today's low or the formation of a strong bearish candle. A decisive, high-volume breakout above the channel's resistance would be needed to invalidate this bearish outlook.

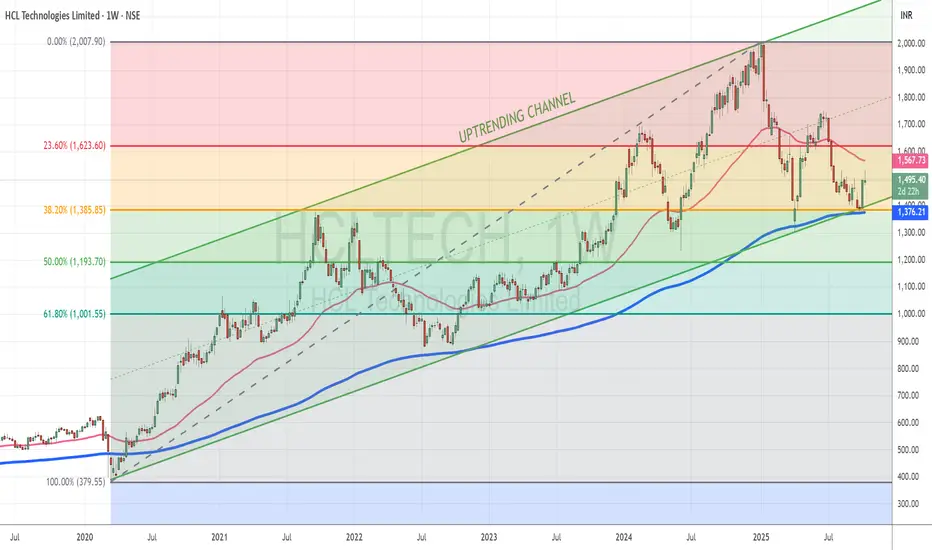
HCLTech shows signs of reversal after global-policy-driven correTopic Statement:
HCLTech, like other IT peers, has been dragged down by global economic policies but now shows early signs of recovery from key support levels.
Key Points:
1. The stock corrected down to the 38.2% Fibonacci retracement level at 1385, where it found strong support
2. Price reversed after touching the lower boundary of its bullish channel, reinforcing the trend structure
3. Currently trading below the 50-day EMA, the stock is oversold in the short term and presents a possible accumulation opportunity
VBL Looking Bearish??!!!VBL - On Weekly timeframe,
Inverted cup&handle pattern and a breakdown visible!!! (shown below)
On Dailytimeframe,
VBL is travelling inside a Descending channel pattern making highs and lowerhighs...lows and lowerlows...
SL & Target levels shown @ chart!!!
Let's wait & watch!!!
Thank you!!!
Just my view...not a tip nor advice!!!!

BTC: TEST OF RISING CHANNEL TOP AND POSSIBLILITY OF FREE FALL• BTC is trading in an upward trending channel for the last 4 years.
• It has recently tested the channel top in the last 4 months.
• 3 attempts made to break the channel top, but it fails to sustain above 125000.
• Aggressive selling happens in last week pushing the price near short term channel bottom.
in.tradingview.com
• Looking at the intensity of selling it seems it would break the short time frame channel bottom near 108500.
• Long term short position could be initiated with a target of T1 near channel mid-point and T2 near channel bottom 55000.
• Like to sell long team CE with high premium once the short term channel bottom broken.
• Play with money management and keep psychology intact.
• Educational purpose only.
• Happy trading.
