TREL / TransIndia Real Estate Ltd - 4 Months Consolidation Break1) Time Frame - Weekly.
2) 4 Months consolidation breakout in weekly with huge bullish candle and volume.
3) Since the stock moves in an uptrend channel it will find its resistance around the price (67).
4) Recommendation - Strong Buy
Parallel Channel

Nifty Weekly View- Three PatternsNifty Weekly View 📊
In this insightful analysis of the Nifty, we'll explore three crucial patterns that are currently dominating the charts. These patterns provide valuable insights into the future direction of this key market index. 📈🧐
1. Ascending Triangle Pattern (Yellow Highlighted) 📈
Ascending triangles are bullish chart patterns characterized by higher lows and higher highs within a narrowing range. This pattern signifies increasing buying pressure, with buyers showing a willingness to enter the market at lower prices while sellers are content to sell at higher prices. It's a strong indication of positive sentiment. 📈📈🚀
++ Nifty has formed an Ascending Triangle breakout and its in Bull control
2. Channel Formation (Blue Highlighted) 📊
An upward channel, another bullish chart pattern, takes shape when prices move within a confined range defined by parallel trendlines. The upper trendline represents resistance, while the lower trendline signifies support. This pattern reflects a balanced power dynamic between buyers and sellers, with buyers stepping in at lower prices and sellers offloading at higher prices. A clear sign of market stability. 📊💹🛡️
++ Nifty is travelling in an upward channel and approaching the upper trendline of channel plus its above the centre line of the channel. Again bull is taking control.
3. Rising Wedge (Pink Highlighted) 📉
On the flip side, a rising wedge is a bearish chart pattern where prices create higher highs and higher lows, but the upper trendline steepens more rapidly than the lower trendline. This indicates mounting selling pressure, as sellers become increasingly willing to sell at higher prices. A potential bearish signal to watch out for. 📉📉📉💔
-- Nifty has some underlying issues of forming an internal rising wedge, though it gets activated below 19200 only, so its far away from present levesls.
Now, let's discuss the potential price movement of Nifty for the remainder of 2023 based on these patterns. If Nifty manages to hold above the crucial 19,200 levels on a daily closing basis, we could witness an upward rally. 📈💼💼
Expected Targets with Dates 📆
First Target - 20,453 by 9th Oct'23 🚀🎯
A promising start to the upward momentum.
Second Target - 21,224 by 6th Nov'23 🌟💫
Steady progress towards higher levels.
Final Target - 22,420 by 26th Dec'23 🎯🎉
A potential year-end surge.
As we closely monitor these patterns and targets, remember that the world of technical analysis is dynamic and ever-evolving. Keep learning and stay tuned for further updates. Your comments and insights are always appreciated. 📚📈💬👀

05 Jan ’24 —Nifty50 takes support at the trendlineNifty Analysis - Stance Neutral ➡️
Recap from yesterday: “The first thing we had to do was to change the stance from bearish to neutral. To go bullish we need some more momentum, if it comes up in the forenoon session — I will update you via TV minds.”
4mts chart link
Two things happened today
A gap-up open - which did not make any sense.
The rejection from the trend line - that made every sense.
We repeated this earlier - our markets may be the only one that frequently opens gap-up or gap-down. The bulk of the action happens outside of the trading hours - seems like we need to grow up & mature. Today’s gap-up did not make any sense, even the opening candle. By 10.35 we lost the steam and started falling. Took a minor pause at 11.15 and then by 13.55 we went underwater.
We got a nice rejection right at the trend line between 14.15 to 14.31. We are quite sure that many traders would have thought we might be falling further and that's when the reversal came. It was so intuitive to watch Nifty50 take support at the trendline and retrace the fall. Finally, we ended the day with a gain of 0.24%
63mts chart link
Our stance is still neutral with equal possibilities in either direction. Since Nifty50 is following the ascending channel’s top trend line - the chances of going up look more probable. To go down - we need news flow/event as there is no technical weakness.

GUJRAT GAS PARALLEL CHANNEL BREAKOUTGujrat gas breking a parallel channel
on #weekly basis with good volume
#target r mentioned in chart
EDUCATIONAL IDEA ONLY

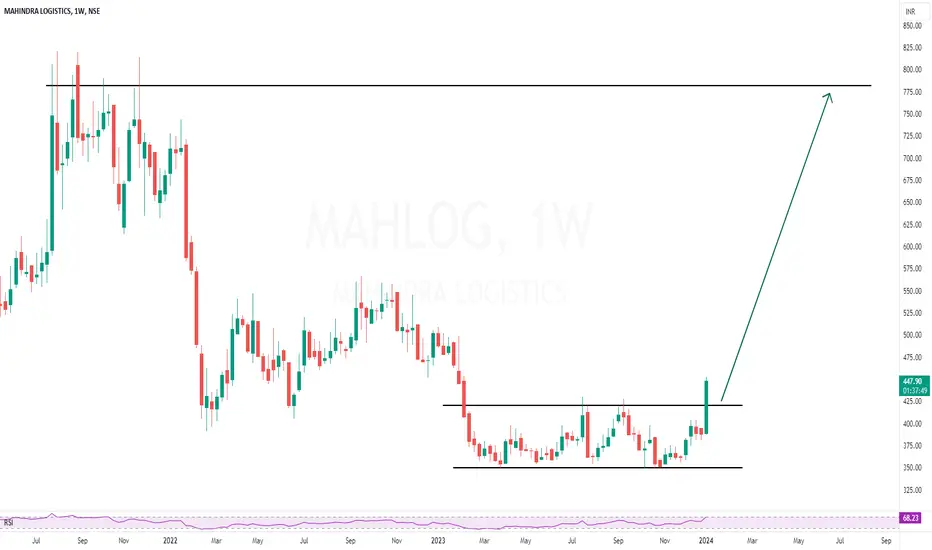
MAHLOG | The perfect weekly close that we wantMAHLOG | The perfect weekly close that we want
Looks like the stock is bottomed out and new trend is taking place
CMP : 448 (Dip : 420)
SL : 375
Target : 780
#Lead

04 Jan ’24 — Unexpected reversal takes out my Stop Loss - NiftyNifty Weekly Analysis
Between the last expiry and today, Nifty50 has fallen only 99pts ~ 0.46%. Credits to the recovery today that made up 141 of the lost points. N50 also has managed to bounce off the channel top line indicating further signs of strength.
63mts chart link
Nifty Today Analysis - Stance Neutral ➡️
Recap from Yesterday: “On the higher time frame, you can see how N50 is just entering the channel. If the conditions stay like this for tomorrow — we can see a good trending move tomorrow. The first threat to keep in mind is the rejection that came on 21st Dec when N50 bounced from the channel topline.”
4mts chart link
We were totally shocked to see a gap-up open of 89pts ~ 0.42% followed by a strong intent to go up. Since yesterday, we have been looking for bearish opportunities and what the gap-up open did was to take out the stop loss. Just like the 21st Dec, we got a perfect bounce off from the trend line showing sheer strength.
Bears like me got trapped and were running for cover, this made the followthrough rally much easier today. A total swing of 161pts ~ 0.75% for today. And that too when NiftyIT was flashing red and green. BankNifty took the bulk of the weight today.
63mts chart link
The first thing we had to do was to change the stance from bearish to neutral. To go bullish we need some more momentum, if it comes up in the forenoon session - I will update you via TV minds. Kindly make sure you are following @viswaram handle to get the updates via email.

Suzlon Resistance BreakoutNSE:SUZLON has given a Breakout from it's Resistance Levels after retesting its support for multiple time; may go to Target of Rs. 43.

Indiabulls real estate for longThe chart looks good because of following reasons:
1. Crossing above all EMAs in monthly, Weekly & Daily TF.
2. Breaking out of Parallel Channel
3. Near previous swing highs
4. Good Volumes near top line of parallel channel.
5. Good reward Ratio
Tomorrow's weekly close will decide whether the plan is activated or not.

Dharmaj- c&h breakoutDharmaj- Textbook Cup and handle formation done on daily. Went into a parallel channel while forming handle. Today slight breakout of parallel channel is done.Still Entry should be taken only after weekly close above 280 only for the target of 400.
Note: This is for educational purpose only.

Gulf Oil Lub - Falling channel patternGulf Oil Lubricants India Ltd - CMP: 464
Technically:
Falling Channel Pattern
Consolidating in a zone for some months now
Ideal time to accumulate for long term
Target 1: 558
Target 2: 673
Target 3: 838
Stop Loss: 375
Fundamentally:
Strong Promotor Holding
The Co has bought back its 14,16,667 equity shares at Rs 600 per equity share in cash on Feb'22
Consistency in Net profit
Undervalued Stock

channel breakout - GNFCPlease look into the chart for a detailed understanding.
Consider these for short-term & swing trades with 2% profit.
For BTST trades consider booking
target for 1%-2%
For long-term trades look out for resistance drawn above closing.
Please consider these ideas for educational purpose
Please note that, if there are some big targets, those are drawn thinking for long term.

GPIL - SWING TRADE - 18th December #stocksGPIL (1D TF)
Swing Trade Analysis given on 18th December, 2023 (Monday)
Pattern: ASCENDING CHANNEL
- Breakout of Resistance - Done ✓
- Retracement & Consolidation - In Progress
#stocks #swingtrade #chartanalysis #priceaction #traderyte #gpil

CASTROL INDIA BUY @ 179.75 RS
TARGET @ 252.25 RS
BUYING CONFIRMATIONS: Cup with handle + monthly channel breakout
Expected returns are around 40.00 %

GUJGASLTD | Channel breakout ahead - Looks good for 60%GUJGASLTD | Channel breakout ahead - Looks good for 60%
Attempt to take long position once again in this stock. It is one of the dragger in portfolio so far.
CMP : 460
SL : 430

IPL (Indian Pesticides Ltd.) - Weekly Breakout Potential upside in IPL - Indian Pesticides Ltd. in the weekly timeframe.
Good fundamentals and nice clean breakout in a higher timeframe (Weekly).

GAIL - Multi-year breakout in Monthly TimeframeGAIL has showcased a remarkable multi-year (16 years) breakout, establishing itself as a standout performer in the financial markets. This breakthrough is not merely a fleeting uptick but signifies a strategic ascent by successfully breaching key resistance levels that had acted as formidable barriers for 16 years.
Worth noting - VOLUMES Surge: What sets this breakout apart is the substantial surge in trading volumes accompanying the upward move. The volume increase provides a compelling validation of the market's confidence and reinforces the conviction behind the stock's newfound trajectory.

inverted head and shoulder breakout trading opportunity entry above the line
stop below the line
inverted head and shoulder breakout
and long-term consolidation breakout

consolidation breakoutConsider this as my own diary and not as a buy/sell recommendation service. I don't advise
consolidation breakout
entry above the line
stop below the line
stage upon the stage ( bullish pattern)
stock in stanweinsteinstage stage 2

27th Dec ’23 -BankNifty gets a NEW ATH inside the ASC. channelBankNifty Analysis
BankNifty is still caught between the upper & lower end of the ascending channel. Even then it managed to scale to a new all-time high of 48347. Half of the traders would have thought BN would have expiry today, the best way to remember would be to use post-it-notes saying BN expires with Nifty on the last week of the month.
4mts chart link - click here
BN also had a slight gap-up, but the leg1 of the rally was quite strong. We gained 480pts ~ 1.01% till 12.07 before giving away 356pts ~ 0.74%. Leg2 it rallied 458pts ~ 0.96% but not enough to break out of the channel top line.
63mts chart link - click here
Once BN got back into the channel - it is finding it difficult to break down or break away. Somehow the boundaries are getting respected. BN hitting a new top ensured that the stance changed from neutral to bullish. I am seriously thinking if the momentum is intact we should be getting that channel breakout tomorrow. Since it is a monthly expiry a bit of volatility cannot be ruled out as well.

26th Dec ’23 - BankNifty stance changed to neutral, IV going upBankNifty Analysis
Was quite surprised to see BankNifty following the ascending channel’s bottom trendline with a near correlation. Only for a brief period, we traded in RED, once BN pulled itself above water - it was able to hold its level quite strongly.
4mts chart link - click here
KOTAKBANK, AXISBANK, and HDFCBANK were trading in green giving BN a much-needed green cushion. Even then there was no strong bullish momentum today - it was just that the bears did not have any control today.
63mts chart link - click here
On the higher timeframe, BN is still inside the ascending channel. The bears are unable to exert any pressure post 20th December. Since BN is not ceding ground, I have to change my status from bearish to neutral for tomorrow. This week BankNifty and Nifty are expiring together on Thursday, which means we have no instruments expiring tomorrow 27th Dec.
India VIX rose 7.08% today almost touching the 15 levels. Looks like VIX is creating an interim bottom. My EMA’s will show a golden crossover in 2 days if we continue the rising trend. After the news broke out about the drone attack on 2 vessels carrying Indian nationals - I seriously thought we would have a negative reaction today. Seems like the markets were not at all bothered. My next question is, will the market react to this news tomorrow? - “blast outside the Israel embassy in Delhi”
VIX 1D chart - click here

MANAPPURAM - SWING TRADE - 23rd December #stocks#MANAPPURAM (1W TF)
Swing Trade Analysis given on 23rd December, 2023
Pattern: ASCENDING CHANNEL BREAKOUT
- Breakout of Channel Resistance - Done ✓
- Volume Spike Buildup - Done ✓
- Retracement & Consolidation - In Progress
#stocks #swingtrade #chartanalysis #priceaction #traderyte

BHARTIARTL - Weekly Breakout Clean weekly breakout in BHARTIARTL - Great fundamentals and excellent upside potential. Good time to enter.
