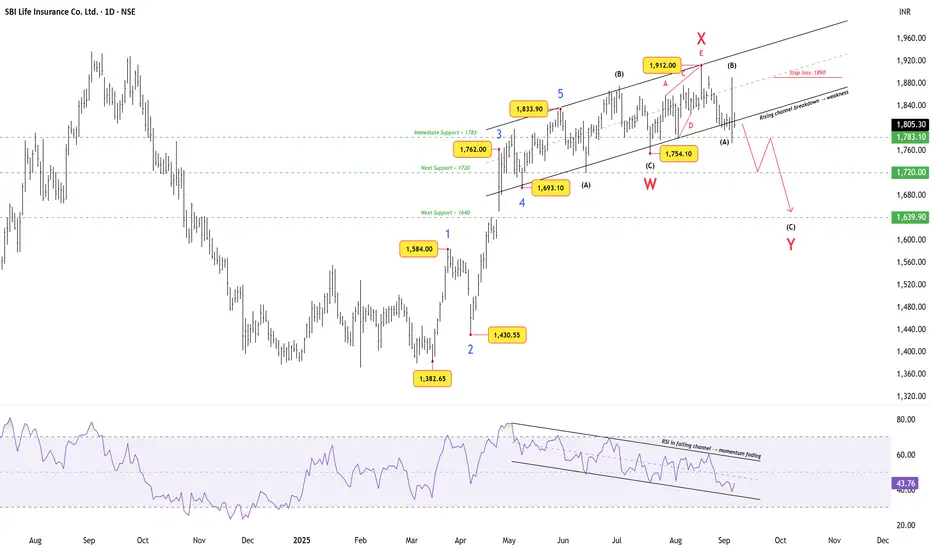
SBI Life Insurance – Rising Channel Breakdown with RSI WeaknessThe stock completed a clear 5-wave impulse from ₹1,382.65 to ₹1,833.90 .
Since then, the structure has turned corrective, unfolding as a possible W–X–Y pattern.
Price action:
Price broke below the rising channel , signaling fading momentum.
Immediate support lies at ₹1,783 , followed by ₹1,720 , and a deeper level near ₹1,640 .
RSI observation:
RSI has been sliding inside a falling channel since May, confirming weakening strength.
Current reading is ~43.7, suggesting momentum is fading further.
Trade bias:
As long as price remains below ₹1,890 (stop-loss / invalidation), the structure favors further downside.
Breakdown continuation could lead toward the ₹1,640 zone, which aligns with the projected end of Wave Y.
Disclaimer: This analysis is for educational purposes only and does not constitute investment advice. Please do your own research (DYOR) before making any trading decisions.
Parallel Channel
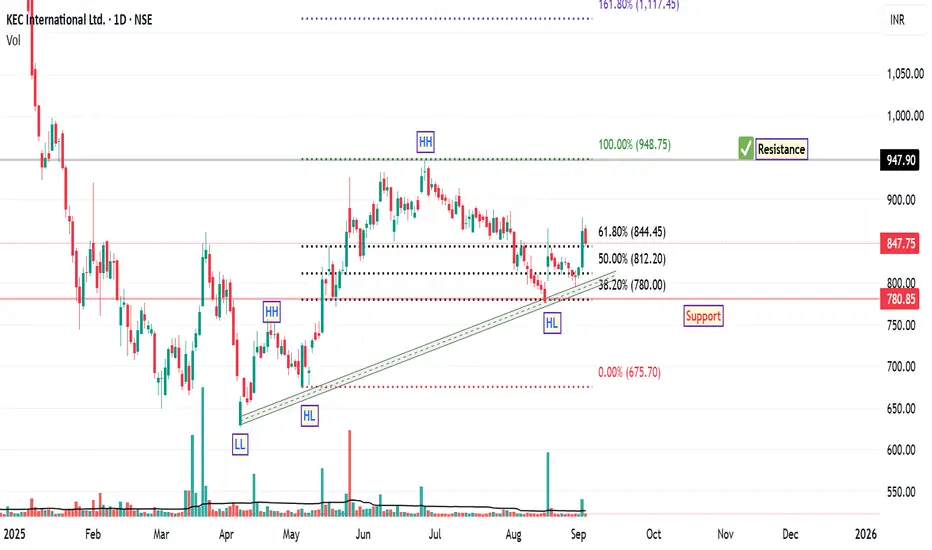
KEC International: Bullish Structure with StrengthSince April 7th, the price structure of KEC International has demonstrated a notable bullish trend reversal, characterized by the formation of higher highs and higher lows along an ascending trendline. This pattern is often interpreted by technical analysts as a sign of strengthening upward momentum.
A recent Fibonacci retracement, drawn from the swing low to the swing high of the current rally, revealed a pullback to the 38.2% level—a zone commonly viewed as a potential support area within a prevailing uptrend. The stock responded positively to this level, rebounding and subsequently closing above the 61.8% retracement level, which is another key technical threshold.
Interestingly, the price has retested the 61.8% level and held firm, suggesting that this area may be acting as a support base. Additionally, the stock has managed to close above its 200-day EMA, a long-term trend indicator that many market participants use to assess broader directional bias. A sustained position above the 200 EMA is generally considered constructive from a trend-following perspective.
From a structural standpoint, based on current chart dynamics, the next potential resistance zone appears to be near ₹948, while the suggested support level is around ₹780 . These levels are derived from historical price action and technical confluence zones, and may serve as reference points for monitoring future price behaviour.
Disclaimer: This analysis is intended solely for educational and informational purposes. It does not constitute investment advice or a recommendation to buy, sell, or hold any financial instrument. Market conditions are subject to change, and trading decisions should be made based on individual research, risk assessment, and consultation with a licensed financial advisor.
Coal India – Breakout or Fakeout at Key Resistance?Chart Context
Coal India has been stuck inside a descending channel, completing what looks like a W–X–Y corrective structure. The recent surge has now brought price face-to-face with the MA100 and MA200 , both acting as strong resistances.
What the Chart Shows
MA100 & MA200: Price is testing these moving averages. Sustained strength above this zone is needed to confirm a real breakout.
Volume: A noticeable spike has supported the latest move, which adds credibility to the attempt.
RSI: Momentum has crossed above 50, shifting the bias, but confirmation requires follow-through.
Neutral Stance
At this stage, the setup can go either way. A clean breakout and hold above the MAs could mark the start of a fresh impulse. Failure to sustain would make this just another bounce inside the corrective structure.
Takeaway
It’s a wait-and-watch situation. Let the next few sessions decide whether this is the start of a new trend — or just a fake breakout.
Disclaimer: This analysis is for educational purposes only and does not constitute investment advice. Please do your own research (DYOR) before making any trading decisions.

BSE Ltd – Corrective W–X–Y In ProgressThe previous impulsive wave topped at ₹3030, marking an all-time high.
Since then, the structure has unfolded as a W–X–Y corrective double three. The market is now progressing within Wave Y, with Wave (a) already driving price down to ₹2090.
For Wave (b), watch for price rejection either at the midline of the channel or the upper boundary. A rejection from these levels should lead Wave (c) lower, targeting the 0.5–0.618 retracement zone between ₹2128 and ₹1915, where Wave Y may complete.
RSI is oversold and continues to print lower lows, showing no bullish divergence yet — momentum still favors the bears.
Bearish invalidation sits at ₹2550 — any sustained move above this would negate the immediate bearish view.
Disclaimer: This analysis is for educational purposes only and does not constitute investment advice. Please do your own research (DYOR) before making any trading decisions.

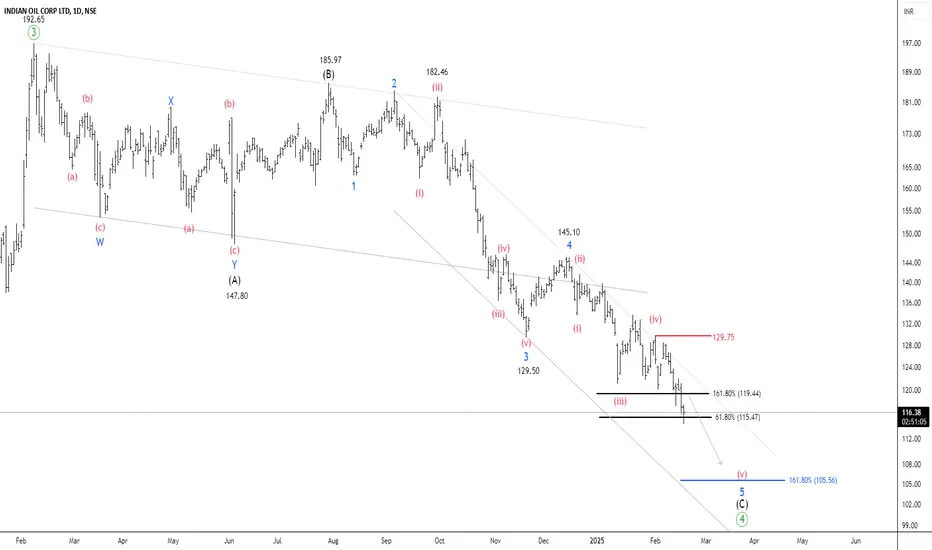
NSE IOC – Approaching a Key Demand ZoneTimeframe: Daily
After reaching a high of 196.8, the price has declined by over 39% in 13 weeks. It is currently trading below the 50/100 EMA band, with ATR at 3.68 and ADX at 26.02 . According to the Elliott Wave projection, the peak of 196.80 can be identified as a wave ((3)). The security is currently undergoing the formation of a corrective wave (4).
Wave (B) formed at 185.97 , while wave 4 of wave (C) was completed at 145.10 . NSE IOC is now setting up for the final wave 5 of wave (C).
Two key Fibonacci relationships help estimate the end of the correction:
1.618 Fibonacci extension of wave (A) at 106.54 (for wave C)
0.618 Fibonacci extension of wave 1 at 115.52 (for wave 5)
The price is expected to settle between 115 and 105 , which serves as a key demand zone for buyers. If the price breaks out and sustains above 129.75, traders can target the following levels: 139 – 156 – 172+.
we will update further information soon.
United Breweries – Confluence of Supports Testing Bulls’ NerveThe stock has completed a clear 5-wave impulse into the 2182.45 high. Since then, price action has unfolded into a complex W–X–Y corrective structure.
Now, price is testing a confluence of supports — the strong demand area, channel bottom, and the rising 200-week MA. This cluster raises the probability of a bounce, which may mark the beginning of Wave X2/1.
The 200-week MA serves as dynamic support and a trailing stop, while the hard invalidation remains at 1810 . A decisive close below this level would negate the bullish scenario and signal deeper weakness.
Summary:
Completed 5-wave advance into 2182.45
Current correction unfolding as W–X–Y
Multiple supports aligning (MA200 + channel + demand area)
Bounce potential into Wave X2/1
Dynamic stop: MA200 | Hard invalidation: 1810
Disclaimer: This analysis is for educational purposes only and does not constitute investment advice. Please DYOR before making trading decisions.

Sensex - Monthly expiry analysis Aug 26Price is moving in a channel, and it can give choppy moves. 81500 is a strong support zone. The daily chart shows an inside bar formation.
Buy above 81580 with the stop loss of 81460 for the targets 81700, 81780, 81900, 81980, 82120, and 82300.
Sell below 81300 with the stop loss of 81420 for the targets 81200, 81120, 81040, 80920, 80800, and 80660.
Always do your analysis before taking any trade.

OlectraThis is bullish parallel channel formation breakout on the upper edge. Though weekly/monthly closing above the supply area 1530-1460 is very important here. However the recent move above 1350-1270 gave good strength to the bulls.
Consider it with time frame of 1.5 yr-2 yrs and stop loss 1280
2000 looks promising in next 6 months

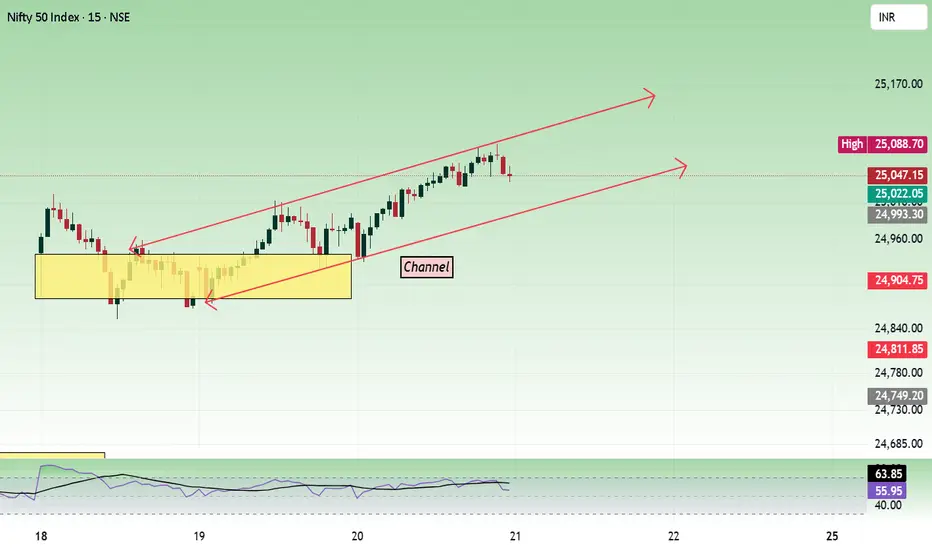
Nifty - Expiry day analysis Aug 21Today price took support from the 24900 zone and moved up. Movement was with less trend strength. If the price does not gain strength, we can expect a range move between 24900 to 25100 levels. 25000 is a strong support.
Buy above 25020 with the stop loss of 24970 for the targets 25060, 25100, 25160, and 25220.
Sell below 24900 with the stop loss of 24950 for the targets 24860, 24800, 24760, and 24700.
Always do your analysis before taking any trade.
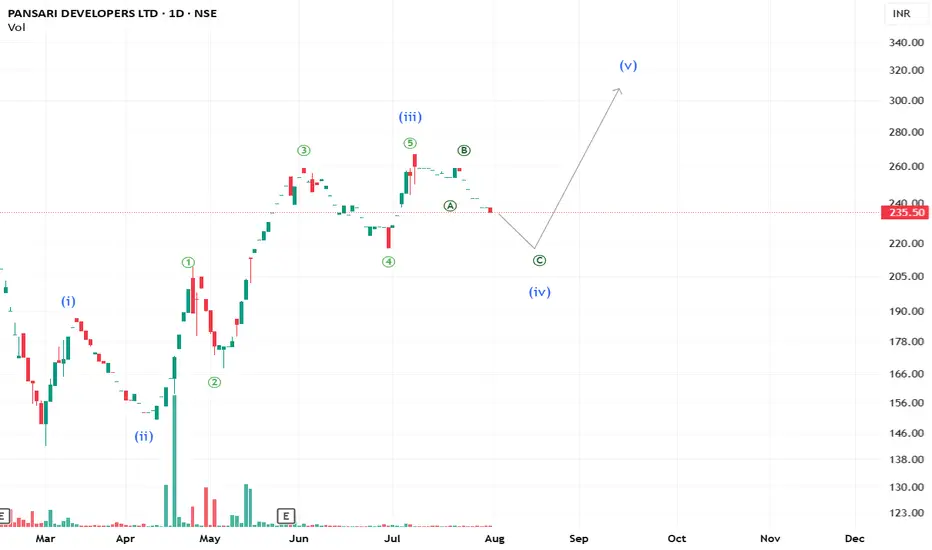
Has the time come for Pansari Developers?What we see is the beauty of the wave principle — a perfectly formed Impulse structure with #pansaridevelopers poised to move higher. However, a confirmation is still needed as the stock is relatively illiquid.
**This is an educational market outlook, not investment advice. Please consult a SEBI-registered advisor before taking any investment decisions.**
UNHUNH has been forming parallel channel since 2016. Also it has a bigger Parallel channel on large time frame as well. which means it is making large time up move after consolidation.

GODFRYPHLPthough it took complete 25 year but parallel channel completion truly gives satisfaction.
This journey has been really great when I added at 1200 in 2019.
Though I don't have any tgt left but money has given 350% absolute return

CocaColaDid the big hand selling the coca-cola stock at this point of time.
Though it's very difficult to identify the next move however this is just a try to find the distribution in price

UltraTech Cement Rides Strong Bullish Channel, Eyes Breakout BeyTopic Statement:
UltraTech Cement continues its bullish run, driven by consistent growth and cement’s critical role in construction-led demand.
Key Points:
1. The stock moves strictly within a well-defined uptrending channel, making it highly suitable for channel-based trading
2. It rarely dips below the 200-day EMA, and prices near this level have historically presented strong investment opportunities
3. The price is currently facing resistance at the 12000 mark, but a weak breakout appears to be underway, signaling potential continuation

LICI Shows Minimal Gains Since IPO, Moves Weakly Within Broad ChTopic Statement:
Nearly three years after its IPO at 870, LICI trades only slightly higher, reflecting the limited post-listing returns even for a market giant.
Key Points:
1. The stock is moving in a weak uptrending bullish channel, offering modest directional cues
2. It retraced to the 61.8% Fibonacci level where it received support and has since rebounded
3. Price now faces resistance at the 38.2% retracement level near 955, creating a ceiling for upward movement
4. Accumulating the stock below the 50-day EMA presents a more favorable risk-reward entry point

BATAINDIA LONGThe Elliott Wave Theory's description of the structure and pattern of price movements in financial markets is known as the Elliott Wave Structure.
The Elliott Wave analysis indicates that the stock has completed waves (i) and (ii), which are shown as blue numbers on the daily chart. Wave (iii) appears to be underway at this time.
Wave (iii), also known as the impulse wave, unfolded into five waves, which are illustrated in red.
Wave levels are depicted on the chart.
An inverted Head and Shoulder Pattern is formed on the chart and the target is shown on the chart. (The Inverted Head and Shoulder Pattern is a bullish reversal pattern).
Level of Invalidation
The invalidation level of 1269 has been identified as the start point of wave (i). If the price falls below this level, it means that the projected Elliott Wave pattern is not as it appears.
I'm not a registered Sebi analyst. My research is done solely for academic purposes.
Please consult your financial advisor before trading or investing. I bear no responsibility for your profits or losses.
Regards,
Dr Vineet

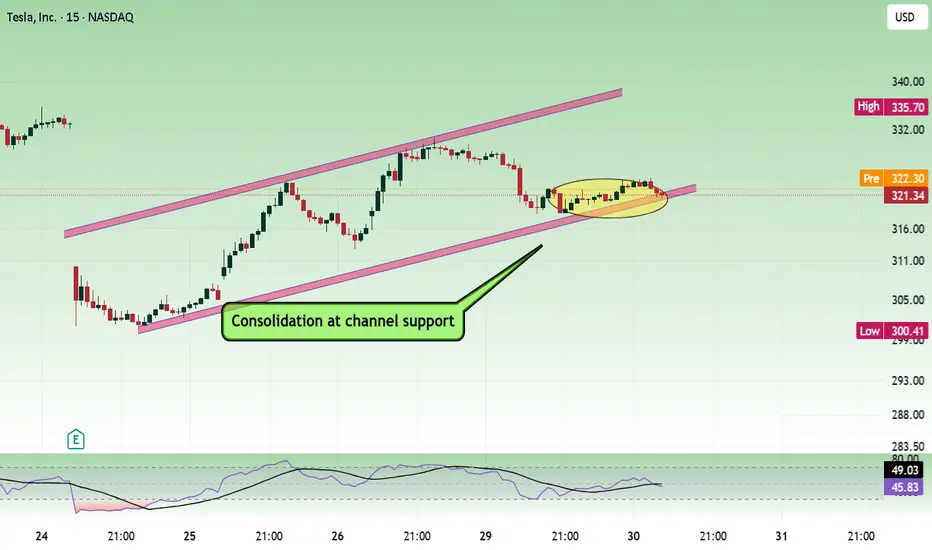
TeslaAs per the pattern formation, price is moving within an ascending channel and also consolidating at the lower trend line of the channel. If price gains strength, it can move towards upper trend line of the channel.
Buy above 324 with the stop loss of 321 for the targets 327, 330, 332 and 336.
If channel support is not holding and price gains bearish strength, can sell below 318.
Sell below 318 with the stop loss of 321 for the targets 315, 312, 309 and 306. 300 - 302 is a strong support zone.
Always do your own analysis before taking any trade.
LT Jumps on Strong Q1 FY26 Results, Continues Steady Climb WithiTopic Statement:
LT surged nearly 6% after posting impressive Q1 FY26 earnings, reinforcing its position within a mildly bullish up-trending channel.
Key Points:
1. The stock may experience temporary bullish momentum driven by strong quarterly results
2. It continues to trade within a mildly bullish up-trending channel, making channel-based trading reliable
3. Two trend lines on the chart highlight the ongoing trend strength and underlying support for the stock
4. Since recovering from COVID in 2021, the price has consistently remained above the 200-day EMA, reflecting long-term bullishness

SPANDANA LONGElliott Wave analysis shows that the stock has completed waves (i), (ii), (iii), (iv) and (v) downside. Currently, the stock is undergoing correction wave (a), (b), and (c) in a daily time frame.
Wave (a) and (b) in blue colour are finished and the stock is currently in wave (c).
Wave (a) unfolded in five sub waves in red colour and Wave (b) is folded in three sub waves (a-b-c) in red colour.
Wave (c) will unfold in five sub-waves shown in red colour on the chart.
Wave levels are shown on the chart.
Level of Invalidation
The starting point of Wave (a) has been identified as the invalidation level at 286.65. Because as per wave rules Wave (b) cannot retrace more than 100% of Wave (a). If the price falls below this level, it can indicate that the expected Elliott Wave pattern is not as it seems.
I am not a registered Sebi analyst. My research is being done only for academic interests.
Please speak with your financial advisor before trading or making any investments. I take no responsibility whatsoever for your gains or losses.
Regards
Dr Vineet

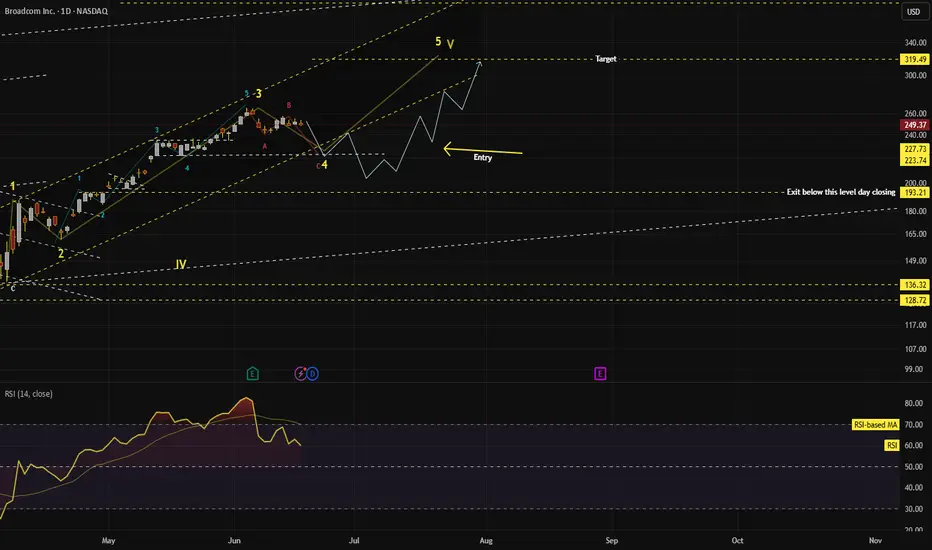
Broadcom (AVGO) can correct till 206, post that a target of 315 AVGO has completed its lower degree 5 waves and higher degree wave-3.
Currently it is correcting in ABC waves.
Blue line depicts probable path it may take correcting and then taking turn up towards a target of 315, which completes its higher degree Wave-5 and mostly larger Wave-5(Wave-V).
How can one enter ?
Wait for price to correct and make a entry pattern(as per Price action and RSI divergence)
Exit will be around 315 or any rule based system.
When this view will be negated:
If daily price closes below 193.25 above view gets negated.
CHOLAFIN - ReassessmentThe last time I posted the chart, the inverted Head and Shoulder pattern was evident and it had signaled that the downward trajectory has been arrested. However, the analysis was premature and with the very close Stoploss we were safely out of the stock. That is the benefit of having a stoploss.
Since then the stock has gone on to form a nice base respecting that bottom zone the Inverted Head and Shoulder had arrested and also now it is making a more evident Triple Bottom on the Support line of the Ascending Channel.
I believe the stock is now ready for an up move.

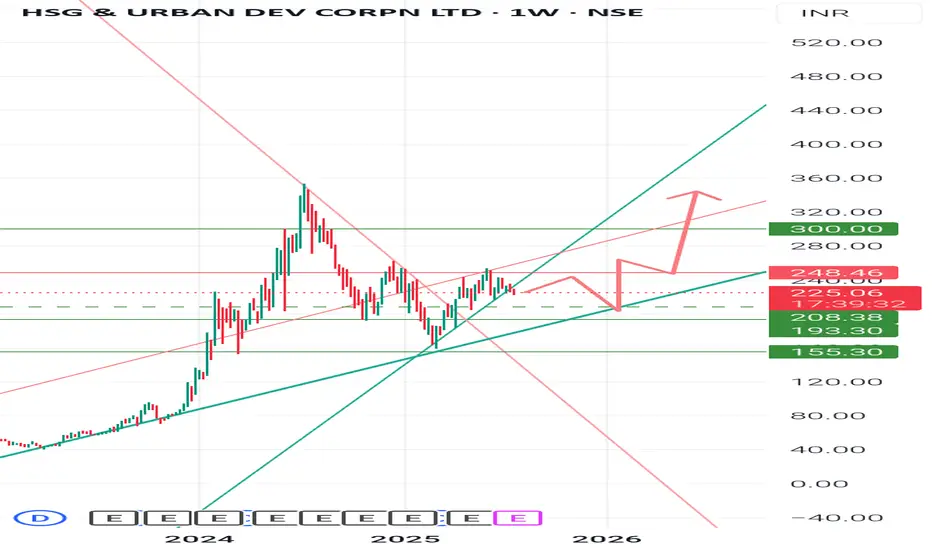
Hudco : Long with support 210 to 360Keep adding small quantity on every dip of Hudco for 1-2 years.. It will touch 360 .
There is support and demand zone 240-210.. Stock will consolidate in this range for few months, so have patience, good things take time. 👍
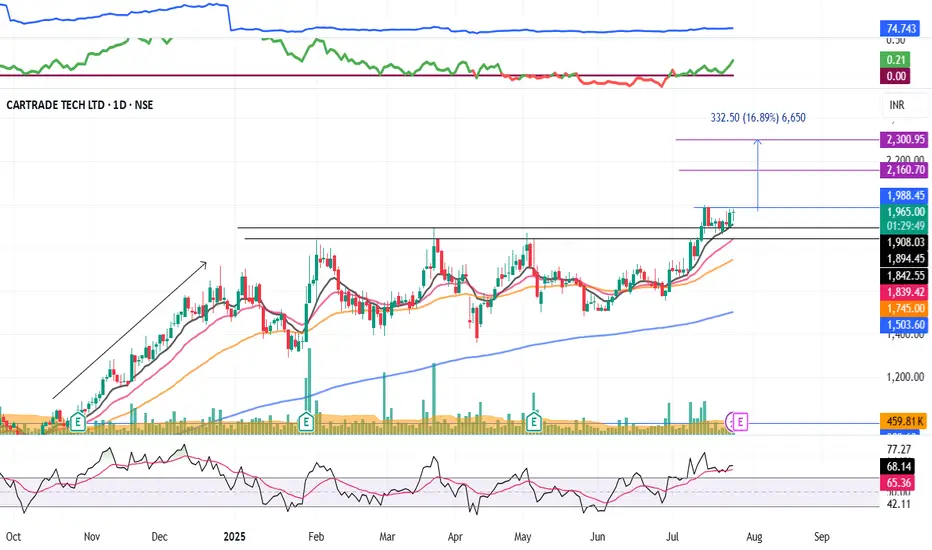
CARTRADE : Momentum pick#CARTRADE #swingtrade #momentumstock #breakoutstock #basingpattern
CARTRADE : Swing Trade
>> Good Base formation
>> Breakout + Retest done
>> Good Strength & Volume dried up
>> Trending setup
Swing Traders can lock profit at 10% and keep trailing
Pls boost, comment and follow us for more such analysis
Disc : Charts shared are for Learning purpose and not a Trade recommendation. consult a SEBI Registered Advisor before taking position in it.