Gold at Trendline and Strong Support of 3370~3400After Previous week’s trending up move, gold has remained in consolidation nearing Trendline and having tested Strong Support at 3370
Above 3400 Gold is likely to test 3500 The Previous ATH
Parallel Channel

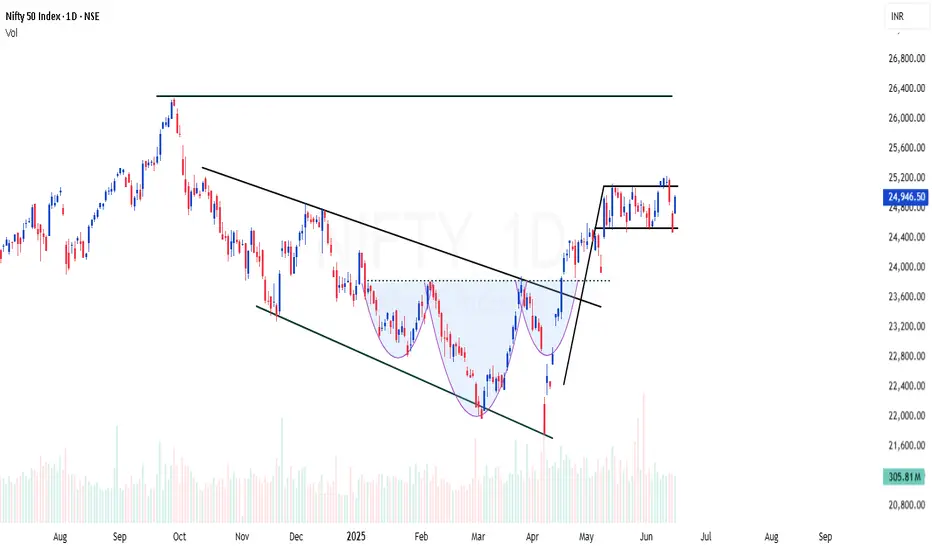
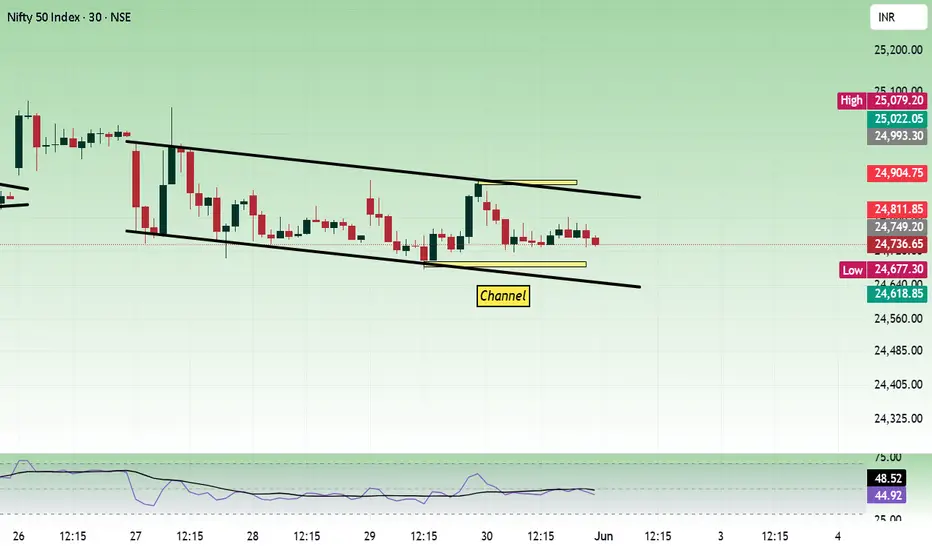
NIFTY | Back to back bullish patternsNIFTY showing back to back bullish signs
Channel breakout - Done
Inverted Head & Shoulder breakout (INHS) - Done
Now forming flag setup
NIFTY shows strength to move another 15% this year
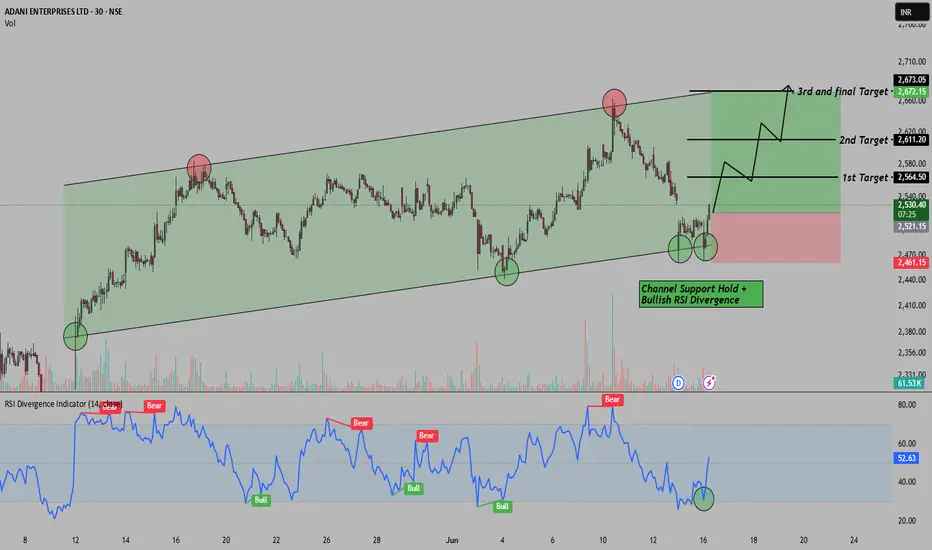
Rising Channel+RSI Divergence=Reversal Setup in Adani EnterpriseHello Everyone, i hope you all will be doing good in your life and your trading as well. Today i have brought a setup in Adani Enterprises , where we’re spotting a short-term reversal opportunity inside a clean rising channel . Price recently tested the channel support for the 3rd time and gave a solid bounce, which is also confirmed by a bullish RSI divergence . This combo often works as a reliable early reversal signal for positional or intraday swing traders. Here we are expecting at least 4%+ move behalf of this setup.
This trade is completely logic based so i placed Stop loss around 2461 for controlled risk. for the targets please check the chart above i have mention there.
Reward-to-Risk Ratio looks favorable here , especially with clear trend structure and momentum support from RSI. Let’s see how this setup plays out!
If you liked this breakdown, don’t forget to LIKE & FOLLOW for more real chart setups, data-backed ideas, and smart money zones.
Disclaimer: This post is for educational purposes only. Do your own research or consult a financial advisor before investing.
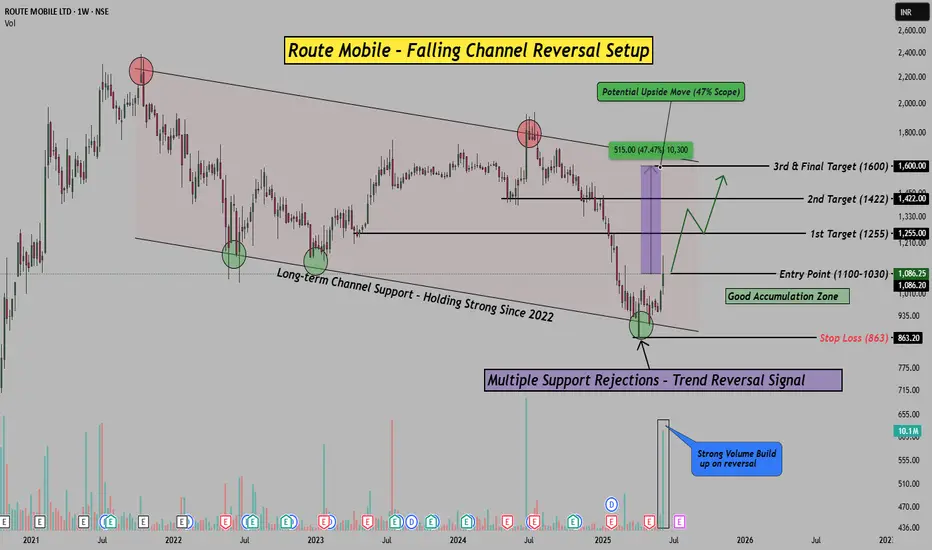
47% Potential Upside in Route Mobile? Channel Reversal Analysis!Hello Everyone, i hope you all will be doing good in your life and your trading as well! In today's post, i have brought a very interesting reversal setup on Route Mobile Ltd.
After spending over 2 years inside a falling channel , the stock has recently shown a sharp bounce right from the long-term channel support , which has held strong since 2022. Not just that, this bounce came with a strong volume spike , hinting at fresh buying interest.
The current price action structure is clearly indicating a potential trend reversal from the lows. I have marked a Good Accumulation Zone between (1100-1030) , where smart money seems to have stepped in. If this setup works out, I am looking we can see good spike in coming few weeks, Please check chart above to know about the targets.
To manage risk, I have kept a safe Stop Loss at 863 , which is approx 12% downside , while potential upside is over 47% . That gives us a solid risk-reward structure for positional traders.
Technicals Match Fundamentals:
Route Mobile is a strong player in global cloud communications, working with big names across the world. Long-term fundamentals remain stable, and the chart now supports a technical reversal.
If you enjoy such chart-based trade setups backed by structure and logic, don’t forget to LIKE & FOLLOW for more.
Disclaimer: This idea is purely educational. Please consult your advisor before investing.
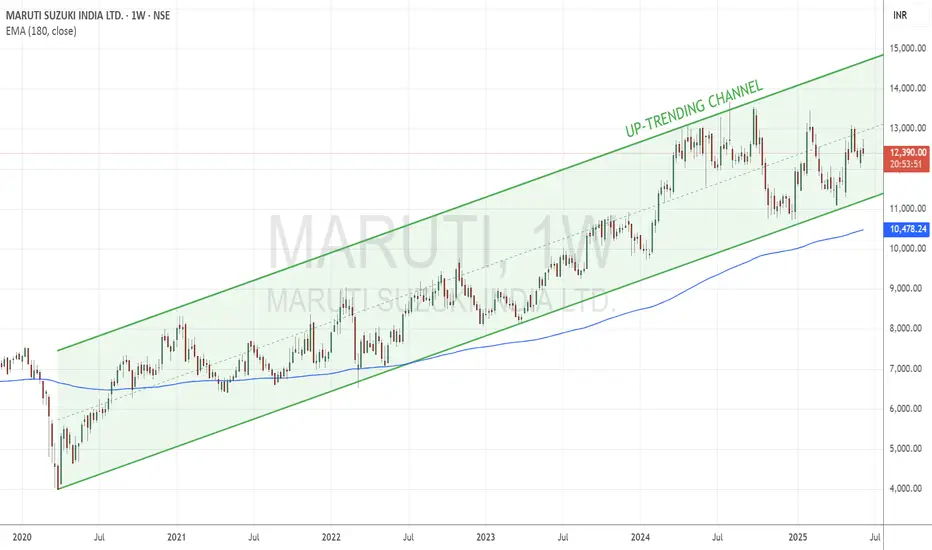
Maruti Moves Steadily Higher Within a Structured Bullish ChannelTopic Statement:
Maruti is on a moderate bullish run, trading within a defined uptrending channel and supported by key price levels.
Key Points:
* The stock is moving in an uptrending channel, making it suitable for consistent channel-based trading
* Price remains mostly above the 180-day EMA, offering good accumulation opportunities near the EMA
* Strong support has been observed at the 13,000 level, with crucial long-term support around 11,000
* A breakout above or below these levels could lead to significant directional movement
Sensex - Expiry day analysis June 10After gap up, price moved in a very narrow range. Near by support is at 82300 and resistance is at 82500. Price have to break these two levels with strength to move up further.
Buy above 82300 with the stop loss of 82160 for the targets 82440, 82560, 82700, 82860, 82980, 83120, 83220and 83360.
Sell below 81960 with the stop loss of 82100 for the targets 81840, 81700, 81560, 81400 and 81260.
Expected expiry day range is 81800 to 82900.
Always do your own analysis before taking any trade.

Rangebound ACCChart Pattern on ACC looks rangebound
stock previously gave run up from the same levels

TATA STEEL: At a make-or-break level• Tata steel is trading between two different channel system for the last one year.
• On 19th May It broke out from channel system 1
• On 25th May it broke the channel system 2 with good volume.
• There after the market is sideways and there is a volume contraction is observed.
• Weekly candle is indication a bearish piersing
• A fake BD below level 160 could lead the price on channel system 2 and EMA 21 around 156.5
• A free fall might happen there after.
• Go long only if a strong bullish marubuzo closing above 166.
• Wait and watch the show!!!

Bank Nifty - All time high...Daily time frame shows price has formed an ascending triangle and price has closed above it on Friday creating all time high.
Near by support is seen at 55950 to 56150. Resistance is seen at 56700 zone.
One hour time frame shows price is moving inside a rising channel. Buying zones are above 56000 or 56700 zones. Sustaining above this, price can reach 56920, 57100, 57320, 57560, 57680, 57840 and 58000.
Do your own analysis before taking any trade.

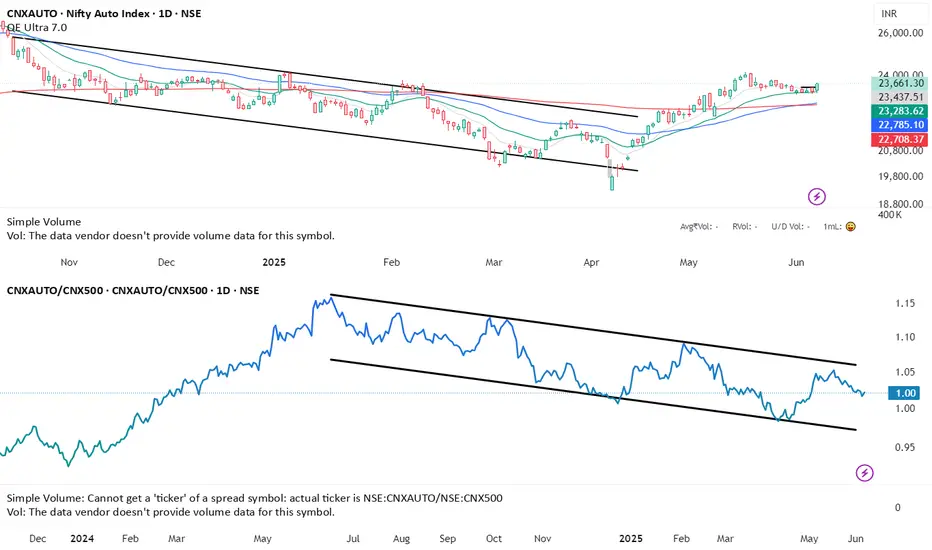
Relative Strength or weakness in Auto sectorLet's see if this makes lower high but this sector does not look the strongest for sure
Stocks in this index:
NSE:MARUTI,NSE:M&M,NSE:TATAMOTORS,NSE:BAJAJ-AUTO,NSE:EICHERMOT,NSE:TVSMOTOR,NSE:MOTHERSON,NSE:BOSCHLTD,NSE:HEROMOTOCO,NSE:ASHOKLEY,NSE:BHARATFORG,NSE:TIINDIA,NSE:MRF,NSE:BALKRISIND,NSE:EXIDEIND
Will have to check Ancillaries separately as there are many stocks which are coming in scans from Ancillaries space.
We are also facing rare magnets issue in the short term.
This is how you can use ratio charts to gain an extra edge.
Source: x.com
DISCLAIMER: NOT A SEBI REGISTERED ANALYST.
NO RECOMMENDATION TO BUY AND SELL
Gold Uptrend Continues June 6, 2025As yesterday Gold made high of 3403, I was expecting to cross upto 3430 but it dropped sharply. News was strong and as it made cautious to investors and safe heaven asset declines moved back to riskers market to 3340.
Now today you can check a pattern and gold is moving in that support and resistance, expecting it to move upward. Currently the situation is unexpected as gold may come down to 3340 and then move upward or directly upward from 3358. Our target is 3375-3389-3400.
Key point.
Resistance - 3360, 3375, 3389, 3400
Support - 3340, 3354
Any Query Reach Us or comment down
Rudra Vasaikar Wishes You A Great And Very Amazing Trading Life. Trade Safe, Trade Right.
RISK WARNING 🔴 🔴 🔴
There is high risk of loss in Trading Forex, Crypto, Indices, CFDs, Features and Stocks. Choose your trade wisely and confidently, please see if such trading is appropriate for you or not. Past performance is not indicative of future results. Highly recommended - Information provided by Pro Trading Point are for Educational purpose only. Do your investment according to your own risk. Any type of loss is not our responsibility.
HAPPY TRADING.
#gold #xauusd #xauusdtrading #goldtrading #goldanalysis #forextrading #forex #trendline #goldsignals #goldnews goldlatestanalysis #xauusdtradesetup #forextradingguide #fxgold

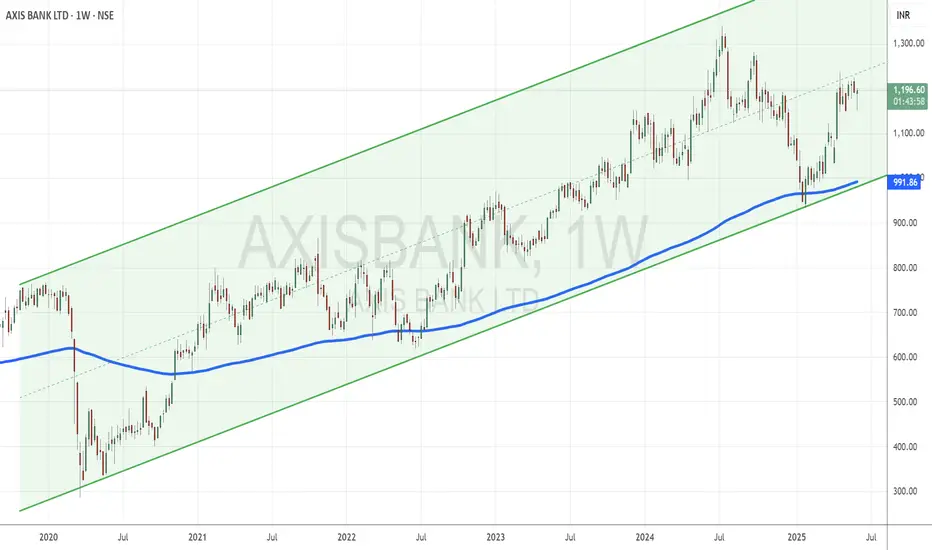
Axis Bank Climbs Steadily Within a Moderate UptrendTopic Statement:
Axis Bank is on a moderate bull run, advancing within a stable uptrending channel but with less momentum compared to its peers.
Key Points:
* The stock is moving upwards in a bullish uptrending channel, making channel trading straightforward
* It is trading close to its lifetime high, reflecting gradual strength
* Accumulating the stock near or below the 180-day EMA offers a favorable risk-reward setup
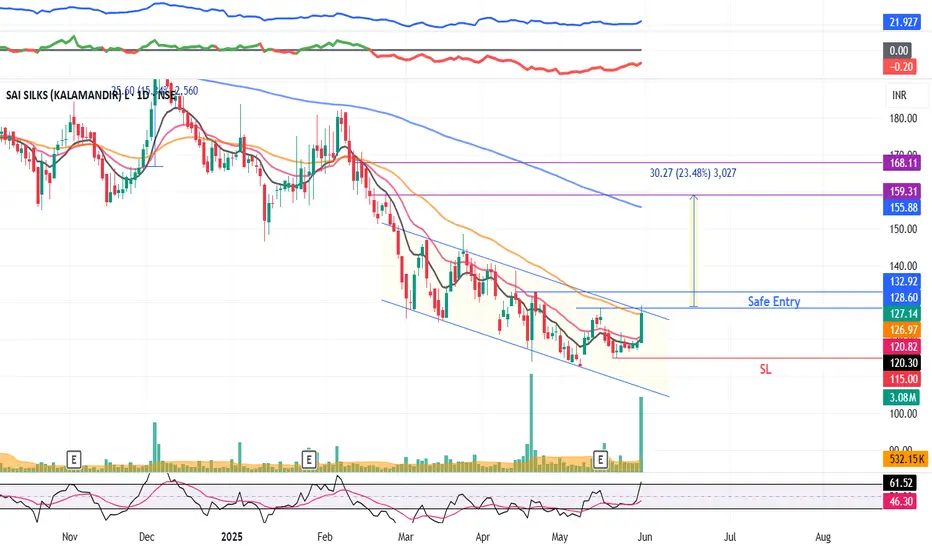
KALAMANDIR : Falling Channel pattern#KALAMANDIR #chartpatterntrading #fallingchannelpattern #channelbreakout #breakoutstock
KALAMANDIR : Swing Trade
>> Breakout stock
>> Falling Channel pattern breakout
>> Good Strength & Volume Buildup
>> Stock in Momentum
Swing Traders can lock profits @10% & keep trailing
Disc : Stock Charts shared are for Learning purpose, not a Trade recommendation
Consult a SEBI Registered Advisor before taking position in it.
Nifty - Weekly Review June 2 to June 6Price is moving inside a descending channel. 24700 is an important zone to decide the trend direction.
Buy above 24740 with the stop loss of 24680 for the targets 24800, 24860, 24900, 24960, 25020, 25080 and 25120.
Sell below 24620 with the stop loss of 24680 for the targets 24560, 24520, 24460, 24400, 24340, 24280 and 24240.
Always do your own analysis before taking any trade.
BTC : A FAKE CHANNEL BO?
BTC moving in a parallel channel
The channel broken in the yesterday
Now BTC is trying to reenter the channel
Break out from the key level 105000 indicates and FAKE channel BO
Higher timeframe trend is strong bullish. Hence Probability of FAKE BO is high

KOTAKBANK | Full 5+ years range consolidation and breakoutKOTAKBANK | Full 5+ years range consolidation and breakout in monthly time frame
CMP : 2074
Stable bluechip stock - can expect atleast 40% ROI from here

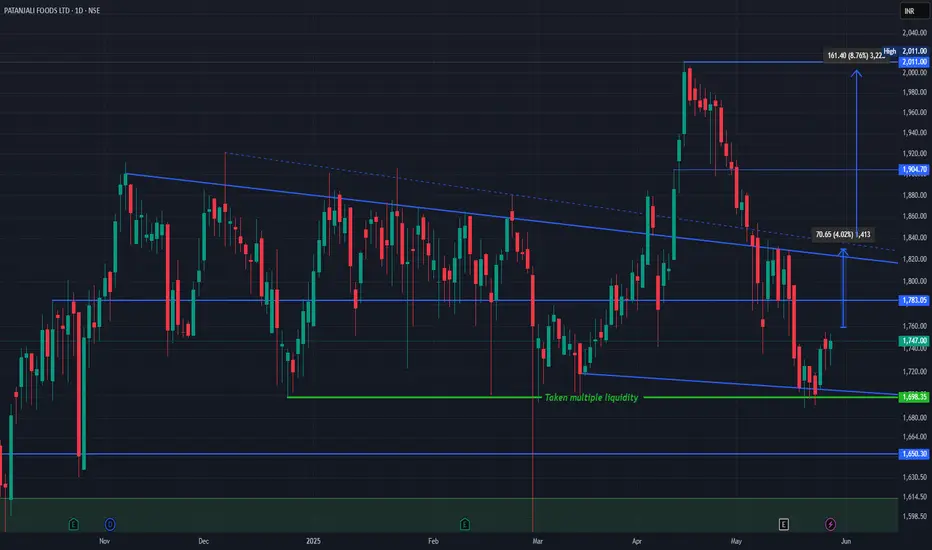
Patanjali Foods Ltd (NSE: PATANJALI) technical chart breakdown.Patanjali Chart Structure & Price Action
The stock has been trading within a descending channel, bounded by the blue trendlines.
It recently bounced from a major demand zone (~₹1,698) marked by the green support line that has absorbed liquidity multiple times ("Taken multiple liquidity").
Price is now slowly recovering from this base.
Current Scenario
CMP: ₹1,747
Immediate Resistance:
₹1,783 (horizontal level)
₹1,818–₹1,835 zone (upper boundary of the falling channel)
Break and sustain above ₹1,783–₹1,835 could trigger a trend reversal.
Upside Targets
Target 1: ₹1,830/Target 2: ₹1,904
Previous structural high Target 3: ₹2,011 Recent swing high Total upside from breakout: ~8.76%
Support Levels
₹1,698 – Critical demand zone (green)
₹1,650 – Next strong support
₹1,570 – Long-term support base (green zone)
Simple Explanation
Patanjali Foods rebounded from a high-liquidity support area and is now showing signs of bullish recovery. A breakout above ₹1,783 could take it back to the ₹1,900–₹2,000 range. Risk is well-defined below ₹1,698. Watch for volume and price action confirmation near the upper channel.
Like, comment your thoughts, and share this post
Explore more stock ideas on the right hand side your feedback means a lot to me!
Disclaimer: This post is for educational purposes only and should not be considered a buy/sell recommendation.
ICICI Bank Powers to Lifetime High Within a Strong Bullish ChannTopic Statement:
ICICI Bank is on a robust bull run, steadily advancing within a strong uptrending channel.
Key Points:
* The stock is moving upwards in a strong bullish uptrending channel, making channel-based trading highly effective
* It is currently trading at its lifetime high, reflecting continued strength and investor optimism
* The price has highly overextended above the 200-day EMA, indicating the stock is highly overbought and may be poised for a cooling-off phase

SURAJEST : Short Term Trade (1-3 Months)#SURAJEST #parallelchannelbreakout #breakoutstock #trendingStock #Momentumstock
SURAJEST : Short Term (1-3 Months)
>> Parallel Channel Breakout
>> Breakout Candidate
>> Trending Stock in Momentum
>> Good Strength in Stock
>> Recent Volume Buildup
>> Good Upside Potential
Swing Traders can lock profit at 10% and keep trailing
Disc : Stock charts shared are for Learning purpose and not a Trade recommendation.
Pls consult a SEBI Registered Advisor before taking position in it.

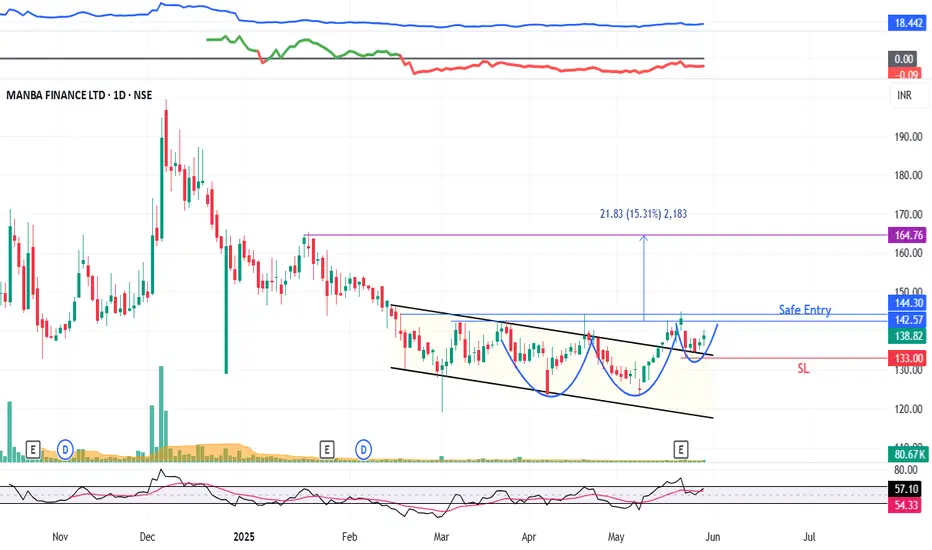
MANBA : Momentum stock (swing pick)#MANBA #breakoutstock #vcppattern #parallelchannelbreakout #momentumstock
MANBA : Swing Trade
>> Parallel Channel Breakout
>> VCP pattern formation
>> Trending Stock
>> Breakout Candidate
>> Good Strength & Volumes Dried up
Swing Traders can lock profit at 10% & keep trailing.
Disclaimer : Stock Charts shared are for Learning Purpose and not a Trade recommendation. Consult a SEBI Registered Advisor before taking position in it.
Even Technical Analysis is not 100%, so I reserve the Right to be wrong.
: Plastiblends India Ltd (PLASTIBLEN)- Descending Channel Patter🚀 Breakout Watch: Plastiblends India Ltd (PLASTIBLEN)
📍 CMP: ₹211.75 📊 Volume: 80.3K 📅 29 May 2025
Plastiblends has just triggered one of the cleanest Descending Channel breakouts seen lately — and it comes with heavy volume, structure integrity, and visible accumulation signs. This is a high-quality price action setup worth tracking closely.
🔹 1. Pattern Structure – Descending Channel (9 Months)
Price has been trapped in a downward-sloping channel for nearly 9 months, respecting a consistent pattern of lower highs and lower lows.
But here’s the key: since early April, price has been forming higher lows, grinding toward the upper trendline resistance. Today, the stock closed above the channel, clearing the red resistance trendline decisively.
This marks the end of a long consolidation cycle and could be the beginning of a trend reversal breakout.
🔹 2. Volume Behavior – The Tell Before the Move
Volume has quietly been building over the past 3 weeks — signaling silent accumulation. Today's breakout came on 80.3K volume, significantly above the average of the past few months.
What makes this special is that volume surged before price, a classic sign of smart money entering before confirmation.
🔹 3. Breakout Candle – Strength & Intent
Today’s candle is powerful — wide-range, full-body, with minimal upper wick, closing +9.09% higher. This kind of momentum off a multi-month pattern rarely goes unnoticed. The breakout was clean, no wicky rejections, no fakeouts.
This isn’t just a breakout — this is a price declaration.
🔹 4. Trade Setup – Structure-Based Plan
📌 Entry: ₹210.5–₹214 (post breakout)
🛑 Stop-loss: ₹193 (below recent base)
🎯 Target Zone: ₹240 (swing), ₹265+ (measured move)
Measured move:
Channel height ≈ ₹265 – ₹170 = ₹95
Breakout from ₹210 + ₹95 = ₹305 (longer-term potential)
Risk:Reward → Risk = ₹17, Reward = ₹54+,
So you’re looking at an R:R of ~1:3+

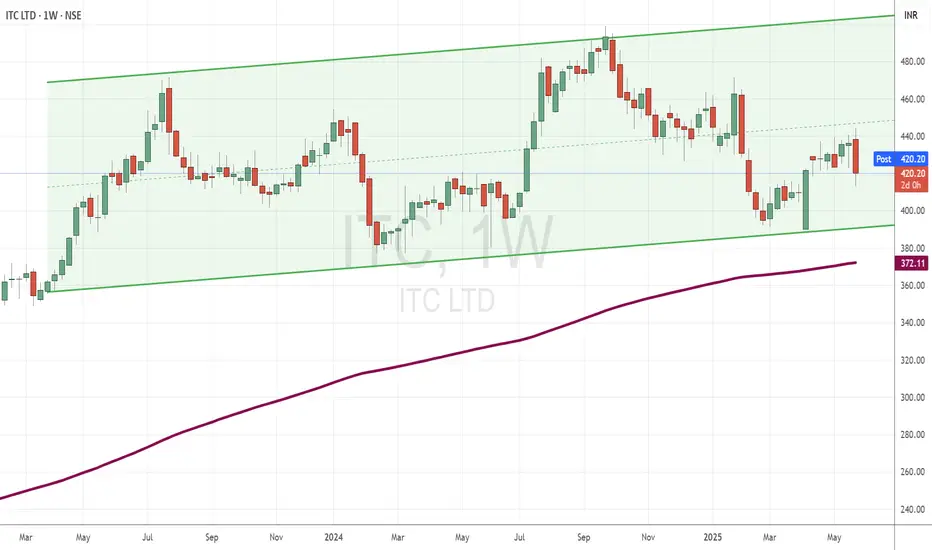
ITC Approaches Key Support Within Mild UptrendTopic Statement:
ITC is trading in a range with a slight bullish tilt, presenting structured opportunities within a defined channel.
Key Points:
* The stock is moving within a slightly bullish up-trending channel, making it suitable for channel-based trading
* A head and shoulders candlestick pattern is emerging, which may signal potential short-term weakness
* The price is nearing the 180-day EMA, making levels near or below it attractive for long-term buying opportunities
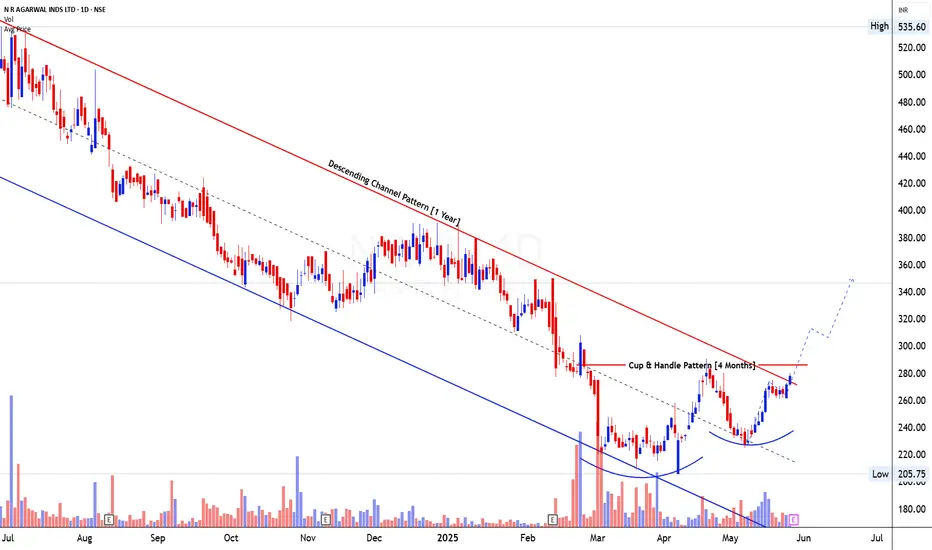
N R Agarwal Industries Ltd (NRAIL)- Cup and handle & Descending🚨 Breakout Watch: N R Agarwal Industries Ltd (NRAIL)
📍 CMP: ₹278.05
📊 Volume: 9.2K
📅 27 May 2025
NRAIL is at a critical technical juncture with two bullish patterns aligning at the same level — a textbook Cup & Handle breakout forming at the top of a 1-year Descending Channel. This is a rare dual-pattern setup, showing both reversal and trend transition.
🔹 1. Pattern Structure
Over the past 12 months, the stock trended inside a Descending Channel with clean respect to both trendlines — lower highs and lower lows played out until Feb 2025. Then came a shift…
From March onward, price started rounding off into a Cup base, forming a strong foundation around ₹210–₹220. In April-May, the price entered a healthy pullback, creating a Handle — with higher lows and tight ranges.
Now, the price is sitting right at the neckline of the Cup (~₹280), which is also the resistance of the descending channel. This is a high-probability breakout zone.
🔹 2. Volume Analysis
The volume behavior has been constructive. During the Cup base, volume stayed muted — a sign of seller exhaustion. During the Handle, we saw tight candles with low volume dips — typical of institutional absorption.
Now, volume is picking up. Today’s breakout candle printed 9.2K shares, which is higher than average for this stock and confirms interest building at resistance.
🔹 3. Breakout Candle & Price Behavior
The breakout candle today gained +2.44%. It's not a perfect marubozu, but it has a solid real body and closed strong near the highs. The last 5 sessions show clear momentum build-up — and no signs of a bull trap or false breakout yet. Structure is clean and controlled.
Watch for a strong close above ₹285–₹290 to confirm the breakout.
🔹 4. Trade Plan (Based on Structure)
Entry: ₹282–₹290 (Breakout confirmation zone)
Stop-loss: ₹258 (Just below the handle base)
Target 1: ₹340 (Cup height measured move)
Target 2: ₹360–₹390 (Channel breakout potential)
Measured move logic: Cup depth is ₹70 → ₹280 + ₹70 = ₹350
Descending Channel range is nearly ₹180 → Target opens up towards ₹460 long-term.
This gives a Risk:Reward of ~1:2.5 to 1:3+, which is very attractive.
🔹 5. Why This Matters
This is more than just a breakout. This is a full structure shift — going from a year-long downtrend to a potential new trend. When a Cup & Handle breakout aligns with a channel breakout, momentum can be explosive.
#Trading #Investing #Stocks #TechnicalAnalysis