Eicher Motors Unshaken in Bullish UptrendTopic Statement:
Eicher Motors is in a strong bullish momentum and has remained unaffected by the recent market correction.
Key Points:
- Price is moving within a bullish up-trending channel, indicating strength.
- The stock mostly trades above the 180-day EMA, reinforcing its bullish trend.
- Stock can be accumulated near the lower band of the channel using the channel trading method.
Parallel Channel

Maruti Remains Strong Within Up-Trending ChannelTopic Statement:
Maruti has maintained its bullish momentum despite the broader market correction, supported by its strong up-trending channel.
Key Points:
- Price is moving within a well-defined up-trending channel, making channel trading favourable.
- The stock is taking support at the 23.6% Fibonacci retracement level at ₹11,300.
- Price is currently close to the 180-day EMA, providing additional support.

NIFTY in a ChannelNifty inside a channel.
This content is for informational and educational purposes only and does not constitute financial, investment, or trading advice. All opinions expressed are solely my own and should not be considered as recommendations to buy or sell any financial instruments. Trading and investing involve substantial risk and may not be suitable for all individuals. Always conduct your own research and consult with a qualified financial advisor before making any trading decisions. I am not responsible for any losses you may incur.

Trent Faces Deeper Correction RiskTopic Statement:
Trent has witnessed a major correction along with the broad market decline but still remains overbought indicating further downside risk.
Key points:
- Stock retraced to the 50% Fibonacci level and found support near ₹5000.
- Price is moving within a well-defined down-trending channel.
- Despite the correction, price is still significantly above the 180-day EMA, suggesting selling pressure may continue until valuation cools off.

Indian Hotels Resilient but Trend Turns CautiousTopic Statement:
Indian Hotels Company has shown resilience during the broad market correction, though a breach of the long-term trendline indicates a shift in trend.
Key Points:
- Long-term up-trendline has been breached, signaling a trend change.
- Candlesticks are moving in a down-trending channel.
- Stock often finds support and bounces back up near the 180-day EMA.

Max Healthcare Holds Strong Despite Trend ShiftTopic Statement:
Max Healthcare has remained resilient to the broad market correction but has shifted trends after breaching its long-term trendline.
Key points:
- The long-term trendline was breached, indicating a shift in trend.
- Candlesticks are moving within a downtrending channel.
- The stock frequently bounces back when approaching the 180-day EMA.

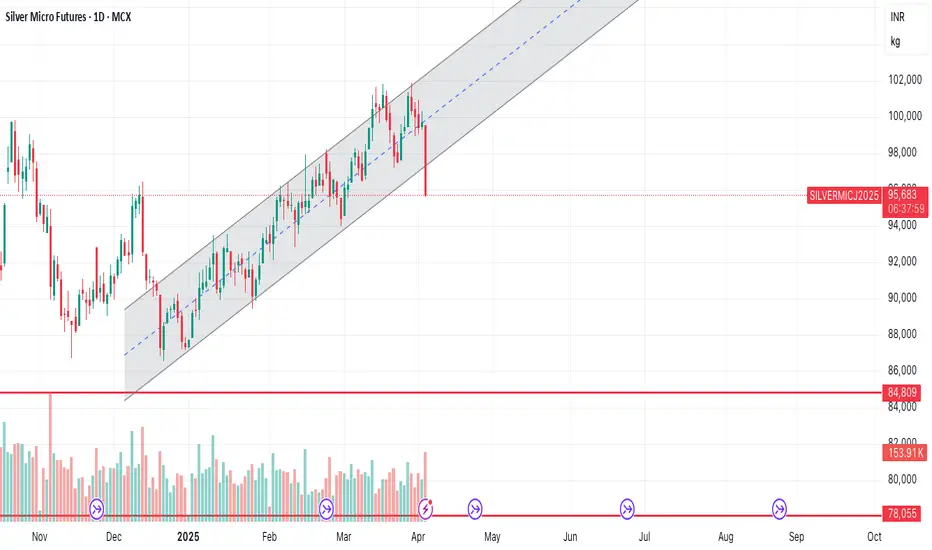
Silver breakout from channelSilver break out from parallel channel.
on retest we can try to short with limited stop loss
this is based on channel breakout analysing.
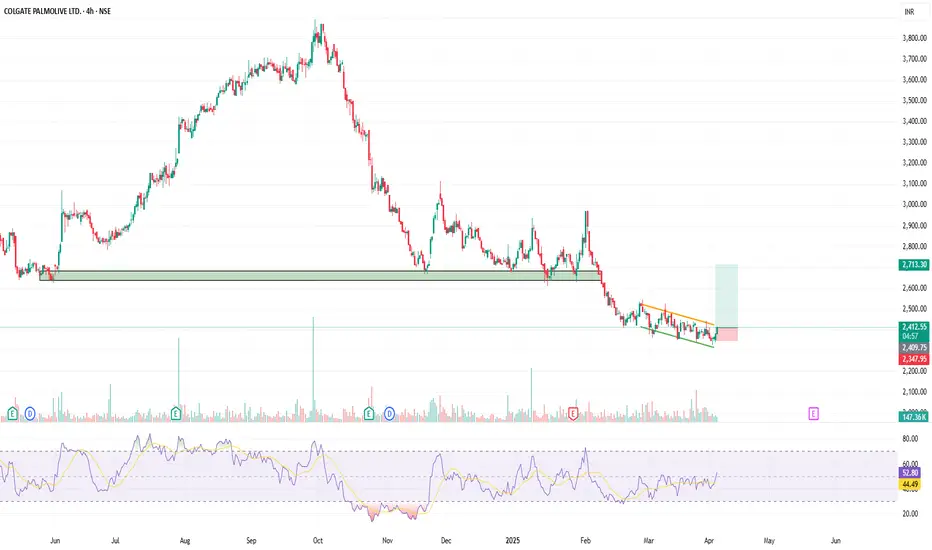
COLAGTE Falling Wedge + Stong Base = Breakout Loading (COLPAL)Falling Wedge + Strong Base = Breakout Loading! 🚀
🔍 Technical Overview
Pattern : Falling Wedge (bullish reversal pattern).
Support Zone : ₹2,347 – ₹2,409 (highlighted demand zone with historical significance).
Breakout Signal : Price has broken above the wedge with a bullish candle and rising RSI.
Volume : Subtle increase in volume during the breakout.
📈 Trade Setup
Entry: ₹2,411 (Current price after breakout)
Stop Loss: ₹2,347 (Below the wedge and support zone)
Target: ₹2,713 (Previous swing resistance)
📊 Indicators
RSI: Moving above 52 – bullish shift in momentum
Volume: Gradual accumulation visible
Trend: Base formation after a prolonged downtrend, signaling potential trend reversal
⚖️ Risk-Reward Ratio
RRR ≈ 1:4
Great reward potential with a tight stop and strong technical base!
OFSS Breaks Trend, Enters Oversold ZoneTopic Statement:
OFSS has undergone a major correction in line with the broad market downturn after breaking down from its uptrending channel.
Key points:
- The breakdown from the uptrending channel triggered selling pressure and a sharp correction.
- The price has taken strong support at 7,000.
- The stock is trading below the 180-day EMA, making it oversold.

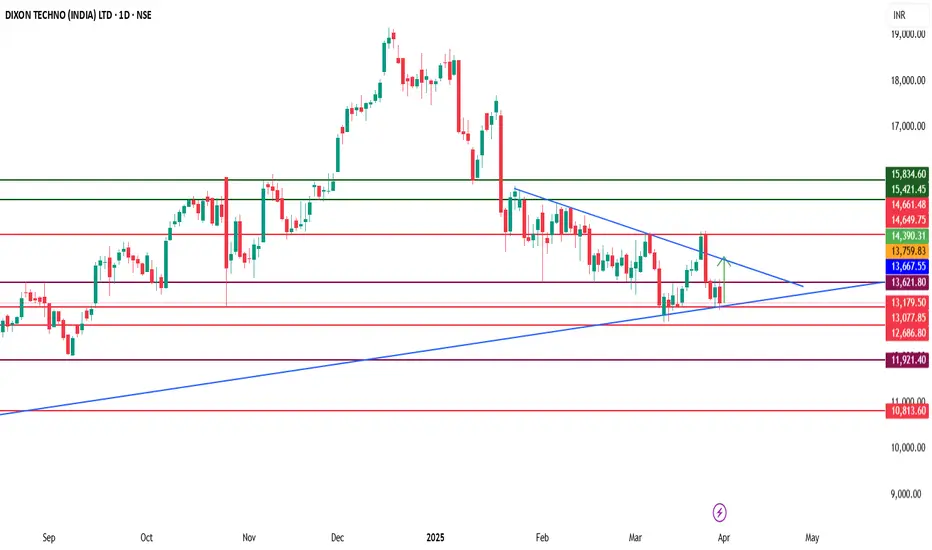
Dixon Technologies: Key Levels & Market Outlook📌 Dixon Technologies (NSE: DIXON) – Key Levels & Market Outlook
Dixon Technologies (DIXON) is currently trading above a crucial support zone of ₹13,000-₹12,800. If the stock sustains this level and breaks above the ₹13,630 resistance, it could see an upside move toward ₹14,000-₹14,600. However, a breakdown below ₹12,800 may lead to further downside pressure.
🔍 Technical Indicators:
📊 Supertrend (10,3): The indicator is currently in a buy mode, supporting a bullish outlook as long as ₹12,800 holds.
📈 Fibonacci Retracement: The ₹13,630 resistance aligns with a key retracement level; a breakout above this could confirm strength.
📉 ADX (Average Directional Index): Currently at 23, suggesting a developing trend; a move above 25-30 would indicate strong bullish momentum.
📊 OBV (On-Balance Volume): Rising OBV signals strong accumulation, supporting an upward breakout scenario.
📌 Key Levels to Watch:
✅ Support Zone: ₹13,000-₹12,800
📍 Resistance Level: ₹13,630
🚀 Upside Targets: ₹14,000-₹14,600
⚠ Breakdown Risk: Below ₹12,800, the stock may slide toward ₹12,500.
A sustained move above ₹13,630 could accelerate buying momentum, pushing Dixon toward ₹14,000-₹14,600. On the other hand, a break below ₹12,800 may invite selling pressure. Keep an eye on sector trends, demand in electronics, and institutional activity for further confirmation.
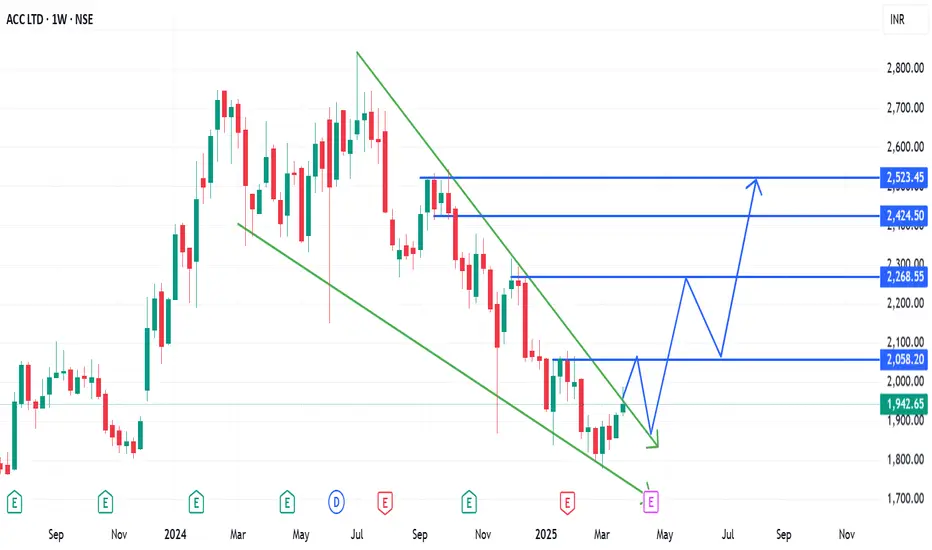
A possible trend reversal in ACC. (01/04/2025)ACC Ltd is trading in a narrow range and is in a downtrend. There are chance of a trend reversal as the indicators are predicting and the price action too seems to follow with them.
The channel break out in the stock can confirm the trend reversal. If the stock give a break out and retest, stock can be bought in cash or in F&O segment too.
Good targets can be captured in the stock as the break out after a year will be there.
Stop loss and Targets should be as per the risk to reward appetite.
Wait for the price action and trade accordingly. Patience will help in capturing the most profitable trades, otherwise losses will be eating away the capital.
BankNIFTY’s Resilience Faces a Trend ShiftTopic Statement:
BankNIFTY has shown resilience compared to NIFTY during the market correction but has entered a mildly downtrending channel after breaching its long-term uptrend line.
Key points:
- The breach of the long-term uptrend line indicates the end of the bullish pattern.
- BankNIFTY is moving in a mildly downtrending channel.
- A breakout on the upper side of the channel will shift the trend back to bullish.
- The price remains far above the 180-day moving average, making BankNIFTY overbought and expensive.

The correction is overdoneThere shall be a gradual recovery
The short term looks good
Inverted H&S in ultra short term
Parallel channel break in long term on the lower side is a good sign it can go back up
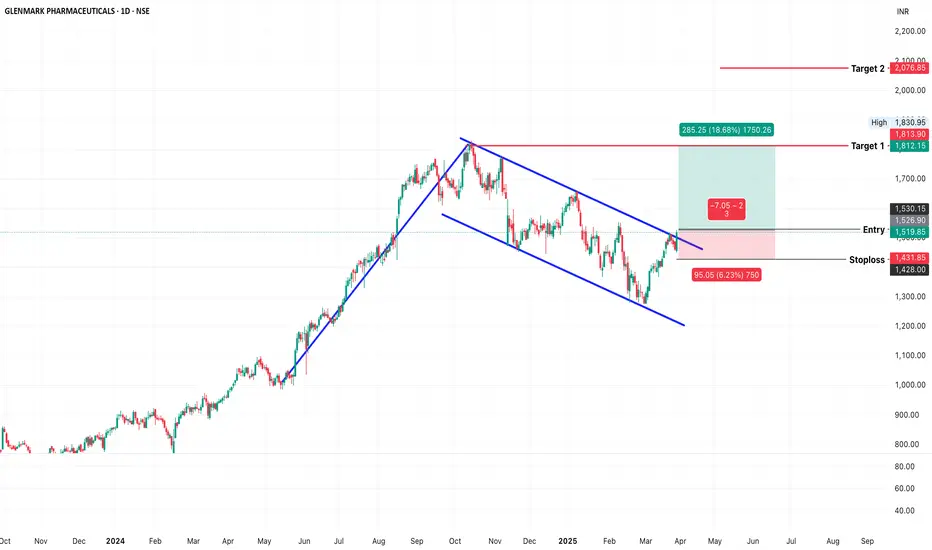
GLENMARK PHARMA (NSE: GLENMARK) – Confirmed Channel BreakoutGlenmark Pharma has confirmed a breakout from a falling wedge and flag & pole pattern , supported by strong volume and a bounce from the 200 EMA . Price structure and momentum suggest bullish continuation.
Key Observations:
Pattern Formation: Falling wedge + flag & pole since September 2024
Breakout Confirmation: Closed above upper trendline at ₹1,519.85 on March 27, 2025
200 EMA Support: Price took support at 200 EMA and reclaimed both key moving averages
Volume Spike: High volume on breakout candle validates the move
Support & Resistance Levels:
Immediate Support: ₹1,432
Breakout Level (Entry): ₹1,520
Target 1: ₹1,813
Target 2: ₹2,076
Major Resistance: ₹2,100
Indicators & Risk-Reward:
✅ RSI: 64.92 – showing strong bullish momentum
✅ Volume: Significant volume surge during breakout
✅ Risk-to-Reward: ~1:3 – ideal for swing setup
Verdict: Bullish
With pattern breakout, volume confirmation, and RSI strength, Glenmark is poised for a potential up-move.
Plan of Action:
BUY: ₹1,520
Stop Loss: ₹1,432
Target 1: ₹1,813
Target 2: ₹2,076
Trailing SL: Start trailing above ₹1,650 to protect profits
SBI - Long Term Investment IdeaSBI iS BELOW a crucial resistance levels.
Strategy used : Support Resistance levels and Trendlines
SBI near a crucial resistance levels
750-770 level.
CMP: 756
Current support levels 750 are broken and acts as resistance.
Investment idea:
50% - When crossing 762
if 610 levels are tested due to sudden spikes and rebounds, invest 50 % of the funds
Key points:
Q3 results are expected on 31st Jan 2025.
Upcoming Budget on Feb 01 2025
Support resistances - refer above.
This idea will be for long term and will be updated regularly
Note: Not a SEBI registered analyst. Plan and trade as per your analysis

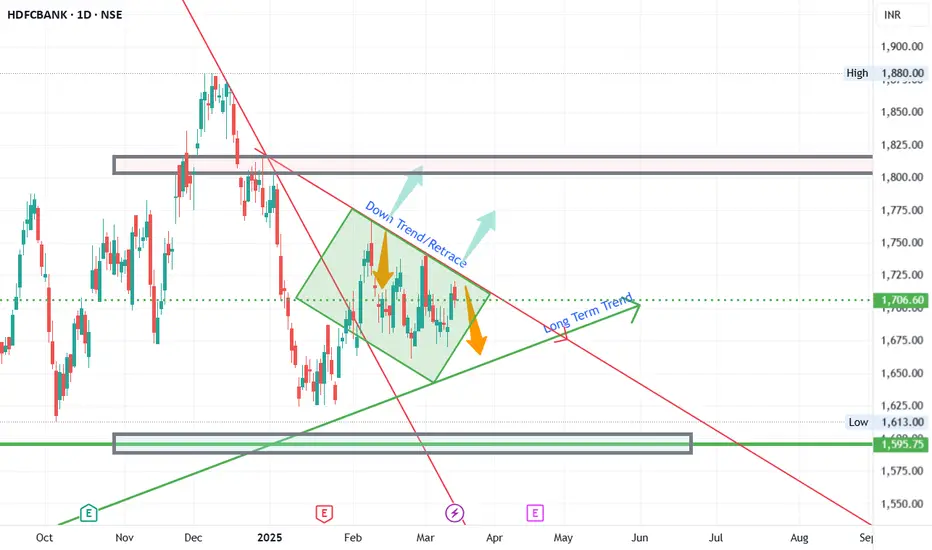
HDFC Bank - Long Term AnalysisFundamentals/Basis:
HDFC Bank is an important scrip that need to be monitored on long term basis, if we invest or not.
This is due to the fact, as a leader in the banking industry and a heavy weight company in the Nifty and bank nifty constituencies, HDFC bank provides clues to the overall market direction (most of the times)
This analysis is for Long term and if time permits, will keep updating throughout the year.
Technicals :
HDFC bank fell from its highs since end of 24 until jan. And had a retracement until approximately 1770 and formed a retracement trend direction.
Current range : 1600 to 1800 with 1700s as pivots.(Not formula but based on charts)
Trade Ideas :
If the price moves above the retracement line and sustains, go for long in the stock. Once it breaks lookout for confirmation at this trendline and also at the Long term trendlines for any retests.
Alternatively, if the price falls below the Long term trend direction, wait for confirmation on the bullishness.
Disclaimer : All the views and analysis provided are my personal analysis. Not a SEBI registered analyst. Plan and trade as per your analysis
If you Like the Analysis and agree with , Hit the Boost button and share your views agreements/constructive feedback in the comments.
Would you like me provide any of your favorite stocks analysis, let me know in the comment.
TrentOne hour chart has trend line support and 15 minutes chart shows price is moving in a channel.
Buy above 5175 with the stop loss of 5155 for the targets 5198, 5220, 5256, 5280 and 5304.
Sell below 5135 with the stop loss of 5155 for the targets 5110, 5086, 5062, 5040 and 5005.
Always do your own analysis before taking any trade.

LAURUS LAB LONG TERM CHANNEL 30% UPTRENDThe Channel is being respected for more than 19 months.
With a steady rise. Low downside potential
Taking Good Support for 200 EMA and channel.
BONUS... Entire Sector is hitting the uptrend.

ICICIBANK - Daily TF AnalysisSo much of insights while analysing ICICIBANK in daily timeframe. The stock has been in the parallel channel for 7 months and provided multiple opportunities for trade. Now what's next?
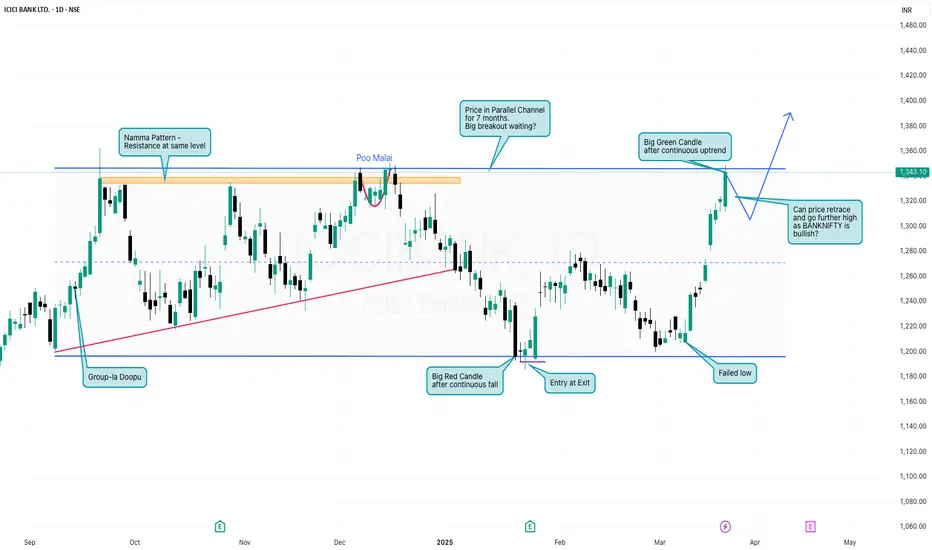
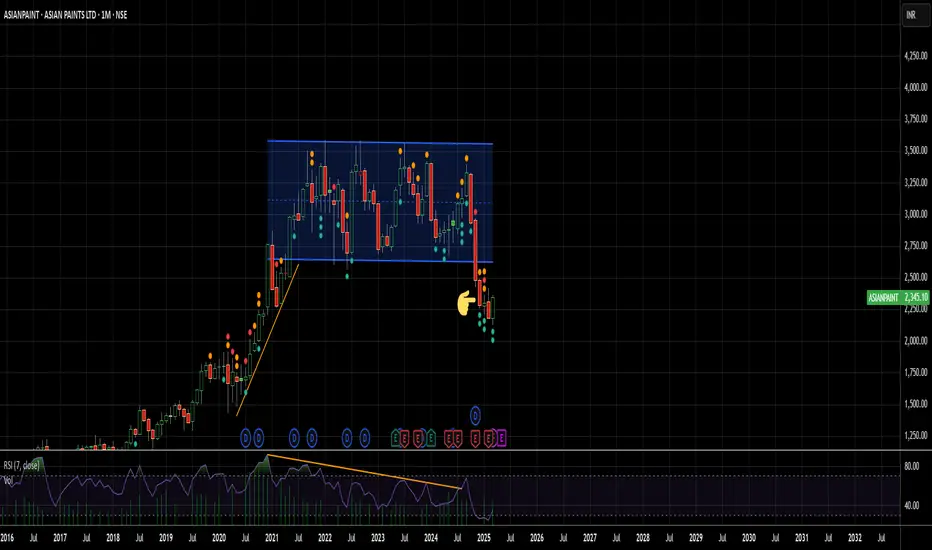
4 Year Consolidation Within 20% of Price BandThe stock is consolidation since Nov 20 within almost 20% range after a Bullish phase. YoY results are increasing profits and revenues. The Bank has been paying out good Dividents and no sign if underperforming is seen. A huge breakout after consolidation phase with min 20% CAGR in coming months is highly expected.

Massive Breakout in Nifty index : Is the Next Bull Run Starting?Hello everyone i hope you all will be doing good in your life and your trading as well, Today i have brought anlaysis on Nifty 50 because index is currently showing a strong bullish breakout setup after a long period of consolidation. A key channel breakout has occurred, confirmed by a significant volume spike , signaling the return of strong buying interest. This breakout, coupled with a recent surge in FII inflows , which have pumped in 7,470.36 Cr into the Indian market, points towards a shift in market sentiment and signals a potential rally ahead. On top of that, the government's Open Market Operations (OMO) have provided additional liquidity, further boosting market sentiment and helping support the overall bullish outlook.
And the strong support zone is playing its role as a key demand area, with multiple rejections at this level showing strong buying defense. The market is likely to head toward the 25,000+ mark , backed by a positive fundamental and sentiment boost, along with the government's OMO action , which adds a layer of liquidity and confidence. Keep an eye on this breakout, as it could set the stage for a bullish run in the broader market.
Additional Tip to my all followers:
If you're looking to invest for the long term, buying a Nifty ETF is a great option to get diversified exposure to the top 50 companies in India. It’s a cost-effective way to invest in the broad market, and given the positive outlook for the Nifty 50 index, it has the potential to offer solid returns in the long run.
Additionally, investing in your favorite stocks for the long term can complement your portfolio and further boost returns as these stocks grow over time. Combining Nifty ETFs with quality individual stocks provides a diversified approach while also giving you the opportunity to capitalize on the growth of specific companies that you believe in for the future.
Disclaimer:-This analysis is for educational purposes only. Please trade responsibly and consult a financial advisor before making any decisions.
If you found this analysis helpful, don’t forget to like, follow, and share your thoughts in the comments below! Your support keeps me motivated to share more insights. Let’s grow and learn together—happy investing!

Manappuram Finance - Trade Setup📊 Trade Plan:
Entry: Above ₹215 if broken out with volume.
Stop Loss: ₹192.95 (Closing basis).
Target: Watch price action near ₹231 (ATH); safe traders wait for a daily close above it.
Position Sizing: Buy in small quantities and accumulate gradually.
📈 Why This Stock?
Technical Setup:
Trading above key DMAs (Daily Moving Averages).
Stock was in an uptrend (June-Aug 2022) but fell out of the channel and gapped down significantly (Oct 24, 2022).
Now recovering and trading near ATH (₹231), forming another channel.
Entry possible above ₹215 if broken with volume.
Watch for ₹231 breakout with volume (4-year trading range).
Finance index has broken out of base and is trading above key DMAs.
⚠️ Market Conditions & Risks:
We are trading against the trend (LL-LH structure).
The overall market is below the 50 & 200 DMA, indicating potential further dips.
Trades are more prone to failure unless the market structure changes.
Safe traders should wait for confirmation before entering.
📊 Fundamentals (Key Data)
Market Cap: ₹18,107 Cr
Current Price: ₹214
52-Week High/Low: ₹230 / ₹138
Stock P/E: 9.21
ROCE: 13.8%
ROE: 20.6%
🚨 Disclaimer:
⚠️ This is not financial advice. We are trading against the broader trend, meaning the risk of failure is high. Do your own analysis before taking any trade. Always manage risk and trade cautiously! 🚀

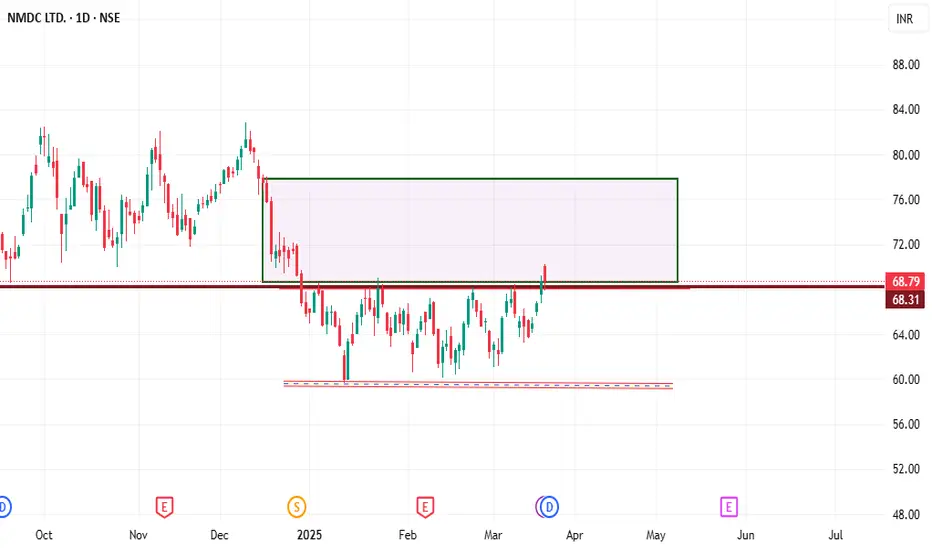
consoldation brakout parallel pattern nmdc break consolidation range and made a retest of consolidation highs as well. Stock currently trying to breakout from its previous swing highs, 68.79 approx 2 day same level consoldation is important after give a good breakout . If it breaks this level, next target as per pattern can be 77 and secod is 80 levels ofcaurse stoploss is low swing