BUY TODAY SELL TOMORROW for 5%DON’T HAVE TIME TO MANAGE YOUR TRADES?
- Take BTST trades at 3:25 pm every day
- Try to exit by taking 4-7% profit of each trade
- SL can also be maintained as closing below the low of the breakout candle
Now, why do I prefer BTST over swing trades? The primary reason is that I have observed that 90% of the stocks give most of the movement in just 1-2 days and the rest of the time they either consolidate or fall
Resistance Breakout in
PARAS
BUY TODAY SELL TOMORROW for 5%
Parasdefence

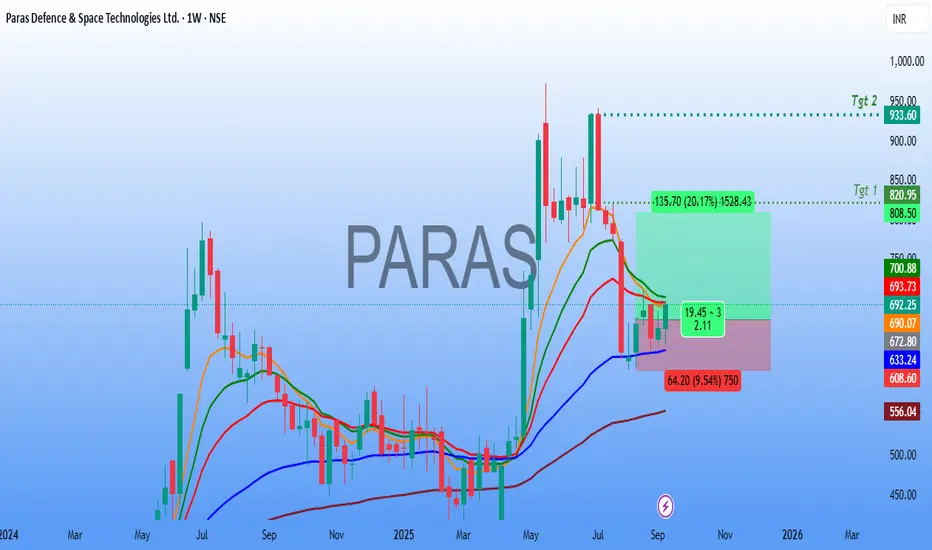
Paras Defence Technical Analysis🚀 Paras Defence & Space Technologies Ltd – Weekly Chart Analysis
The stock is showing signs of a potential reversal after consolidating near key support zones.
🔎 Technical Observations
Price Action:
After a prolonged decline from the highs, the stock has stabilized around the ₹640–660 support region. The recent weekly candle indicates buying interest, with bulls defending key support levels.
Sustained strength above the ₹700 zone can accelerate momentum towards higher levels.
Risk–Reward Setup:
The chart shows a favorable long setup with a potential upside of 20–35%.
📌 Trading Plan
Entry Zone: ₹680 – ₹700
Stop-Loss: ₹640 (weekly close basis)
Target 1: ₹820 – ₹825
Target 2: ₹930 – ₹950
⚠️ Key Notes
The ₹640–650 zone is acting as a strong support; holding this level is crucial for the bullish setup.
A breakout above ₹700 with volume confirmation will strengthen the momentum towards Target 1.
📢 Conclusion
Paras Defence is forming a bullish setup on the weekly timeframe with a good risk-to-reward ratio. If the stock sustains above ₹700, a strong move towards ₹820 and later ₹930+ looks possible. Traders should keep a strict stop-loss at ₹640 to protect capital.
Paras Defense Long PositionalHammer formation at weekly 50EMA, 50% Fib retracement. Price likely will enter 3rd wave on monthly. Targets as per Elliott Analysis. SL below hammer low

paras defense updateparas defense is continuously declining, as you can see in the chart. it has broken box zone. and now taking support at 50% fib level which is considered as strong demand zone.
how to read the current price action?
gap fill:
if you can notice there is a gap which price is filling now. It was expected that if the 1258 is broken on dcb, market will fill the gap.
Fib Level:
price is trading near 50% fib level which is considered as very strong support zone. price can start bouncing back from the black line if market condition is strengthened during next week.
My best bet:
I am still bullish in this stock and accumulating it whenever it goes 5% down. i will hold till black line. if price closes below black line on weekly basis. I'll book my loss and will wait for fresh HH & HL o be formed.
Light hearted people or newbees please analysis your risk appetite before investing or ask your financial advisor before investing.
What can be expected:
Price may reach upto initial breakout point if it breaks the black line. wait for HH HL on 75 min timeframe to make fresh position.
When the strength will be back in paras defense?
ADX will be upward on daily time frame (preferred above 25)
DMI+ will be above 25 and above dmi-
My View is still very bullish. Just waiting for trend change or price reaction near black line

Paras Defence updatetrain has reached on station number 1300.
it is a good Fibonacci support. i can also retest ipo candle high .
moving as per plan

Paras Defence - mai jhukega nhi Saálacontinuously from last two days its making inside candle .
Now its moving up . however volume is still low.
interesting to watch now

Paras Defence update Interesting to watch
Paras Defence is sustaining 1400 level.
after today's low at 1401.15 it has retraced.
I am still waiting for 1300 level but next 6 months view is very bullish.
Let's see. It is Testing patience

Paras Defence UpdateA good closing below previous day low after a long time. This indicates a correction in near future. however I'll watch today's closing for the confirmation.
A good correction will be seen if closing of 9th july closes below 8 july low.
However after a sudden fall, price have retraced almost 60 points.
Good to watch it on 9th july closing.
Also, Good to watch for Fibonacci Levels for correction.
I am waiting for price to come at .33 level of fib.

PARAS DEFENCE - Classic BO (Case Study) | Super BullishPrice Analysis & overview:
1. The overall defence sector is super bullish and the stock has started outperforming.
2. The strength of the BO candle shows big money is buying it.
3. Retest of the ATH BO level would be the best entry for a long position.
4. We rarely find these types of classic textbook type of picture-perfect breakouts!
5. We should remember that we should not generalise these types of clean breakouts.
- Stay tuned for further insights, updates and trade safely!
- These are my personal views.
- If you liked the analysis, don't forget to leave a comment and boost the post. Happy trading!
Disclaimer: This is NOT a buy/sell recommendation. This post is meant for learning purposes only. Please, do your due diligence before investing.
Thanks & Regards,
Anubrata Ray

Paras defence-IHNS pattern formationParas defence is a stock from defence manufacturing sector.
Stock has formed inverted head and shoulders pattern.
Risky traders can enter before breakout for better risk reward.
Stock will fly once the neckline is crossed. Decent stock for long term as defence sector is major beneficiary of India's Make in India program.

PARAS Long ideaparas defence stock forming Inverse Head & Shoulder in weekly.
In Daily, It is forming Inverted H&S.
It looks bullish for me.
Chart Analysis & Targets are given. Need to plan accordingly

Paras, another stock want to dance, setting up well-Long base BO then
Elections results create volatility but
Setting up again:
-Recovered fast with volumes then red candle on low vol n bounced from 10 ema
-Defence stocks are making good setups
-Good shakeout of 21 ema
-tightness

Mazdock, setting up again with other defence stocks. -Posted great results. Whole defence sector strong.
-Breakout from long base.
-After 4th July (Election result day) volatility bloodbath, recovered fast n filled that big red candle.
-Tightness
- Lots of white dots (5% move with 1M volume) suggests big institutions are behind the stocks, retailers cant create that much volume.
-Downtrendline tested 3 times.

Paras Defence : Defence industry
#parasdefence
Moving out of longrange BO as well.
Parasdefence big potential for coming months.
Keep in Radar.
Disclaimer :consult your financial advisor.
#technicals #StocksToBuy #stocks #StockMarkets #investing #Index #Nifty #Breakout #BreakoutStock
#Defence
Paras Defence and Space Technologies LtdPARAS DEFENCE is involved in developing systems for defense and space applications. It operates under five segments, Defense & Space Optics, Defense Electronics, Heavy Engineering, Electromagnetic Pulse Protection Solutions and Niche Technologies.
Note:
1. Views are personal and for educational purposes only. Recheck and take the trade as per your RR.
2. Always remember SL is your lifeline, not the big target...
3. Follow us for more patterns and like, share so that we feel it is helpful to many and share more patterns...
3. Views given here is not a tip rather it is for educational purpose... Aftermarket opens, the condition might change so learn to handle different conditions...
Keep an eye ladies and gentlemen. Cheers and Happy Trading

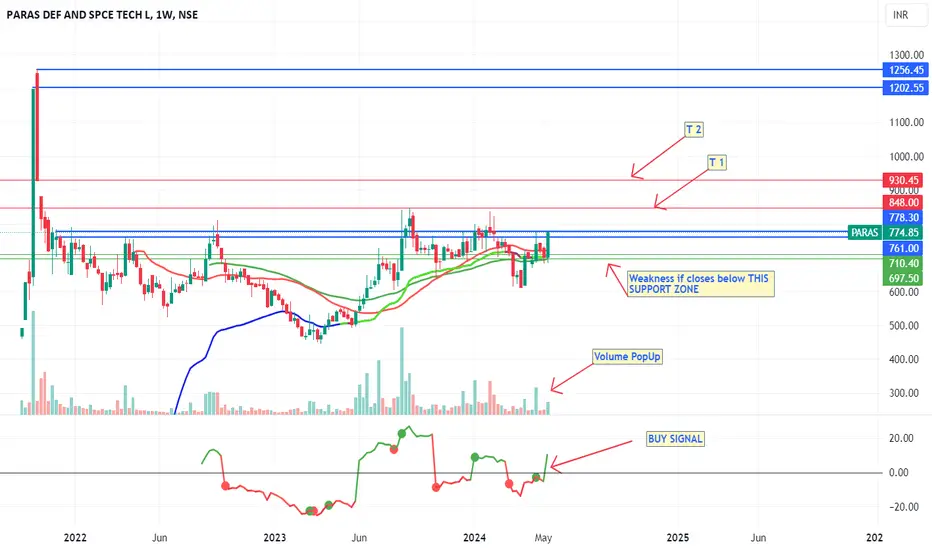
retested breakout in paras defenseA bullish Inverted Head & Shoulder Chart Pattern Breakout on the Weekly Time frame of NSE:PARAS
Price Action supported by very good volume.
The stock is currently in uptrend making higher highs and higher lows.
One can add this stock into their stocks to buy list and initiate the long trade as per the levels mentioned on the chart
Stop loss will be on a Weekly closing basis.
Trend Analysis :- UP Trend
Chart Pattern :- Bullish Inverted Head & Shoulder Pattern
Technical Indicator :- Positive MACD Crossover
Disclaimer: This is for educational purpose only.


PARAS gave breakout from falling wedge and ready for next move.Paras offers a wide range of Products & Solutions for Defense & Space Applications. Success of Chandrayan may affect this stock. It gave breakout from falling wedge and ready for next move.


PARAS - Ichimoku Bullish Breakout Stock Name - Paras Defence and Space Technologies Ltd
Ichimoku Cloud Setup :
1). Today's close is above the Conversion Line
2). Future Kumo is Turning Bullish
3). Chikou span is slanting upwards
All these parameters are showing bullishness at Current Market Price
and more bullishness AFTER crossing 620
#This is not Buy and Sell recommendation to any one. This is for education purpose and a helping hand to learn trading in Market.
# Cloud Trading
# Ichimoku Cloud
# Ichimoku Followers
I hope you all like my analysis.
Please do share your thoughts into comment section.
Please give a like, share & subscribe for daily analysis.

PARAS Daily looking bullishPARAS Daily has trendline breakout/inverted head and shoulders breakout with 200 ema support on daily candle. Good to buy at 580 for targets of 697,811 with sl below 523

Muhurat Trading picks - 2022What's your Diwali picks ?🤔 comment down below.
1. TATAMOTORS
C.M.P - 398.2
TARGET - 447
Potential Upside % +12.26 %
2. M_M
C.M.P - 1257
TARGET - 1425
Potential Upside % +13.37 %
3. FEDERALBNK
C.M.P - 132.85
TARGET - 150
Potential Upside % +12.91 %
4. SBIN
C.M.P - 561.65
TARGET - 640
Potential Upside % +13.95 %
5. BDL
C.M.P - 954.85
TARGET - 1078
Potential Upside % +12.90 %
6. PARAS
C.M.P - 643.45
TARGET - 740
Potential Upside % +15.01 %
7. ONGC
C.M.P - 131.45
TARGET - 148
Potential Upside % +12.59 %
8. POWERGRID
C.M.P - 216.6
TARGET - 248
Potential Upside % +14.50 %
9. RECLTD
C.M.P - 93.55
TARGET - 105
Potential Upside % +12.24 %
10. BAJAJFINSV
C.M.P - 1681.95
TARGET - 1932
Potential Upside % +14.87 %
11. ITC
C.M.P - 344.85
TARGET - 389
Potential Upside % +12.80 %
12. VBL
C.M.P - 1011.25
TARGET - 1145
Potential Upside % +13.23 %
13. LEMONTREE
C.M.P - 84
TARGET - 96
Potential Upside % +14.29 %
14. INDHOTEL
C.M.P - 313.55
TARGET - 360
Potential Upside % +14.81 %
15. KPITTECH
C.M.P - 711.8
TARGET - 801
Potential Upside % +12.53 %
16. HCLTECH
C.M.P - 1025
TARGET - 1175
Potential Upside % +14.63 %
17. VEDL
C.M.P - 279.95
TARGET - 323
Potential Upside % +15.38 %
18. HINDALCO
C.M.P - 392.1
TARGET - 433
Potential Upside % +10.43 %
19. LAURUSLABS
C.M.P - 477
TARGET - 540
Potential Upside % +13.21 %
20. SUNPHARMA
C.M.P - 978.95
TARGET - 1144
Potential Upside % +16.86 %
21. IOC
C.M.P - 67.5
TARGET - 77
Potential Upside % +14.07 %
⚠️ Important: Always maintain your Risk & Reward Ratio.
⚠️ Purely technical based pick.
✅Like and follow to never miss a new idea!✅
Disclaimer: I am not SEBI Registered Advisor. My posts are purely for training and educational purposes.
Eat🍜 Sleep😴 TradingView📈 Repeat🔁
Happy Diwali 🪔🎉✨
Happy learning with trading. Cheers!🥂

paras defencecompletely missed sharing chart guys. can add at retest .
SL will be 600 levels on DCB.
