Symmetrical Triangle Masterpiece : Multi-Layout W,DtfStep into this dynamic multi-layout window opened right in front of you—a split-screen showcase of pure price action artistry.
Left Side: Weekly Timeframe
Here, a symmetrical triangle (a classic continuation or reversal pattern formed by two converging trendlines of equal slope) takes center stage. Framing it are a green uptrend line (connecting higher lows for bullish structure) and a red downtrend line (linking lower highs for bearish pressure), creating a tightening coil of market indecision. A subtle white counter-trend line (acting as dynamic support/resistance opposing the main trend) adds layers of geometric elegance, hinting at its heightened significance when viewed on lower timeframes.
Right Side: Daily Timeframe
Flipping to the daily chart reveals how this white line shines as a pivotal counter-trend barrier, interacting seamlessly with intraday swings. Multi-timeframe analysis (comparing higher timeframe structure with lower timeframe details for confluence) illustrates the fractal beauty......how weekly patterns cascade perfectly into daily price action without a single forecast or bias.
This is markets at their most poetic: old-school chart patterns and trendlines weaving symmetry across scales. No predictions, just appreciation for the elegance.
Disclaimer: This post is for educational and illustrative purposes only, highlighting historical price action and chart patterns. It does not constitute financial advice, trading recommendations, or predictions of future market movement. Always conduct your own research and consult a professional advisor
Pattern

INFIBEAM 1 Week Time Frame 📌 Current Price Snapshot
📍 Latest traded price: ₹16.25 – ₹16.30 approx. (last session)
📈 52-week range: ₹13.63 (low) – ₹22.02 (high)
📊 Near-Term 1-Week Technical Levels
🔰 Pivot Point (Reference)
Pivot: ~₹15.6 – ₹15.7 (neutral zone for short-term bias)
🛑 Resistance (Upside Targets)
These are levels where price may face selling pressure this week:
Level Mark (Approx) Notes
R1 ~₹15.8 – ₹16.0 First hurdle near current action zone
R2 ₹16.3 – ₹16.4 Key near-term resistance — breakout above this could add momentum
R3 ₹16.8 – ₹17.0 Next upside target if buyers remain strong
👉 A decisive daily close above ~₹16.4–₹16.5 can open the door toward ₹17.0+ in the week.
🧱 Support (Downside Floors)
These are levels where dips may find buyers this week:
Level Mark (Approx) Notes
S1 ₹15.3 – ₹15.4 First strong support — psychologically key pivot band
S2 ₹15.0 – ₹15.1 Next cushion below if the market weakens
S3 ₹14.8 – ₹14.7 Deeper support zone if selling accelerates
👉 A breakdown below ~₹15.0 would increase bearish pressure for the week.
📈 Short-Term Bias Interpretation
Bullish scenario:
If price holds above ₹15.6–₹15.7 pivot and breaks ₹16.3–₹16.4, the next near-term move could be toward ₹16.8–₹17.0+.
Neutral / range-bound:
Between ₹15.3 and ₹16.3, expect consolidation/trading range.
Bearish scenario:
Sustained trading below ₹15.3 risks weakening into ₹15.0 and lower.
🧠 Quick Trading Guide (1-Week)
📍 Watch for reaction at:
✔ Above ₹16.3–₹16.4 = possible upside extens ion
✔ Below ₹15.3 = risk of deeper pullback
📊 Trend cues: Recent technical indicators show mixed momentum — short-term range with pickup if buyers assert near pivot area.

SAMMAANCAP 1 Month Time Frame 📈 Current Snapshot (as reference)
Last traded / recent price around ~₹147 – ₹151 on NSE (varies with intraday moves).
52‑week range: ~₹97 – ₹192.9.
🔑 1‑Month Key Levels – NSE Pivot, Support & Resistance
Monthly Pivot Levels (short‑term framework):
These come from pivot analysis that captures intermediate trend areas over the past sessions — useful for 1‑month traders.
📍 Pivot Reference (Monthly)
Pivot (central reference): ~₹146‑₹147
This is the main gravity level — above it suggests bullish bias; below implies bearish bias in the short term.
🛑 Resistance Levels (Upside)
These are zones where price may face selling pressure if it rallies:
R1: ~₹155 – ₹157
R2: ~₹164 – ₹165
R3: ~₹173 – ₹175
Resistance areas represent possible profit‑taking or reversal zones near recent reaction highs.
🧱 Support Levels (Downside)
These levels may act as demand zones if price corrects:
S1: ~₹137 – ₹138
S2: ~₹128 – ₹130
S3: ~₹120 – ₹122
Below S1, sellers may dominate, with deeper support closer to S3 in an extended correction.
⚠️ Note
These levels are derived from pivot and technical data (not financial advice). Market news/events (e.g., legal developments, earnings) can quickly shift short‑term trend dynamics, so use stops and risk management if trading.

CREDITACC 1 Week Time Frame 📌 Current Price Context (21 Jan 2026)
Approx current price: ~₹1,330 – ₹1,370 on NSE as of recent trading session.
📊 Weekly Technical Levels (1-Week Timeframe)
These levels are derived from recent weekly pivot analysis (reflecting highs/lows and average weekly trend):
Weekly Pivot Point: ~ ₹1,300 – ₹1,305
Weekly Resistance Levels:
R1: ~ ₹1,325 – ₹1,330
R2: ~ ₹1,350 – ₹1,360
R3: ~ ₹1,375+
Weekly Support Levels:
S1: ~ ₹1,275 – ₹1,280
S2: ~ ₹1,250 – ₹1,255
S3: ~ ₹1,225 – ₹1,220
(Classic pivot study — see weekly pivot table)
📈 Short Summary of Weekly Bias
Bullish scenario:
if the price sustains above weekly pivot (~₹1,300) and breaks above R1 (~₹1,330), momentum favors moves toward R2 (~₹1,350-1,360) and possibly R3 (~₹1,375) for the coming week.
Neutral / Range scenario:
Between ₹1,275 to ₹1,330, price tends to oscillate within the weekly range with no clear directional bias — traders watch pivot and R1/S1 zones.
Bearish scenario:
A break below S1 (~₹1,275) increases the risk of deeper probes toward S2 (~₹1,250) or S3 (~₹1,220) on the weekly chart.
📌 How to Use These Levels
1. Short-term traders (swing): Watch catalystsensing breaks above R1/R2 for bullish continuation setups or break below S1/S2 for bearish setups.
2. Position traders: Weekly pivot and 50/100 SMA clusters (around ₹1,300-₹1,340) act as key decision zones for holding or trimming positions.

UNIONBANK 1 Week Time Frame 📊 Current Price (Weekly Context)
~₹162 – ₹163 per share (latest live/NSE quote).
📈 Weekly Support & Resistance Zones (Approx)
Resistance Levels (Upside)
These are key levels to watch if the weekly price continues uptrend:
• R1 ≈ ₹167–₹168 – immediate resistance near recent 52‑week high.
• R2 ≈ ₹170–₹172 – near psychological/upper range targets.
• R3 ≈ ₹175+ – extended zone if momentum accelerates (trend continuation).
Support Levels (Downside)
Important weekly support levels where pullbacks could find buying support:
• S1 ≈ ₹158–₹159 – near recent short‑term pullback zone.
• S2 ≈ ₹155–₹156 – near mid‑range cluster of moving averages.
• S3 ≈ ₹150–₹152 – deeper support aligned with 50‑day average zone.
🔄 Technical Indicators Outlook (Weekly / Short‑Term)
Momentum & Trend:
Weekly technicals show bullish momentum with RSI moderately bullish and MACD positive on recent data.
Price remains above key EMAs (20, 50, 100, 200 averages), which supports the uptrend.
Volatility:
ATR and trend indicators suggest active movement, so breaks above/below key levels can lead to sustained swings.
📌 Quick Weekly Levels Summary (Approx)
Level Type Price Zone
R3 (Strong Resist) ₹172–₹175+
R2 (Next Resist) ₹170–₹172
R1 (Immediate Resist) ₹167–₹168
Current Price ₹162–₹163
S1 (Immediate Support) ₹158–₹159
S2 (Mid Support) ₹155–₹156
S3 (Strong Support) ₹150–₹152

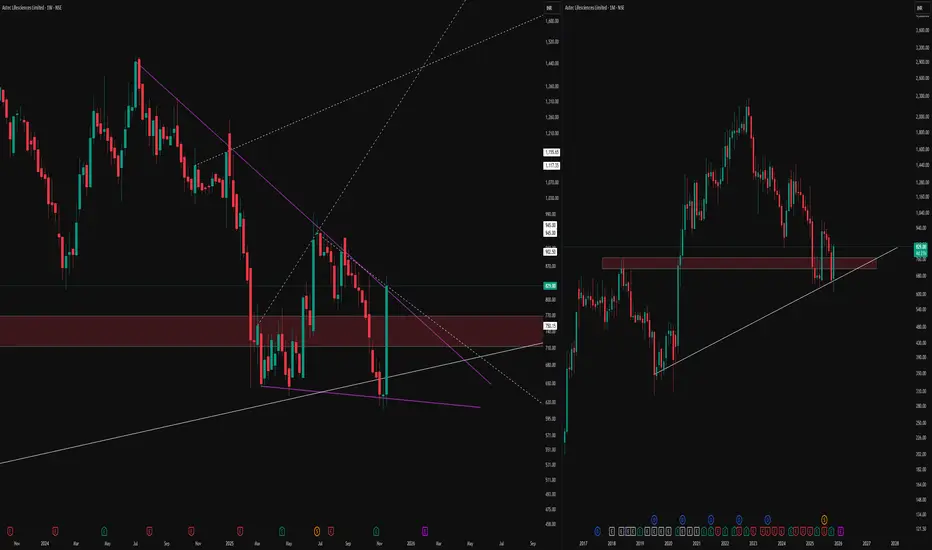
Multi-Timeframe Channel Mastery UnveiledTradingView's multi-window layout reveals pristine price action across weekly and monthly charts, highlighting structural precision without forecasts.
Both timeframes demonstrate unwavering respect for key lines and zones, underscoring market geometry's reliability.
Monthly Chart Insights
The right-side monthly view features a robust supply zone where sellers dominate, enforcing repeated rejections with textbook accuracy. A white trend line provides dynamic support, paired with the red parallel channel line creating a textbook channel that price honors meticulously. This setup exemplifies how channels contain swings beautifully.
Weekly Chart Patterns
On the left, weekly timeframe displays two pivotal pattern lines: a counter trend line and a primary trend line, both tracked flawlessly through advances and retreats. These lines form the backbone of the structure, filtering noise and revealing order in motion.
Disclaimer
Purely educational analysis of past price action—no advice, signals, or predictions provided. Trading carries high risk of capital loss; perform independent due diligence and seek professional guidance.

Weekly Timeframe Price Action MasteryObserve the red supply zone where price consistently faces resistance, halting upward moves with precision. The green demand zone, formed after a decisive breakout from prior resistance, now acts as robust support for subsequent bounces. The white counter trend line serves as the pattern's key action line, guiding price movements with remarkable adherence across multiple tests.
Zone Dynamics
Supply zones in red mark areas of overhead selling pressure on weekly charts, often leading to rejections. Demand zones in green emerge post-breakout when former resistance flips, attracting buyers on retracements. These zones filter noise effectively in trending markets.
Counter Trend Line Role
This white line defines the counter-trend structure, respected through pullbacks and rallies. Price follows it as a dynamic guide, confirming pattern integrity without implying direction. Such lines enhance zone analysis by highlighting momentum shifts.
Disclaimer
This post showcases historical price action only and constitutes neither financial advice nor trading signals. Trading involves substantial risk of loss; conduct your own analysis and consult professionals.

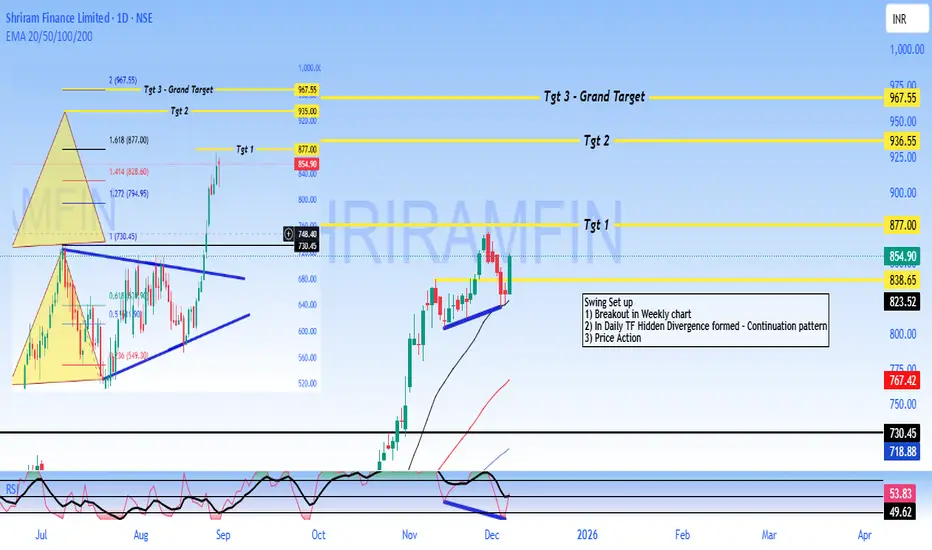
SHRIRAM - Buy - SwingTrading #Shriram Finance Limited - #Technical Analysis
Price: 854.90
#Technical Setup
Pattern: Continuation pattern with bullish hidden divergence following weekly breakout
Key Levels:
- Target 1: 877.00
- Target 2: 936.55
- Target 3: 967.55
- Support: 838 - 825 (critical)
- Major Support: 730.45
#Outlook
The chart shows a swing trading setup with upside potential toward 877 - 967 if support at 838 holds. A break below 825 would invalidate the bullish structure.
DISCLAIMER
This is NOT investment advice. This analysis is for educational purposes only. Trading involves substantial risk of loss. Always conduct your own research and consult a SEBI-registered financial advisor before making investment decisions. Past performance and technical patterns do not guarantee future results. The author assumes no responsibility for any losses incurred.
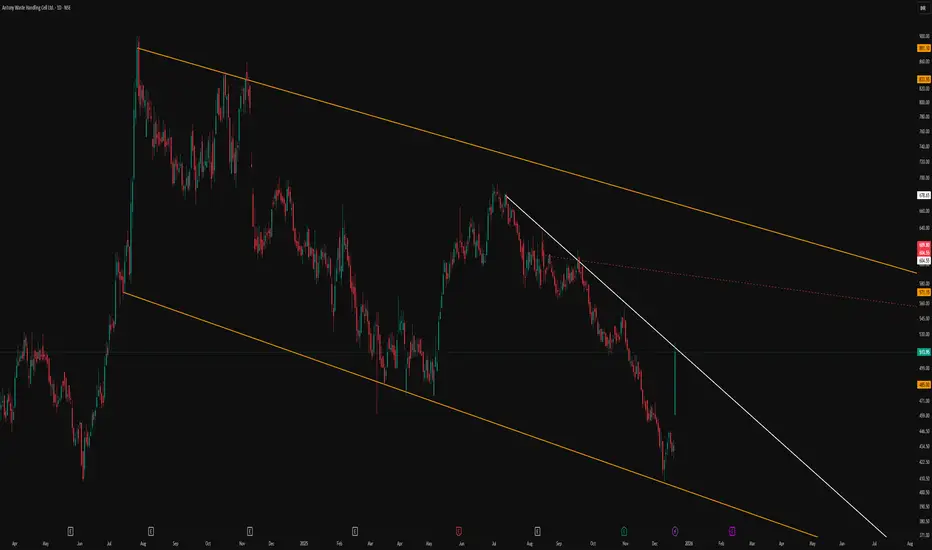
Classic Descending Channel With Clear Structural LevelsThe primary feature of this chart is the broad descending parallel channel marked by the orange lines, which frames the entire corrective phase in a neat, orderly manner. Price has repeatedly respected both the upper and lower boundaries, reinforcing the relevance of this channel as a dominant structure.
A trend‑changing resistance line is drawn in white, connecting swing highs and visually separating the prevailing downtrend from any potential shift in behavior. This line serves as a clear reference for how price has reacted to supply zones within the channel, without implying any future breakout or directional bias.
The red dotted line acts as an internal, hidden line derived from prior price interaction, helping to map out the internal rhythm of the move. Overall, the chart is intended purely as a structural illustration of how price respects channels and internal reference lines, without any forecast or trade signal.
SRF 1 Week Timw Frame 📌 Current Price Context (as of latest close):
• SRF was trading around ₹3,023–₹3,024 recently.
📊 Weekly / Short-Term Key Levels
📈 Resistance Levels
These are possible upside targets where price may face supply pressure:
R1 (Immediate resistance): ~₹2,971–₹2,990 — key level to break for near-term upside.
R2: ~₹3,007–₹3,031 — next hurdle after R1.
R3 / Higher Resistances: ~₹3,060–₹3,100+ zones if momentum continues.
A close above ₹3,000–₹3,030 on the weekly chart often signals stronger short-term bullish bias.
📉 Support Levels
These are downside floors that may act as buyers’ interest zones:
S1 (Immediate support): ~₹2,873–₹2,900 — first key support area.
S2: ~₹2,811 — deeper support if the first level breaks.
S3: ~₹2,775 or lower — if broader weakness materialises.
📌 Weekly Pivot Level
• Pivot zone around ₹2,950–₹2,990 can act as a gauge of short-term trend direction. Above it = bullish bias; below it = bearish bias.
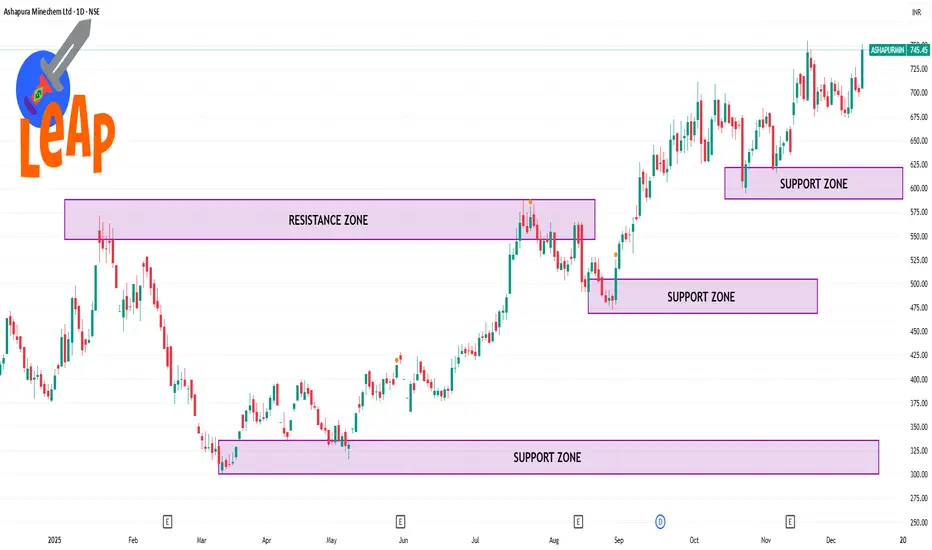
ASHAPURMIN 1 Day Time Frame 📌 Current Live Price (Daily)
Approx ₹745.4 on NSE at latest available update.
This reflects the recent trading session where the stock moved between ~₹705 (low) and ~₹751 (high) before settling near ₹745.45.
📊 Daily Technical Levels (Pivot / Support / Resistance)
🔹 Pivot Point Levels (based on yesterday’s range)
(These can be used for today’s intraday bias)
Daily Pivot: ~₹733.8
Support 1: ~ ₹716.6
Support 2: ~ ₹687.8
Support 3: ~ ₹670.6
Resistance 1: ~ ₹762.6
Resistance 2: ~ ₹779.8
Resistance 3: ~ ₹808.6
(Classic pivot method daily)
DRAGONFLY LTDDRAGONFLY INC, as per chart view it formed FALLING WEDGE PATTERN and made breakout with entry level $6.88 with EMA crossover. We can expect the Final target to $13.

DRAGONFLY INCDRAGONFLY INC, as per chart view it formed FALLING WEDGE PATTERN and made breakout with entry level $6.88 with EMA crossover. We can expect the Final target to $13.

How to Observe Weekly and Monthly Chart StructureThe weekly (left) and monthly (right) timeframes, bringing attention to a confluence zone of technical interest.
On the weekly chart, price has developed a compressing pattern, defined by distinct purple lines, with dotted lines marking hidden channel boundaries and long-term levels for context. The highlighted supply-demand zone reflects previous market activity, where buyers and sellers actively shaped reversals and consolidations.
On the monthly timeframe, the same zone aligns with an established rising trendline support, indicating an area where price has historically responded with high volume and volatility. Multiple timeframe alignment and proximity to major horizontal structures
No forecasts or breakout signals are implied; the focus is on mapping price responses and monitoring structure, not predicting direction. Consistent observation of these overlapping technical factors may help traders build sound trading hypotheses in line with their individual strategies.
Inverted Head and Shoulders - Bullish Setup🔎 Overview
The Inverted Head & Shoulders is a bullish reversal pattern that forms after a downtrend.
It signals that selling pressure is weakening and buyers are gradually gaining control.
The structure has three major lows: Left Shoulder, Head (deepest low), and Right Shoulder — followed by a breakout above the Neckline, confirming a trend shift to the upside.
──────────────────────────────────────────
🛠 How the Pattern Forms
1️⃣ Left Shoulder
• Price creates a swing low, then bounces.
• This marks the first buyer reaction in the downtrend.
2️⃣ Head (Deepest Low)
• Price drops below the Left Shoulder to form a deeper low.
• Sellers try to extend the downtrend, but strong buying absorbs the pressure.
• This creates the “Head” — the lowest point in the structure.
3️⃣ Right Shoulder
• Price rises from the Head, pulls back again, but forms a higher low
• This higher low signals seller weakness and early buyer dominance.
4️⃣ Neckline Formation
• Draw a line connecting the highs of the Left Shoulder and Right Shoulder.
• This Neckline acts as the main breakout level confirming the reversal.
──────────────────────────────────────────
🛠 How to Use the Pattern
✔ Validation (Breakout Confirmation)
• The pattern is confirmed only when a Successive candles closes above the Neckline / Validation Line.
• This breakout indicates momentum shift → buyers take control.
• Entries can be taken on breakout or retest.
✔ Devalidation (Failure Protection)
• If price closes below the Devalidation Line , the pattern becomes invalid.
• This protects traders from false breakouts or premature entries.
──────────────────────────────────────────
📊 Chart Explanation
Left Shoulder (0.45101) → First swing low where buyers responded.
Head (0.44742) → Deepest low where strong accumulation occurred.
Right Shoulder (0.44966) → Higher low showing seller exhaustion.
Neckline → Connects highs of both shoulders; main breakout resistance.
Validation Line → Breakout zone; closing above confirms bullish pattern.
Devalidation Line → Close below invalidates the pattern and stops the setup.
──────────────────────────────────────────
🟢 Summary
• Classic bullish reversal structure after a downtrend.
• Head forms the deepest low → buyers accumulate heavily.
• Right Shoulder forms higher low → sellers lose steam.
• Breakout above Neckline confirms shift from sellers → buyers.
• Devalidation line protects against false signals.
──────────────────────────────────────────
⚠️ Disclaimer
📘 For educational purposes only.
🙅 Not SEBI registered.
❌ Not a buy/sell recommendation.
🧠 Purely a learning resource.
📊 Not Financial Advice.

Sharing my Secret Trading Mindset with Price actionIn this 18 minute video I will try to change the way you trade by sharing my trading experience using charts older than 3 months .

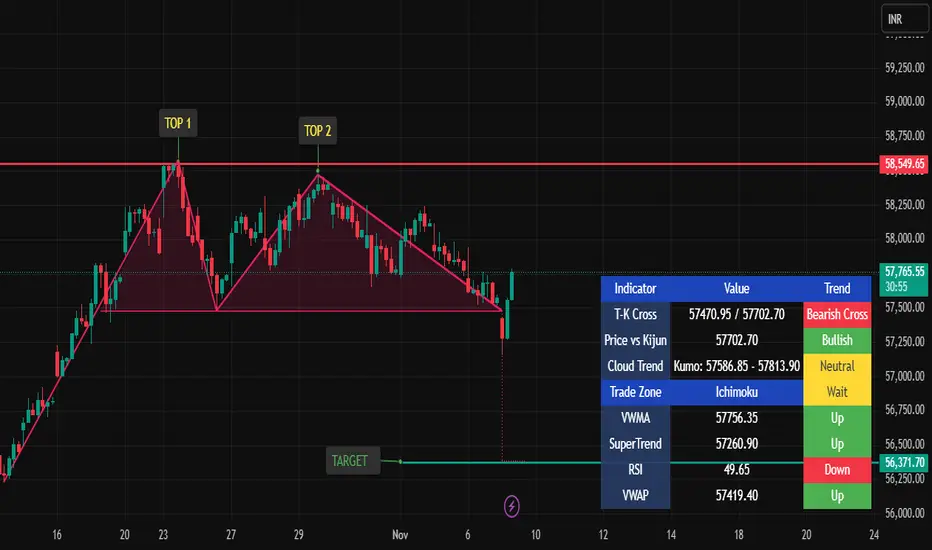
Bank Nifty – Double Top Pattern Analysis📉 Bank Nifty – Double Top Breakdown: Initiate Sell Signal
The chart confirms a Double Top pattern on Bank Nifty, signaling a bearish reversal from the recent highs near ₹58,550. Both peaks faced strong rejection at this resistance, reflecting weakening bullish momentum.
🔹 Sell Signal Trigger:
Initiate short positions once Bank Nifty breaks and closes below ₹57,480 (neckline support).
This breakdown confirms pattern completion and potential start of a downward move.
📊 Trade Setup
Stop Loss: ₹58,550 (above recent highs / resistance)
Target : ₹56,370
🧭 Technical Rationale
Pattern: Double Top – Bearish reversal confirmation
Structure: Two failed attempts to cross ₹58,550 indicate selling dominance.
Momentum: Weakening buying strength visible; a neckline breakdown often triggers a short-term trend reversal.
Volume Confirmation: Look for increased selling volume on the breakdown to validate the move.
⚠️ Disclaimer
This analysis is purely for educational purposes and not a recommendation to buy or sell.
Trading involves substantial risk — always conduct your own research or consult a financial advisor before taking any trade.
VCP Formation within Symmetrical Triangle above 200 EMAThis chart displays a Volatility Contraction Pattern (VCP) developing within a classic symmetrical triangle on the daily timeframe. Two sharply converging trendlines encapsulate the price action with the lower line connecting a series of higher lows (the trendline) and the upper line linking lower highs (counter trendline). Such convergence is characteristic of symmetrical triangles, which represent a period of price consolidation and equilibrium between buyers and sellers.
Volume tends to contract as the pattern matures, signaling market indecision and reduced volatility. Notably, this consolidation is taking place right around the 200-day moving average, which serves as an important reference point for longer-term market participants. The convergence of price and volume patterns here aligns with textbook VCP behaviour and highlights the potential for significant crowd psychology shifts.
This post’s intent is observational and educational, focusing on the visual behavior of price and volume embedded within technical patterns. Studying such symmetries can strengthen understanding of market structure and technical analysis skills, allowing for systematic review rather than speculative outlooks or trade signals.
Tamilnad Mercantile Bank – 1D Chart | Strong Resistance Zone🟢 Tamilnad Mercantile Bank (TMB) – 1D Chart | Strong Resistance Zone Ahead
📊 Chart Setup:
TMB is testing its major 1-year resistance zone around ₹510, a key level that has capped price movements for months. A strong daily close above ₹510 could trigger momentum towards higher targets.
🔹 Resistance: ₹510 (Major 1-year resistance)
🔹 Targets on Breakout: ₹535 / ₹600
🔹 Supports: ₹466 / ₹440
🔹 View: Price consolidating near breakout zone. Sustained close above ₹510 can signal trend continuation.
🏦 Fundamental Update – Q2 FY26 Results Highlights:
Tamilnad Mercantile Bank delivered steady performance with profit growth and improved asset quality.
• Net Profit: ₹318 Cr ↑ (▲4.95% YoY)
• Total Business: ↑11.40%
• Deposits: ₹55,421 Cr ↑12.32%
• Advances: ↑10.5%
• Net Interest Income: ₹597 Cr ↑0.17%
• Gross NPA: ↓ to 1.01%
• Net NPA: ↓ to 0.26%
• Capital Adequacy Ratio (CAR): Strong at 30.96%
➡️ Stable performance, improving asset quality, and strong capital base add confidence to the technical setup.
📈 For educational purpose only. Not a buy/sell recommendation.

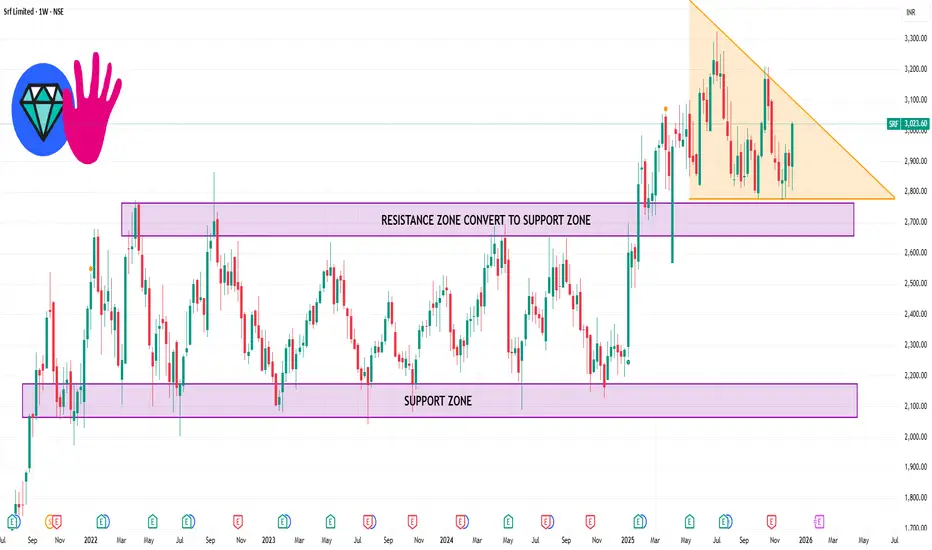
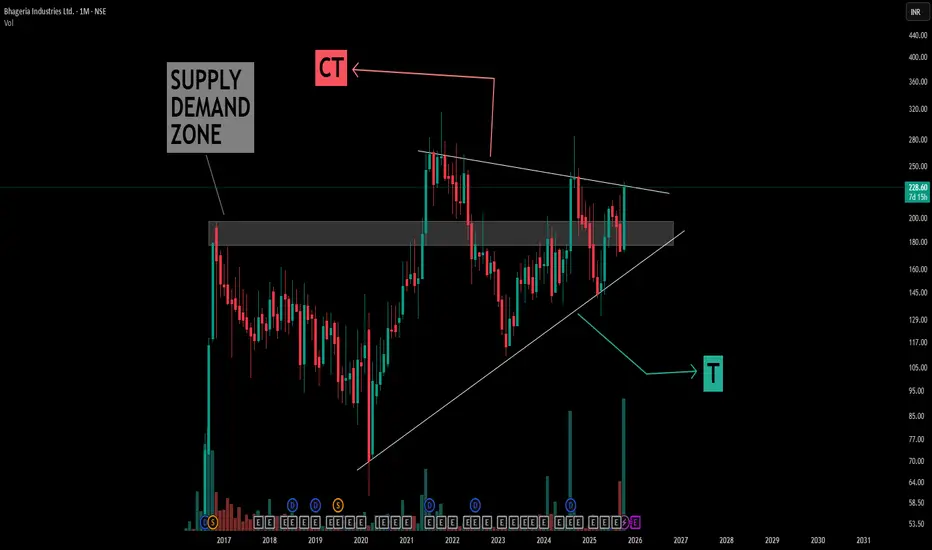
Understanding Symmetrical Triangle Patterns in depthThis chart illustrates a classic example of a symmetrical triangle pattern formed over several years, with simple compression trendline (CT) and trigger (T) lines drawn in white for clarity.
Key learning points from the structure:
- Symmetrical Triangle Formation: The pattern is defined by converging trendlines representing successive lower highs and higher lows, indicating a period of price consolidation and market indecision
- Supply Converts to Demand: The boxed area initially acted as supply, where price faced resistance repeatedly. Over time, after multiple interactions and a structural shift, this area began to act as demand, offering support to subsequent price movements. This showcases how prior resistance can evolve into a support zone as market dynamics shift.
- Pattern Context: A large symmetrical triangle is forming above this zone, highlighting sustained equilibrium between buyers and sellers, and price compressing within clearly defined boundaries.
- Educational Note: Patterns like these offer valuable case studies for understanding consolidation phases, the role of supply and demand flipping, and how market structure can evolve. They can be identified and studied without making directional assumptions, serving as an excellent foundation for technical analysis practice.
This post is aimed purely at technical education, emphasizing the process of chart marking, pattern recognition, and structural interpretation, without making market predictions or outcome forecasts.
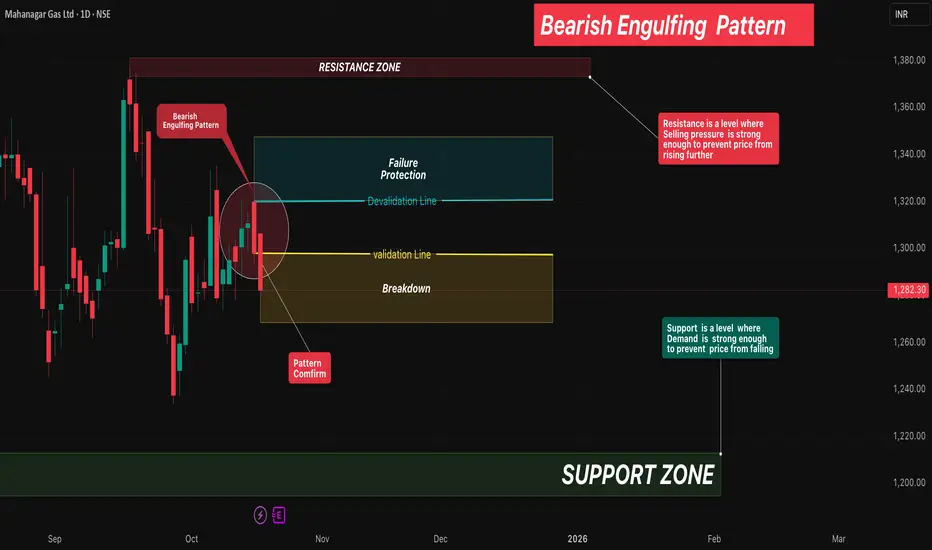
Bearish Engulfing Pattern🔎 Overview
The Bearish Engulfing Pattern is a strong two-candle reversal formation that signals a potential shift from an uptrend to a downtrend.
It occurs when a small bullish (green) candle is immediately followed by a large bearish (red) candle that completely engulfs the prior candle’s body.
This shows a clear shift in market psychology — buyers initially push the price higher, but sellers step in with force and erase those gains, marking the start of bearish momentum.
____________________________________________________________
📔 Concept
A Bearish Engulfing occurs when:
1️⃣ The first candle is a small green candle continuing the uptrend.
2️⃣ The next candle is a large red candle whose body completely engulfs the green candle’s body.
3️⃣ This pattern signals that sellers have regained control after buyer exhaustion.
____________________________________________________________
📌 How to Use
✅ Validation → The candle must close below the open of the red candle to confirm bearish reversal.
❌ Devalidation → If price closes above the close of the red candle before validation, the signal fails.
This structured confirmation helps filter false breakouts and define clear risk levels.
____________________________________________________________
📊 Chart Explanation
• Symbol → NSE:MGL
• Timeframe → 1D
• On 15 Oct 2025 , a small green candle formed, continuing the uptrend.
• On 16 Oct 2025 , a large red candle engulfed the previous green body — confirming the Bearish Engulfing Pattern .
• On 17 Oct 2025 , price broke down further, validating the bearish reversal.
This sequence highlights how quickly market sentiment shifted from bullish to bearish control.
____________________________________________________________
👀 Observation
• The Bearish Engulfing is most reliable near swing highs or resistance zones.
• High volume on the engulfing candle strengthens the reversal signal.
• Combining this pattern with confirmation tools like RSI, Supertrend, or Moving Averages
improves accuracy.
____________________________________________________________
💡 Conclusion
The Bearish Engulfing Pattern marks a clear shift in control from buyers to sellers.
Once validated, it indicates a high-probability reversal setup with defined stop-lose and target zones based on structure or risk-reward multiples.
___________________________________________________________
⚠️ Disclaimer
📘 For educational purposes only.
🙅 Not SEBI registered.
❌ Not a buy/sell recommendation.
🧠 Purely a learning resource.
📊 Not Financial Advice.
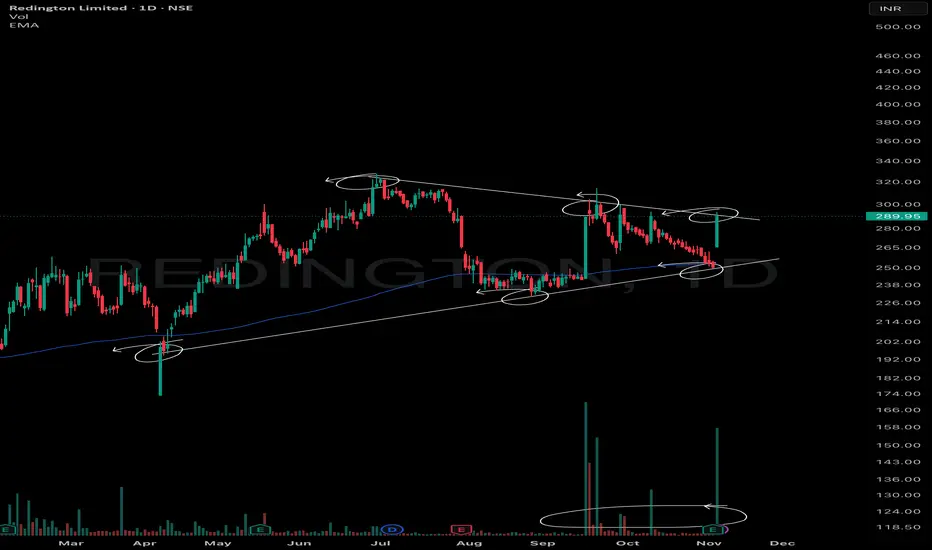
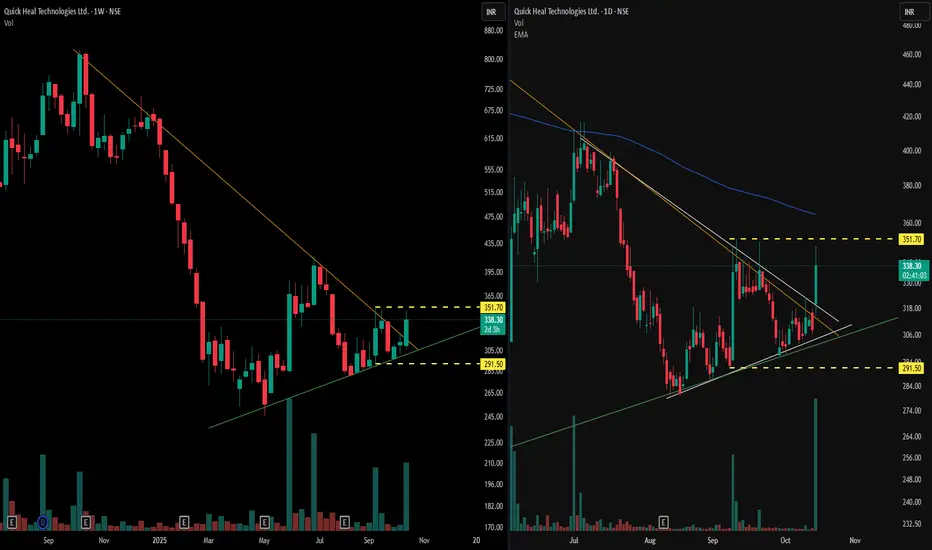
Multi-Timeframe VCP Observations📊 Weekly Time Frame Observations (left panel)
- It displays a visible pattern contraction structure, specifically a Volatility Contraction Pattern (VCP), formed over multiple months
- An orange trendline marking the descending resistance, and a green line depicting the rising support, which together highlight the range contraction of price
- Volume spikes coincide with specific price responses at these zones, denoting heightened activity during volatility periods within the VCP
📈 Daily Time Frame Observations (right panel)
- Presents a more compressed Volatility Contraction Pattern (VCP), mirroring the broader weekly setup but over a shorter time span.
- Below the blue 200-day exponential moving average
❗ Disclaimer: The above post is strictly observational and does not constitute any trading advice or predictions regarding breakout or price direction.
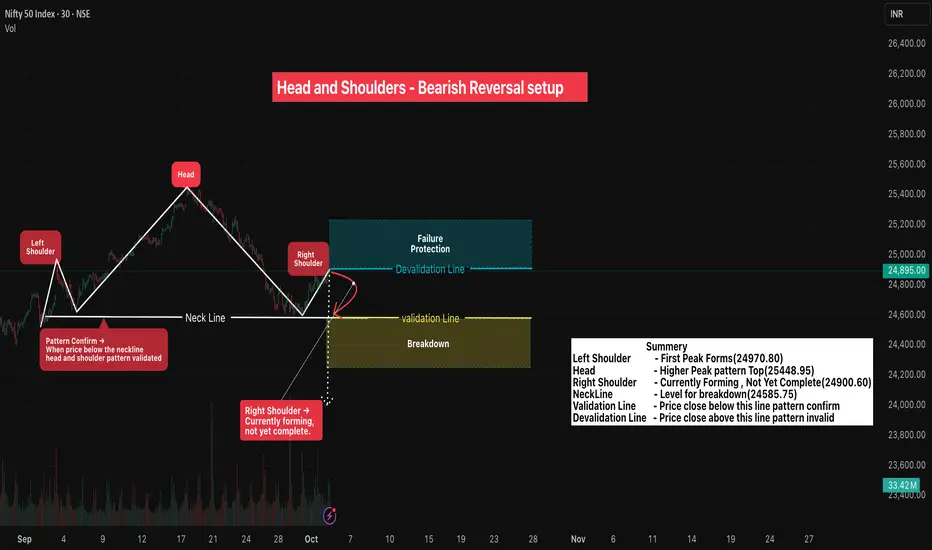
Head and Shoulders - Bearish Reversal Setup🔎Overview
The Head and Shoulders Pattern is a classic bearish reversal formation that signals a potential change in trend from uptrend to downtrend .
It is formed by three peaks:
- Left Shoulder → Price rises, forms a peak, then retraces.
- Head → Price moves higher than the left shoulder, creating the tallest peak, then falls back.
- Right Shoulder → Price rises again but fails to surpass the head, showing loss of momentum.
- Neckline → A line drawn through the two troughs between the shoulders and the head. A breakdown below the neckline confirms bearish sentiment.
This pattern reflects weakening buying pressure and strengthening selling interest, often appearing at the end of strong rallies.
____________________________________________________________
📌 How to Use
• ✅ Pattern Confirmed → When candle closes below the Validation Line
• ❌ Pattern Invalid → If candle closes above the Devalidation Line (Failure Protection).
• Protects against false signals & ensures structured risk management.
____________________________________________________________
📊 Chart Explanation
• Symbol → NSE:NIFTY
• Timeframe → 30m
• Left Shoulder Peak - 24970.30
• Head (Highest Peak) - 25448.95
• Right Shoulder Peak - 24900.80
• Neckline → Drawn by connecting the two troughs between shoulders and head.
• Validation Level → 24,585.75 → Close below = Pattern Confirmed .
• Devalidation Level → 24,910.65 → Close above = Pattern Invalid.
____________________________________________________________
👀 Observations
- The right shoulder often appears weaker, highlighting reduced buyer confidence.
- Once the neckline is tested multiple times, probability of a breakdown increases.
- Volume generally decreases during formation and expands during breakdown, strengthening confirmation.
- This setup helps traders anticipate major reversals rather than chasing late entries.
- Head and Shoulders is widely followed, making it self-fulfilling as many traders act on the same signal.
____________________________________________________________
💡 Why It Matters
Head & Shoulders is one of the most reliable reversal patterns, giving clear validation/devalidation levels for structured risk management. It helps avoid false breakouts and provides traders with predefined stop-loss and target zones.
____________________________________________________________
✅ Conclusion
Breakdown below the Validation Line confirms bearish reversal bias. Combine this with broader market context, volume confirmation, and disciplined position sizing for effective trading decisions.
____________________________________________________________
⚠️ Disclaimer
📘 For educational purposes only.
🙅 Not SEBI registered.
❌ Not a buy/sell recommendation.
🧠 Purely a learning resource.
📊 Not Financial Advice.