Technical Analysis: MERICO LTDTrend and Structure:
The chart shows a strong uptrend leading up to a recent pullback.
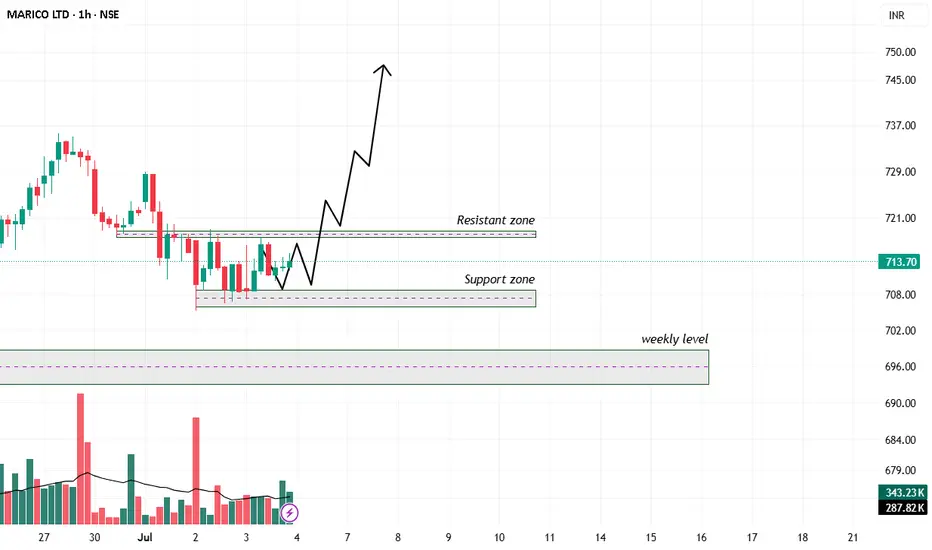
After the pullback, price is consolidating between a support zone (~708 INR) and a resistance zone (~720 INR).
There is a clear weekly support level marked around 690-695 INR below the support zone.
Volume is moderate but showing no large spikes, indicating potential consolidation.
Support and Resistance:
Immediate resistance zone is around 718-721 INR, acting as short-term overhead supply.
The support zone is roughly between 707-710 INR, serving as a base for potential bounce.
The weekly level below (roughly 690-695 INR) may act as a strong support if price breaks current support.
Price Projections:
The drawn projection suggests a short-term dip toward the support zone, followed by a strong bounce above the resistance.
This implies a possible bullish continuation after a minor correction or consolidation.
Volume:
Volume during consolidation is relatively steady.
Watch for volume pickup on a breakout above resistance for confirmation.
Trading plan:
Entry:
Consider entering a long position near or just above the support zone (~708-710 INR) when there is confirmation of buying interest (e.g., bullish reversal candlestick or volume spike).
Alternatively, a breakout entry can be taken above the resistance zone (~720-722 INR) with volume confirmation.
Stop Loss:
Place a stop loss below the support zone or slightly below the weekly level, around 700-705 INR to protect against downside risk.
Targets:
Initial target near the resistance breakout level (~720-725 INR).
Secondary target around 745-750 INR based on the upward arrow projection, representing the next resistance area.
Risk-Reward:
Risk: Approximately 8-10 INR per share.
Reward: Potential gain of 35-40 INR per share.
Favorable risk-reward ratio around 3:1 or better.
Additional Notes:
If the price falls below the support zone and weekly level with strong volume, consider exiting or avoiding long positions.
Look for confirmation signals before entry to reduce false breakouts or breakdowns.
Summary:
Table
Parameter Details
Entry Price ~708-710 INR (on support)
Stop Loss ~700-705 INR
Target 1 ~720-725 INR
Target 2 ~745-750 INR
Trend Pullback in uptrend
Risk-Reward Ratio ~3:1 or better
Patternrecognition
The Ascending Triangle Pattern: A Bullish Continuation GuideHello Traders!
In today's post, we’ll explore the Ascending Triangle Pattern , one of the most reliable bullish continuation patterns that traders look for during uptrends . It’s an important tool for identifying potential breakout points in trending markets. If you want to learn how to trade these breakouts effectively, mastering the Ascending Triangle is essential.
Chart Pattern: The Ascending Triangle is a strong bullish continuation pattern. In the case of ASIAN PAINTS LTD , we see the price action forming a flat resistance at the top and a rising upward sloping support at the bottom, indicating that the bulls are gradually taking control of the stock.
Key Points to Note:
The stock is respecting the flat resistance , which has been tested multiple times (marked by the red circles).
The upward sloping support is strengthening with each new low, showing growing buying pressure.
The price has recently broken out above the resistance , confirming the breakout pattern.
Trading Strategy:
Entry Point : Once the price breaks the resistance level, consider entering at 1,172.45 .
Stop Loss : Set your stop loss just below the upward sloping support at 1,151.25 to manage risk.
Profit Target : The ideal target after the breakout is approximately 1,261.65 , which is calculated by measuring the height of the triangle and projecting it upward from the breakout point.
Real-World Application:
This is a bullish setup , and traders should keep an eye on volume confirmation post-breakout. A breakout with increased volume would make the setup even stronger. A price move towards the target of 1,261.65 would indicate a successful breakout trade.
Risk Management:
Ensure that you follow your stop loss at 1,151.25 to avoid unnecessary losses in case the breakout fails.
Position size properly to align with your risk tolerance and the potential reward.
What This Means for Traders:
Bullish Setup : The ascending triangle signals that the bulls have control, and we expect the stock to continue higher.
Watch for confirmation of the breakout and enter with confidence, but always be prepared with your stop loss.
Conclusion:
This ascending triangle is a classic pattern, and it offers a great opportunity for long traders . Keep an eye on the breakout, manage your risk, and this trade could potentially yield solid returns.

Mastering the Double Top Pattern: A Guide to Profitable Trades!Hello everyone! I hope you're all doing great in life and in your trading journey. Today, I bring an educational post on Double Top Pattern —a crucial chart pattern that every trader must understand. Whether the market is rising or falling, recognizing key patterns like the Double Top can make all the difference in your trading success. Let’s break down how to spot it, trade it, and the opportunities it provides!
What is the Double Top Pattern?
Double Top is a bearish reversal pattern that typically forms after an uptrend. It consists of two distinct peaks at roughly the same price level, followed by a decline as the price fails to break through resistance. This is your cue that the market could be ready for a downtrend.
Identifying the Double Top Pattern
Peak 1 & Peak 2:
The first and second peaks should be nearly identical in price, signaling that the market is struggling to break through a certain resistance level.
Neckline:
The line connecting the lowest point between the two peaks. This is crucial because once the price breaks this level, the Double Top pattern is confirmed.
Volume Analysis:
Watch for decreasing volume during the formation of the second top and an increase in volume when the price breaks the neckline. This volume confirmation is key to spotting a reliable breakout.
How to Trade the Double Top?
Entry Point:
Once the price breaks below the neckline (support), this signals the start of the downtrend, making it the ideal point to enter a short position.
Stop Loss:
Protect yourself by placing a stop loss just above the second peak. This will shield you from potential false breakouts and unexpected reversals.
Target 1 (First Target):
Measure the distance between the peaks and the neckline. The same distance can be projected downward from the breakout point to estimate the first price target.
Target 2 (Second Target):
A secondary target can be calculated by extending the projection of the first target or using additional tools like Fibonacci retracements to set more precise exit points.
Key Takeaways for Success:
Volume Matters: A valid Double Top pattern is confirmed when the price breaks the neckline with strong volume.
Don’t Ignore Confirmation: Use indicators like RSI or MACD to back up the pattern. A confirmed downtrend ensures higher chances of success.
Trend Context is Crucial: Double Tops are most effective after a strong uptrend. The market's general trend should support a bearish reversal for the pattern to be reliable.
Example: A Double Top in Action
In the chart above, we can see a textbook example of the Double Top pattern. The price hits resistance twice and then breaks the neckline, signaling a potential bearish move. Keep an eye on the volume spikes and adjust your entry/exit strategy accordingly.
Ready to Trade the Double Top?
Make sure to look for the right conditions, and practice your strategy with a demo account before trading live. The Double Top can be a highly profitable setup when traded with patience and discipline!
If you found this post helpful, don’t forget to hit the like button!
Feel free to drop a comment with your thoughts or experiences regarding the Double Top pattern. Have you traded it before? How did it work for you? Let’s discuss and share insights!

HOW TO USE DESCENDING TRIANGLE AS A SETUP?This is Berger Paint stock. In this stock Descending triangle is forming.
* What is the Descending triangle pattern?
- A descending triangle is a chart pattern used in technical analysis created by drawing one
trend line connecting a series of lower highs and a second horizontal trend line connecting a
series of lows.
A regular descending triangle pattern is commonly considered a bearish chart pattern or a
continuation pattern with an established downtrend. However, a descending triangle pattern
can also be bullish, with a breakout in the opposite direction, and is known as a reversal
pattern.
So here it is in Bandhan Bank support is at 190. and stock is in the accumulation phase from the long term. From above we will connect lower high and down we make a support zone. Now stock is in stock and ready to fly.
* How will we know that stock is ready to move using descending triangle?
- Lower High
- Time at support zone
- Bullish Candle at support
All this step is to be followed. Then it is the best setup.
-

Bank Nifty created pattern will it work or not?
As chart shows a flag pattern has been formed in 30 min time frame and also bank nifty traded tightly today. which conclude that this range can burst out either bullish or bearish.
Another thing to notice a bullish wick reversal candle has formed which gives a hint for bullish side strength into bank nifty
May be a gap opening for tomorrow also expecting a trend day or more tight range day. Trade on retest only avoid flase breakouts
Resistance : 45600, 45800-900
Support : 45400, 45139
Note : Do your own analysis before making any trading decisions.

#TATASTEEL #TISCO Tata steel, forming box and breakout pattern, similar breakout now looking for uptred.
