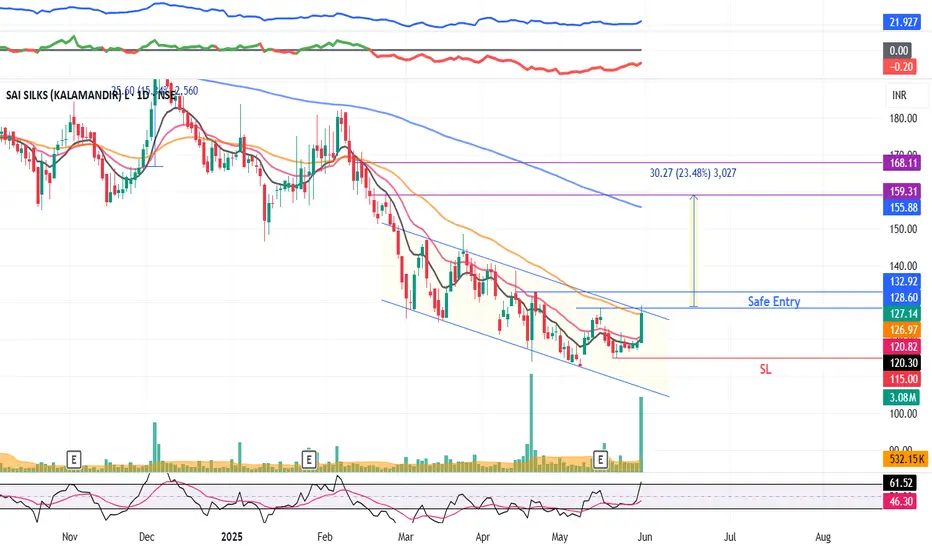
KALAMANDIR : Falling Channel pattern#KALAMANDIR #chartpatterntrading #fallingchannelpattern #channelbreakout #breakoutstock
KALAMANDIR : Swing Trade
>> Breakout stock
>> Falling Channel pattern breakout
>> Good Strength & Volume Buildup
>> Stock in Momentum
Swing Traders can lock profits @10% & keep trailing
Disc : Stock Charts shared are for Learning purpose, not a Trade recommendation
Consult a SEBI Registered Advisor before taking position in it.
Patterntrading
HEROMOTOCO | Weekly Breakout Analysis📉 Yellow Line — Weekly Counter-Trendline (WTF CT) resistance finally broken with conviction. This line guided the entire downtrend and its breach signals a strong structural shift.
📈 Red Parallel Channel — A hidden resistance channel formed during the recent consolidation phase. Price climbed within this tight range and has now broken out, confirming internal strength and directional intent.
🟧 Orange Horizontal Line — Major Monthly Time Frame (MTF) resistance, which now acts as the next crucial target. The breakout candle has enough space to breathe before testing this overhead level.
⚪ White Dotted Line — Daily Time Frame (DTF) counter-trendline that had already been broken earlier, providing early signs of reversal. Serves as a great precursor to the higher timeframe breakout.
📊 Volume: Weekly breakout accompanied by ~5.57M volume — exceeding the 50K benchmark required for WTF breakout validation. Strong institutional interest is evident.
🟩 Structure: Price has formed a higher low base and broke out cleanly above all marked resistances — a sign of strength across all timeframes.

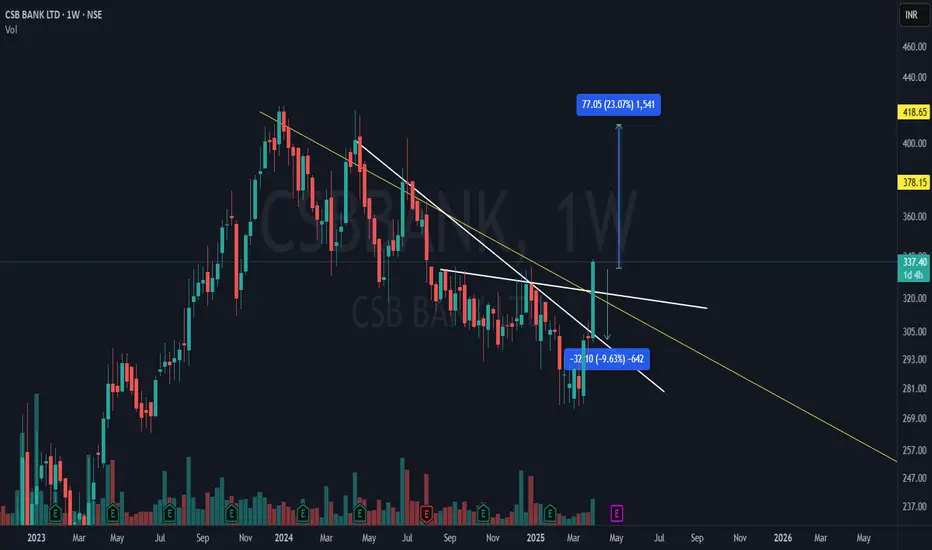
CSB Bank | WTF Breakout – Can Bulls Sustain? 📈 Stock: CSB BANK LTD (NSE)
Key Breakout Signals:
✅ CT Resistance (White Line) – Broken! A solid breakout on the weekly timeframe (WTF).
✅ Hidden Resistance Cleared! The lower white trendline resistance has been taken out.
✅ Monthly Resistance Ahead (Yellow Line)! Price approaching the higher timeframe barrier.
✅ Massive Volume Surge: Buyers stepping in strongly – Friday’s close will confirm!
🔥 A classic CT-based breakout setup with strong volume! Will bulls conquer the monthly resistance? Drop your views below! 👇
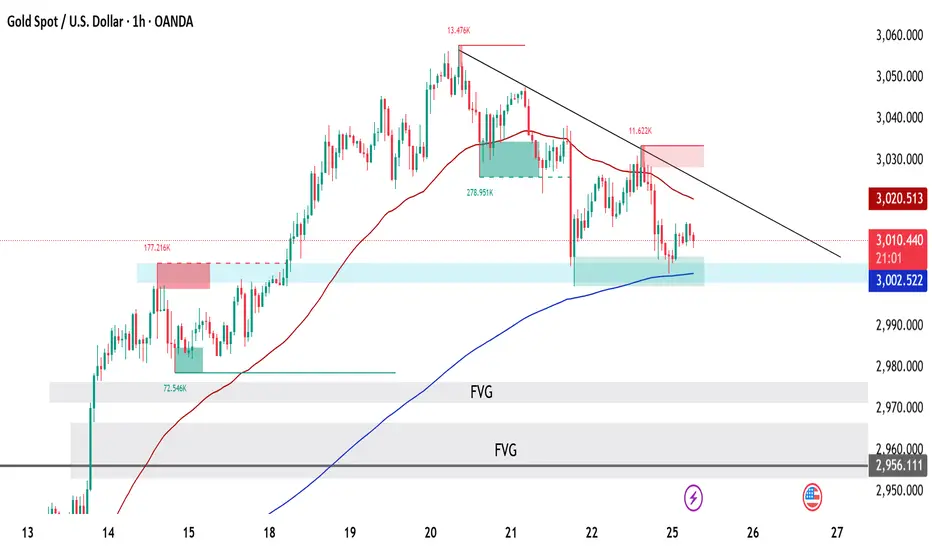
Gold (XAU/USD) Next Possible Move?
🔍 4-Hour Chart Analysis:
Trend: The price was in an uptrend, but a potential reversal has formed.
✅Key Bearish Signal: The presence of an Evening Star candlestick pattern at resistance (~$3,038) signals a potential trend reversal.
✅ Moving Averages:
✅ 50 EMA (Exponential Moving Average): The price is testing this level as support.
✅ 200 EMA : Positioned lower, suggesting that the long-term trend is still bullish, but short-term weakness is visible.
📉 Support Levels:
✅$3,005 (Minor Support)
✅$2,981 (Stronger Support)
📉 Resistance Levels:
✅$3,038 (Key Resistance)
🔹 Summary:
The formation of an Evening Star at resistance suggests a potential downtrend unless the price strongly holds above the 50 EMA. A breakdown of $3,005 could accelerate selling toward $2,981.
🔍 1-Hour Chart Analysis:
📊Key Observations:
Trendline Resistance : A descending trendline is pushing prices lower.
50 EMA Resistance : Price is failing to break above the 50 EMA, confirming selling pressure.
🚨 200 EMA Support : Price is holding above the 200 EMA, acting as a dynamic support.
🚨 Point of Interest (POI) Zone : The blue-shaded area is a key demand zone, where buying pressure might increase.
🚨 Fair Value Gap (FVG) Below: There’s an imbalance below $2,981, which price may fill before rebounding.
🔹 Summary :
If the 200 EMA support at $3,002 fails, a move toward the FVG zone near $2,981 is likely. A break above the trendline resistance and 50 EMA would signal a possible bullish reversal.
🔍 15-Minute Chart Analysis:
📊Key Observations:
📉 Bearish Crossover: The 50 EMA crossed below the 200 EMA, a bearish sign indicating selling pressure.
📉 Lower Highs Formation : Price is making lower highs, respecting the trendline resistance.
📉 Support Zone Holding : The blue POI level is still acting as a temporary support.
🔹 Summary:
The short-term momentum is bearish, as indicated by the EMA crossover and trendline rejection. However, if buyers step in at the POI level, a short-term bounce may occur. If support at $2,999-$3,002 breaks, expect further downside.
📌 Trading Plan & Key Levels to Watch
🟢 Bullish Scenario:
A break above the trendline and 50 EMA (~$3,020) could lead to a push toward $3,038.
A strong bounce from $2,981 (support level) could provide buying opportunities.
📍 Bearish Scenario:
A break below $3,002 (200 EMA support) may trigger a move toward $2,981.
If $2,981 breaks, the price could target the FVG area ($2,955 - $2,930).
📉 Conclusion
Short-Term Trend: Bearish unless the price reclaims $3,020+.
Key Support: $3,002, $2,981
Key Resistance: $3,020, $3,038
Strategy: Watch for a breakout above trendline for bullish confirmation or a break below $3,002 for bearish continuation.
👉 Always follow TP/SL to protect your capital and maximize profits!
Stay tuned for updates once the confirmations are in place!
Please support me with your likes and comments to motivate me to share more analysis with you and share your opinion about the possible trend of this chart with me !
📢 Best Regards , Silver Wolf Traders Community
Disclaimer: This is for educational purposes only.
Always trade responsibly and manage your risk effectively
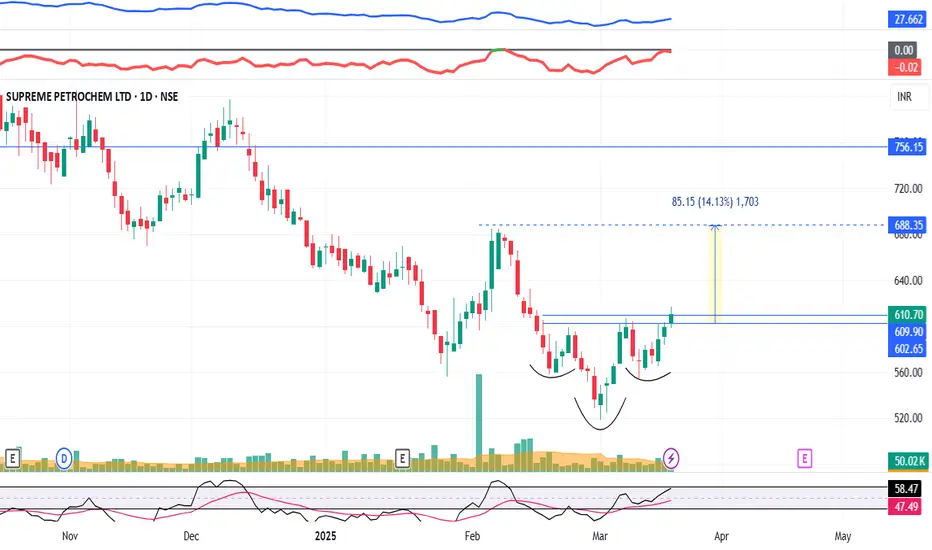
SPLPETRO : #SPLPETRO #swingtrade #patterntrading
SPLPETRO : Swing Trading
>> Inverse H&S pattern visible
>> Good Strength in Stock
>> Volume Building up
>> Risk Reward Favourable
Swing Traders can lock profit at 10% and keep Trailing
Please Boost, comment and follow us for more Learnings.
Note : Markets are still Tricky and can go either ways so don't be over aggressive while choosing & planning your Trades, Calculate your Position sizing as per the Risk Reward you see and most importantly don't go all in
Disc : Charts shared are for learning purpose only, not a Trade recommendation. Do your own research and consult your financial advisor before taking any position.
How to Trade Parallel Channels Like a Pro | Intra & Swing TradesLearn how to trade parallel channels effectively in this detailed breakdown. I cover two types of parallel channels:
Up trending Parallel Channel – Enter at higher lows for a long position.
Downtrending Parallel Channel – Short at lower highs for intraday trades or wait for a breakout at resistance for swing/positional trades.
Master risk-reward strategies and improve your trade setups today!

JUBLFOOD : Breakout Stock (1-3 Months)#JUBLFOOD #swingtrade #breakout #patterntrading #chartpattern #Trendsetup
JUBLFOOD : (1-3 Months)
>> Cup & Handle Breakout on Daily
>> Stock in Uptrend on Monthly chart
>> Trending setup & Strong on Higher Time Frame
>> High PE Stock but expecting couple of Good Quarters ahead so with Good Income PE may reuduce considerably
>> Expecting atleast 20-25% upmove
Swing Traders can lock Profit at 10% & Keep trailing
Pls Boost, comment and follow for more Learnings
Note : I have taken Position in it Today for initial 1-3 months tym Frame Expecting 20-25% Returns
Disc : Charts shared for Learning purpose and not a Trade recommendation. Consult your Financial advisor and do your own analysis before taking position in it.

Hardwyn India - Possible PathStock at a very crucial area
Trend line support at 28.5 - 29
Also forming a wedge pattern
Breakout / Breakdown Possible
Upside stops 32 / 42.5 / 47
Downside 26 and more

Uniswap : Falling Wedge Pattern formed, Achieving +126% ROIThe Uniswap falling Wedge Pattern has formed, and a Breakout is Expected. If the Breakout occurs above the pattern, the market could approach Target 1 and Target 2, offering a chance to achieve a +126% ROI.

BabyDoge : Triangle Pattern forming and Target BabyDoge is forming a Triangle Pattern. The first Target is the Top of the Triangle, and a Breakout of the pattern is expected.

HFCL : Breakout Soon#HFCL #VCPpattern #Breakout #Trendingstock #patterntrading #swingtrading
HFCL : Swing Pick
>> Beautiful VCP pattern visible
>> Breakout candidate
>> Good strength & volumes
>> Low Risk High Reward Trade
Swing Traders can Lock profits at 10% and keep trailing
If u Like the Analysis, Pls give us a Boost and Comment about what u think of this Setup.
Disc : Trade Ideas Shared are for Educational Purpose, not a Trade Recommendation. Pls do ur own analysis and consult your Financial Advisors before thaking position in any stock.

Idea purely on technical basis + NewsThis idea is purely basis current price action + volume and news. No other factors considered.
NSE:DHANI has shown promising signs of a potential turnaround, indicating a shift in sentiment following a period of indecision or stabilization.
The Diamond Bottom pattern emerges amidst a downtrend, characterized by the formation of higher highs and lower lows within a widening pattern.
Over time, this pattern evolves as the highs reach a peak and the lows begin to ascend, leading to a gradual narrowing of the trading range.
Upon the breakout above the boundaries of the diamond pattern, there's a notable indication of a substantial reversal, marking the onset of a fresh uptrend.
Other things to consider at current situation
- Volume is increasing
- Trading above 10 EMA, 50 EMA and 100 EMA
News
Dated: March 18, 2024
- Submitted the building plans to the Directorate of Town and Country Planning (DTCP) for approvals of 60 lac sq ft of residential development saleable area in Sector 104, Gurugram located on 8 lane Dwarka Express way. The Project is proposed to be launched in July’
- Submitted the building plans for development of saleable area of 2.6 lac sq ft of office space in Worli, Mumbai. The Project is expected to be launched in August’ 2024.
PLEASE NOTE THAT:
This chart analysis is only for reference purpose.
This is not buying or selling recommendations.
I am not SEBI registered.
Please consult your financial advisor before taking any trade

Polygon long-term analysis, Total potential profit +416% ROIPolygon is currently supported and trading within a channel pattern. The first target is the top of this channel, offering a potential profit of +79% ROI. A breakout above the channel could lead to a second target of $1.56 USD, with a potential profit of +179% ROI. If the market closes above this second target, a significant price movement in Polygon is expected. The third target of this analysis is $2.8900 USD, offering a total potential profit of +416% ROI. This is a long-term analysis, and it's essential to follow trend continuation techniques. This presents a significant opportunity, good luck!

Morgan Stanley: Triangle Pattern Target is 132 USD, Gain +23%At Morgan Stanley, a triangle pattern has formed, and there was a breakout above the pattern. There’s still a chance to gain a +23% profit, with a target of 132 USD.

Merck & Company: Channel Breakout & Target is 0.6 Fib, +13% ROIIn Merck & Company, a Rising Channel Pattern has formed, and the Trendline has Breakout below. The Target is the 0.5 or 0.6 Fibonacci Retracement levels, with the Potential to Achieve a +13% Profit.

Ethereum Next Target 3055 USD, Triangle Pattern BreakoutEthereum has formed a Triangle Pattern and breakout above it. It is also expected to Breakout of the Falling Channel, with the Next Target being the 0.5 Fibonacci Retracement level at 3,055 USD.
Support me, I want to help People "Make Profit" all over the "World". Thankyou.

Gulf Energy Development : Next Target is 69 THB, Fibonacci levelIn Gulf Energy Development, Falling Wedge Pattern Breakout and Reached the Target with +34% Profit. Now market Breakout above the Resistance level, so Next Target is 1.6 Fibonacci levels 69 THB.
I want to help people to Make Profit all over the "World".

Upside Breakout in Privi Speciality Chemicals LtdPrivi Speciality Chemicals Ltd NSE:PRIVISCL
The price has broken upward out of a trading range, suggesting the beginning of a new uptrend.
The Upside Breakout pattern features a trading range where prices move sideways between two parallel horizontal lines. This pattern typically indicates a pause or congestion area within an existing trend, though occasionally it results in a reversal of the previous trend.
Regardless, an upside breakout through the upper resistance line signals the end of the consolidation period and the onset of an uptrend.
PLEASE NOTE THAT:
This chart analysis is only for reference purpose.
This is not buying or selling recommendations.
I am not SEBI registered.
Please consult your financial advisor before taking any trade

EURNZD SHOWING HEAD AND SHOULDER PATTERN WITH 1:5 RISK REWARD EURNZD SHOWING A GOOD DOWN MOVE WITH 1:5 RISK REWARD
DUE TO THESE REASON
A. its following a rectangle pattern that stocked the market
which preventing the market to move any one direction now it trying to break the strong resistant lable
B. after the break of this rectangle it will boost the market potential for break
C. also its resisting from a strong neckline the neckline also got weeker ald the price is ready to break in the outer region
all of these reason are indicating the same thing its ready for breakout BREAKOUT trading are follws good risk reward
please dont use more than one percentage of your capitalfollow risk reward and tradeing rules
that will help you to to become a bettertrader
thank you

Bangkok Bank, Next Target is the Channel TOP, Gain +78% PROFITBangkok Bank has been Trading within a Channel Pattern for the past 24 years. A Rising Wedge Pattern formed within the Channel, and last year, it Breakout of the Wedge Pattern and Reached its Target. The market is now continuing its Uptrend, with the NEXT TARGET being the Top of the Channel Pattern, around 280 THB, although this may vary depending on the timing.
Take advantage of this Great Opportunity to Earn a Potential Profit of +78% ROI. As this is a Long-Term Analysis, it's important to follow Trend continuation techniques.
I want to help People to Make Profit all over the "World".

1 Breakout and 1 Support trade idea for 14 October Markets I make educational content videos for swing / positional trading

Triangle Pattern Breakout after 25 years, Gain +112% PROFIT A Triangle Pattern has formed in Krung Thai Bank Public, and a Breakout is Expected after 25 years. This suggests a very Bullish Uptrend in the market. Take advantage of this Great Opportunity to Earn a Potential Profit of +112% ROI. As this is a Long-Term Analysis, it's important to follow Trend continuation techniques.

Dow Jones Analysis, waiting for Confirmation of the TrendThe Dow Jones is trading within a Channel Pattern. Waiting for Confirmation of the Trend, whether it breakout above the channel or retraces to the bottom of the Channel.
