Ashok Leyland : Swing Trade#ashokley #patterntrading #Breakoutstock #inverseheadandshoulder #swingtrade
Ashok Leyland : Swing Trade
>> Breakout Candidate
>> Inverse H&S Pattern Visible
>> Good Strength & Volumes Picking up
>> Low Risk High Reward Trade
Swing Traders can lock 10% profit & keep trailing
Please Like or comment if u r Liking the analysis & Learning from it. Keep showing ur Love
Disclaimer : This is not a Trade Recommendations & Charts/ stocks Mentioned are for Learning/Educational Purpose. Do your Own Analysis before Taking positions.
Patterntrading

Amara Raja Energy & Mobility (ARE_M) : Swing Trade#ARE_M #patterntrading #breakouttrading #momentumstock #swingtrade
Amara Raja Energy & Mobility : Swing Trade
>> Inverse H&S pattern Visible
>> Good Strength & Volumes picking up
>> Momentum stock : U may see sudden spurts of Volume
>>Risky Trade, Book Profits timely
Swing Traders can lock 10% profit & keep trailing
Please Like or comment if u r Liking the analysis & Learning from it. Keep showing ur Love
Disclaimer : This is not a Trade Recommendations & Charts/ stocks Mentioned are for Learning/Educational Purpose. Do your Own Analysis before Taking positions.

TORNTPOWERNSE:TORNTPOWER stock formed like a symmetrical triangle pattern. buy entry is break and sustain above the 675 level.
Target 1 740 to 745 .
Target 2 785 to 790 .
Target 3 845 to 850 .
stop loss break and close below the pattern.

CL Educate : Short term (1-3 Months)#cleducate #patternbreakout #patterntrading
#CLEDUCATE :
>> Beautiful Inverse H&S Pattern breakout
>> Breakout with Volumes
>> Good Strength in Stock
>> Low Risk, High Reward Trade (Upside of 43% Possible)
Swing Traders can lock their profits at 10% and keep trailing
Please Like or comment if u r Liking the analysis & Learning from it. Keep showing ur Love
Disclaimer : This is not a Trade Recommendations & Charts/ stocks Mentioned are for Learning/Educational Purpose. Do your Own Analysis before Taking positions.

JK Lakshmi Cement Ltd forms bullish "Diamond Bottom" patternA bullish chart pattern known as a " Diamond Bottom " has emerged on the DAILY-CHART of JK Lakshmi Cement Ltd ( NSE:JKLAKSHMI ) . This pattern is considered a positive indicator, suggesting that the stock price could potentially increase and reach a range between 748.00 and 765.00.
The pattern took shape over a period of approximately 71 days, and this duration aligns with the standard principles of technical analysis, indicating when the stock might reach the target price range.
The Diamond Bottom pattern typically initiates during a downtrend, as stock prices exhibit higher highs and lower lows, forming a broadening pattern. Subsequently, the trading range begins to narrow after the peak of the highs, and the lows start showing an upward trend. The key moment occurs when the stock price breaks upward beyond the boundaries of the diamond shape. This breakout signifies a significant reversal, indicating a shift toward a new uptrend in the stock's performance.
This optimistic pattern is clearly visible on the provided chart and was identified through Trading Central's specialized pattern recognition technology.
PLEASE NOTE THAT:
This chart analysis is only for reference purpose.
This is not buying or selling recommendations.
I am not SEBI registered.
Please consult your financial advisor before taking any trade

ITC STOCKNSE:ITC Stock buy above 450 rupees.
Target 1 is 465 to 475 rupees,
Target 2 is 480 to 485 rupees,
Target 3 is 490 to 495 rupees,
stoploss below 430 rupees.

Karur Vysya Bank : Inverse H&S Pattern Breakout#KARURVYSYA #patterntrading #breakout #momentumtrading #swingtrading
Karur Vysya Bank : Swing Trade
>> Inverse H&S pattern Breakout
>> W-pattern visible after Pattern Breakout
>> Good Strength & Volume in stock
Swing Traders can lock 10% profit & keep trailing
Please Like or comment if u r Liking the analysis & Learning from it. Keep showing ur Love
Disclaimer : This is not a Trade Recommendations & Charts/ stocks Mentioned are for Learning/Educational Purpose. Do your Own Analysis before Taking positions.

BLACK BOX : Swing Trade#BBOX #swingtrade #patterntrading #chartpatterns
Black Box : Swing Trade
>> Inverse H&S Pattern Breakout (Strong one)
>> Good Volume Breakout
>> Good Strength in stock
Swing Traders can lock 10% profit & keep trailing
Please Like or comment if u r Liking the analysis & Learning from it. Keep showing ur Love
Disclaimer : This is not a Trade Recommendations & Charts/ stocks Mentioned are for Learning/Educational Purpose. Do your Own Analysis before Taking positions.

nifty 50 head and shoulder patternnifty 50 head and shoulder pattern as form there it will retest than entry

DCB Bank : Inverse Head & Shoulder Pattern#dcbbank #swingtrade #momentumtradeing #swingtrading #patterntrading
DCB Bank : Breakout soon
>> Inverse H&S pattern visible
>> Good Volume & Strength in stock
>> Good Relative Strength
Swing Traders can lock 10% profit & keep trailling
Please Like or comment if u r Liking the analysis & Learning from it. Keep showing ur Love
Disclaimer : This is not a Trade Recommendations & Charts/ stocks Mentioned are for Learning/Educational Purpose. Do your Own Analysis before Taking positions.

GodrejAgro - Symmetrical Continuation Triangle (Bullish)A Symmetrical Continuation Triangle, also known as a Bullish Symmetrical Triangle, is a technical chart pattern observed in daily chart of Godrej Agrovet Ltd.
This pattern is considered a continuation pattern, indicating that the price is likely to continue in the same direction as the trend that was in place before the formation of the triangle.
In the case of a Bullish Symmetrical Triangle, the prior trend is typically upward (bullish).
Breakout: The breakout from the triangle is the key signal. A Bullish Symmetrical Triangle has a bullish bias, meaning that the price is more likely to break out to the upside, continuing the prior uptrend.
Price Target: You can measure the height of the triangle at its widest point (the base) and then add that measurement to the breakout point. This gives you a potential target for the price move.
Stop Loss: Traders often set stop-loss orders just below the lower trendline to manage risk in case the pattern fails and the price breaks down instead of up.
Confirmation: Confirmation of the pattern's validity comes after the breakout. The breakout should ideally be accompanied by a surge in trading volume, providing more confidence in the bullish move.
PLEASE NOTE THAT:
This chart analysis is only for reference purpose.
This is not buying or selling recommendations.
I am not SEBI registered.
Please consult your financial advisor before taking any trade.

Forming Head and Shoulder PatternNSE:MINDTECK - Daily Chart analysis.
It seems the stock will form bottom head and shoulder pattern.
The chart is self explanatory with Intermediate-Term Bullish.
PLEASE NOTE THAT:
This chart analysis is only for reference purpose.
This is not buying or selling recommendations.
I am not SEBI registered.
Please consult your financial advisor before taking any trade.

SWELECTES : Swing Trade / Short term (1-3 months)#SWELECTES #swingtrade #vcppattern #inverseheadandshoulder #breakout #patterntrading
Swelect Energy System : Breakout Candidate
>> Low Risk High Reward Setup
>> Inverse H & S pattern / VCP Pattern
>> Good Strength & Decent Volume
Swing Traders can lock profits at 10% and keep Trailing
>> 2 SL given just in case of a shakeout move
Swing Traders can lock 10% profit & keep trailling
Please Like or comment if u r Liking the analysis & Learning from it. Keep showing ur Love
Disclaimer : This is not a Trade Recommendations & Charts/ stocks Mentioned are for Learning/Educational Purpose. Do your Own Analysis before Taking positions.

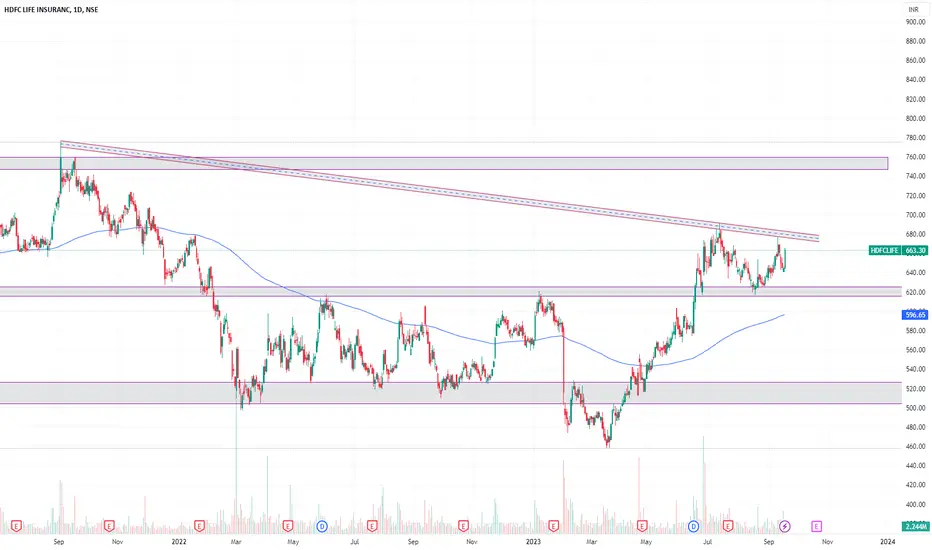
HDFCLife ChartHere, is the chart of HDFCLIFE, Hope the levels will help you a lot to trade or invest...
TRIVENI STOCKNSE:TRIVENI stock formed like a symmetrical triangle pattern. buy entry is 314.50 level.
Target 1 325 to 330 .
Target 2 340 to 345 .
Target 3 360 to 365 .
stop loss break and close below the pattern.

NAZARA - Symmetrical Continuation Triangle (Bullish) pattern Here's a breakdown of the key components and characteristics of the Symmetrical Continuation Triangle (Bullish) pattern :
Converging Trendlines: The pattern is formed by two converging trendlines, one drawn connecting the lower highs and the other connecting the higher lows. This creates a triangle-like shape on the price chart.
Price Consolidation: The pattern typically forms during a period of consolidation, where the price movement becomes range-bound. This consolidation phase signifies a temporary pause or uncertainty in the market after a prior uptrend.
Decreasing Volume: As the pattern develops, trading volume tends to decrease. This reduction in volume reflects the indecision and lack of strong conviction among traders regarding the future direction of the price.
Price Breakout: The key event in this pattern is the price breakout. Before the triangle pattern reaches its apex (the point where the trendlines converge), the price breaks out above the upper trendline. This breakout is characterized by a noticeable increase in trading volume, indicating a surge of buying interest.
Confirmation of Uptrend Continuation: The breakout above the upper trendline is seen as a signal that the prior uptrend is likely to continue. The increase in volume suggests that a significant number of traders are now confident in the upward direction of the price.
Overall, the Symmetrical Continuation Triangle (Bullish) is interpreted as a bullish continuation pattern. It suggests that after a period of consolidation and uncertainty, buyers have regained control, and the price is likely to resume its upward movement.
It's important to note that while chart patterns like this can provide insights into potential price movements, they are not foolproof predictions.
Traders often use these patterns in conjunction with other technical and fundamental analysis tools to make informed trading decisions.
PLEASE NOTE THAT:
This chart analysis is only for reference purpose.
This is not buying or selling recommendations.
I am not SEBI registered.
Please consult your financial advisor before taking any trade.

2 Amazing swing trade ideas for 24 August I daily make educational content videos for swing / positional trading

1 Swing trading idea for 23 August markets I daily make educational content videos for swing / positional trading

Union Bank - Bullish Signal with Inverted Head and Shoulders PatStock Name: Union Bank
View: Bullish
Analysis :
Union Bank's price action suggests a potential bullish scenario based on the following technical factors:
1 - Inverted Head and Shoulders Pattern: On the daily time frame, Union Bank is forming an inverted head and shoulders pattern, which is a classic reversal pattern. This pattern typically indicates a potential upward move after a downtrend or consolidation.
2 - Continuation Pattern: The inverted head and shoulders pattern is occurring within the context of a primary uptrend, indicating that this pattern might act as a continuation pattern, further supporting the bullish view.
3 - Weekly Consolidation: The stock is currently consolidating on the weekly time frame after a previous upward movement. This consolidation phase could be a sign of temporary price stability before another potential leg up.
4 - Market Context: CNXPSUBANK is undergoing a multi-year consolidation, which, when broken, could have a positive impact on Union Bank's performance, potentially fueling a significant rally.
Trade Plan:
Based on the analysis, here is a potential trade plan:
Entry : Consider entering a long position if Union Bank's price breaks above the horizontal resistance level ranging from 92.3 to 93.
Stop Loss (SL) : Place a stop loss order just below the recent swing low at 89. This offers a risk management strategy to limit potential losses.
SL Percentage : The stop loss represents a 3.5% decline from the entry point, providing a buffer against potential market volatility.
Position Sizing : For risk management, allocate a position size that corresponds to a 1% risk of your total capital. This could amount to approximately 28% of your total capital.
Max Position Size : However, it's advisable to cap the maximum position size at 25% of your total capital. This adjustment not only aligns with prudent risk management practices but also helps reduce the overall risk exposure.
Disclaimer :
Trading and investing in the stock market carry inherent risks. This analysis is for informational purposes only and should not be considered financial advice. Prior to making any trading or investment decisions, it is recommended to conduct thorough research and consult with a certified financial advisor.
Please note that the stock market's unpredictability and past performance not indicating future results emphasize its inherent uncertainty. Trading entails substantial risk, including potential capital loss. This analysis focuses exclusively on technical factors and does not account for fundamental or external market influences. Prior to making any trading decisions, conducting thorough research and seeking advice from qualified financial professionals is advised.
Remember, your decisions solely bear consequences, and you are fully accountable for your trading outcomes. Approach decisions with caution and thorough consideration.
This analysis and disclaimer are furnished solely for educational and informational purposes. It must not be construed as financial advice. Trading encompasses risks, and it is imperative to comprehensively comprehend these risks before making any trading determinations.
#StockAnalysis #TechnicalAnalysis #TradingIdeas #BullishSignal #InvertedHeadAndShoulders #MarketAnalysis #FinancialMarkets #TradingOpportunity #InvestmentStrategy #RiskManagement #TradingViewAnalysis

2 Amazing Swing trading ideas for 11 August marketsI daily make educational content videos for swing / positional trading

GHCL - Continuation Diamond (Bullish)Based on the price movement, there was a period of consolidation where the price was trading within a range. However, the recent price action indicates a significant break above this consolidation phase, which suggests a continuation of the previous upward trend.
Initially, the pattern started during a downtrend as prices formed higher highs and lower lows within a broadening pattern. Subsequently, the trading range gradually narrowed after reaching the peak highs and the lows began to trend upward. The recent breakout above the upper boundary of this narrowing diamond pattern indicates the resumption of the previous uptrend.
Note for everyone who came across this reference:
This chart analysis is only for reference purpose.
This is not buying or selling recommendations.
I am not SEBI registered.
Please consult your financial advisor before taking any trade.

Samvardhana Motherson InternationalHello & welcome to this analysis
A rank outperformer from its listing back in 1999, stock has a history of doing deeper retracements and then following it with much stronger rallies.
Currently in the monthly time frame its forming a cup & handle pattern that suggests accumulation for yet another strong upside.
However, in the short term it could see a dip if current support levels are broken.
Overall a strong stock in lower time frame consolidation/correction.
Happy Investing

2 Amazing swing trade ideas for 3 August I daily make educational content videos for swing / positional
