PAYTM (One 97 Communications Ltd.) – Technical Outlook & LevelsPAYTM is currently trading near ₹1,344 and remains in a strong upward Elliott Wave structure.
A clean breakout above ₹1,380–1,400 may trigger Wave-3 momentum toward ₹1,850–₹2,000.
Supports at ₹1,300 and ₹1,225 remain crucial for trend continuation, while ₹1,250 acts as an ideal stop-loss for swing setups. Long-term Wave-5 projections suggest a potential move toward ₹2,150–₹2,250.
🎯 Future Target Levels
🔹 Swing Trading Targets
• Target 1: ₹1,420 – ₹1,450
• Target 2: ₹1,550 – ₹1,600
🔹 Position Trading Targets
• Wave 3 Target Zone:
👉 ₹1,850 – ₹2,000 (Fib 1.618–2.0 extension)
• Wave 5 Extended Target:
👉 ₹2,150 – ₹2,250 (Post Wave-4 completion)
🛑 Key Support Levels
• Major Support: ₹1,300
• Intermediate Support: ₹1,225
• Structural Support: ₹1,100 (previous swing-low zone)
📌 Resistance Levels
• Immediate Resistance: ₹1,380
• Next Resistance: ₹1,450
• Major Resistance Zone: ₹1,550 – ₹1,600 (Breakout above this zone can accelerate the Wave-3 rally)
🔐 Stop-Loss Recommendations
Swing Trades
• SL: ₹1,250 (below trendline & previous corrective low)
Positional Trades
• SL: ₹1,180 (below Wave-2 base level)
📌 Thanks a ton for checking out my idea! Hope it sparked some value for you.
🙏 Follow for more insights
👍 Boost if you found it helpful
✍️ Drop a comment with your thoughts below!
Paytm

PAYTM KARO ONE97 COMMUNICATIONS NSE:PAYTM
Paytm karo varna stock ko niche karo 😅😅
Paytm take strong resistance from his major resistance and also do classical pattern consolidation after breaking down that is double confirmation for trend direction.
now, 1000 is major support
this is not a any types of advice.
this is just chart analysis
do your own research

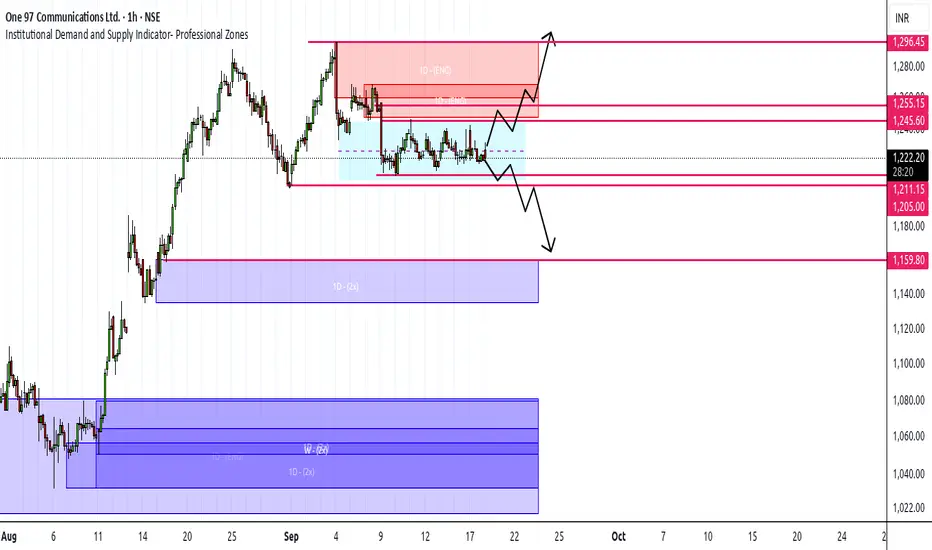
PAYTM - Demand–Supply Rebalance💹 Paytm (NSE: PAYTM)
Sector: Financial Services – Fintech | CMP: 1336
View: Demand–Supply Rebalance | Participation Signals Turning Active
Paytm opened the session at 1287.50 and showed steady buying interest right from the start, moving higher to register a high of 1345 while holding a low of 1285, before closing strong at 1336 near the upper end of the day’s range. The session ended with a clear bullish candle, reflecting positive price behaviour and visible buyer participation throughout the day. The rise in price was supported by an increase in volume, which confirms that the move was backed by active participation rather than thin trading. RSI moved above the breakout level to 56.45, staying in a balanced zone, which suggests the stock is transitioning from consolidation rather than entering an overheated phase.
MACD readings remain slightly negative, indicating that sellers have not fully exited yet, and this keeps momentum mixed in the short term. However, the stochastic indicator at 64.41 points to healthy strength, showing that the broader trend remains intact despite minor hesitation. CCI at 41.6 stays in positive territory, lending support to the ongoing upward bias. ADX continues to signal a weak or range-bound environment, highlighting that the trend is still developing and not fully established.
Volume for the session stood at 73.13 lakh compared to an average of 56.61 lakh, placing it within a normal range but clearly strong enough to indicate genuine market interest. The BB Squeeze has released, hinting at a possible expansion phase ahead, while EMA compression further strengthens the case for a directional move. Relative performance remains in line with the broader market, showing neutral strength rather than outperformance. The combination of rising price and rising volume confirms constructive intent, though confirmation is still awaited. Overall, the setup reflects a neutral yet constructive structure with balanced indicators, moderate momentum, a developing trend, moderate risk, and high volume from an educational perspective.
Paytm is currently holding above the primary demand zone at 1297–1256, which continues to act as the base for the current structure. A secondary support layer is visible around 1262, followed by a deeper structural support near 1239, both of which have previously attracted buying interest. On the upside, immediate supply is placed near 1359, with higher resistance zones aligned around 1382 and 1419, where selling pressure has emerged earlier. These overhead zones represent key decision areas for price. Overall, the stock remains well-supported below while facing defined supply above, keeping the structure balanced and range-aware.
From a derivatives standpoint, Paytm is reflecting a constructive but controlled bullish bias, where participation appears organised and intentional rather than aggressive or speculative. The options chain shows clear activity clustered around near-ATM call strikes, especially in the 1300–1360 zone, with the 1340 strike acting as a central pivot. This indicates that traders are positioning close to spot to express directional views efficiently, instead of chasing deep out-of-the-money calls. The delta profile across these strikes remains balanced, confirming that option prices are responding meaningfully to spot movement and that expectations lean toward continuation rather than a flat, non-directional phase.
A dominant feature visible in the options chain is widespread short covering across near-ATM and slightly ITM calls. Multiple call strikes show declining open interest alongside sharp expansion in traded volumes, which suggests that earlier call sellers are being forced to exit as price moves higher. This short covering has clearly contributed to the recent upside move. However, structurally, this also sets an important condition going forward: while short covering can drive an initial rally, sustained upside requires fresh long positions to step in once covering activity tapers off. Without that transition, price may enter a pause or consolidation phase.
At the same time, there are early signs of fresh bullish positioning at higher strikes, most notably around the 1380 call, where price, volume, and open interest are rising together. This long build-up suggests that some participants are beginning to position for continuation beyond the immediate ATM zone, adding credibility to the bullish structure. While this build-up is still selective rather than broad-based, it helps balance the structure and reduces the risk of the move being purely short-cover driven.
Volatility conditions remain favourable and disciplined. Implied volatility across active call strikes sits in a low-to-moderate range and has generally cooled, even as prices have risen. This indicates that premiums are not inflated and that the move is not being driven by panic or urgency. Such an IV environment typically supports directional debit strategies or controlled bull spreads, while also reminding traders that time decay will become relevant if price momentum slows. Volatility structures like straddles and strangles suggest that the market is pricing a reasonable move, but not an explosive expansion, keeping volatility trades in a conditional, watchful zone.
On the put side, the structure is notably supportive. Put short build-up is visible at lower strikes such as 1300 and 1280, where open interest has increased while premiums have fallen. This behaviour reflects confidence that price will remain above these levels, effectively building a support base below the current spot price. Further down the chain, long unwinding in deeper put strikes reinforces the idea that downside hedging demand is reducing rather than increasing. Implied volatility on puts is elevated but orderly, showing confidence rather than fear.
In simple terms, the derivatives market is working in alignment with the price trend, not fighting it. Call sellers are retreating, selective bullish bets are emerging at higher strikes, and put writers are building support below. The tone is optimistic but not euphoric, structured rather than emotional. This measured options behaviour fits well with the broader technical picture and keeps the bullish bias intact, while still leaving room for consolidation if fresh participation slows.
Paytm is currently trading within a clearly defined demand–supply framework across timeframes. On the daily chart, demand is placed in the 1297.90–1256 zone, which acts as the primary accumulation area, while overhead supply is located in the 1360.50–1381.80 zone, marking a key resistance pocket where selling pressure may emerge. On a swing basis, demand is layered between 1297.90–1279.30 and further extended down to 1280–1256, indicating multiple zones where buyers have previously stepped in with conviction. Swing supply is aligned near 1361–1378.30, closely overlapping with the daily supply band, strengthening its importance as a supply cluster.
On lower time frames, demand zones are visible around 1326–1322.40 and 1308–1305.40, highlighting short-term pullback areas where price may attempt to stabilise before resuming direction. The corresponding lower-time-frame supply is positioned at 1367.75–1363.60, reinforcing the overhead resistance structure. Additionally, aggressive demand pockets are stacked lower at 1302.90–1301, 1277–1275.10, and 1265.70–1261.30, suggesting zones where sharp reactions can occur during deeper retracements. On the upside, an aggressive supply area at 1357.90–1354 signals a near-term reaction zone before price approaches the broader supply band. Overall, the structure shows layered demand below and tightly clustered supply above, defining a well-organised trading range with clear reaction levels across timeframes.
⚠️ STWP Educational & Legal Disclaimer
This content is shared strictly for educational and informational purposes only. All discussions, illustrations, charts, price zones, and options structures are meant to explain market behaviour and do not constitute any buy, sell, or hold recommendation. STWP does not provide investment advice, trading calls, tips, or personalised financial guidance, and is not a SEBI-registered intermediary or research analyst.
The analysis is based on publicly available market data and observed price–derivatives behaviour, which is dynamic in nature and may change without notice. Financial markets involve inherent risk, and derivatives carry elevated risk, including the potential for significant capital loss. Factors such as option premiums, implied volatility, open interest, delta, and other Greeks can shift rapidly and unpredictably.
All trading and investment decisions, including position sizing and risk management, are solely the responsibility of the reader. Always consult a SEBI-registered investment advisor before taking any financial action. STWP, its associates, or affiliates shall not be liable for any direct or indirect loss arising from the use of this material. Past patterns, structures, or historical behaviour must never be treated as guarantees of future outcomes.
Position Status: No active position in this instrument at the time of analysis
Data Source: TradingView & NSE India
💬 Did this add value?
🔼 Boost to support structured learning
✍️ Share your views or questions in the comments
🔁 Forward to traders who value disciplined analysis
👉 Follow for clean, probability-driven STWP insights
🚀 Stay Calm. Stay Clean. Trade With Patience.
Trade Smart | Learn Zones | Be Self-Reliant 📊

PAYTM | Neowave AnalysisHi everyone
This is an neowave analysis as you asked about paytm in comment so here it is.
If you have more query or anyone else wants to know my view on particular stock, than simply leave a comment, i will be happy to help.
Thank You

PayTM (M): Strongly Bullish, Pending BreakoutThe stock has completed a major trend reversal from its 2024 all-time lows. It is now challenging a critical, multi-year resistance level. All technical indicators suggest that pressure is building for a significant bullish breakout.
📈 1. The Long-Term Context
- Major Reversal: After hitting its all-time low in May 2024, the stock has reversed its trend and has been in a sustained uptrend for over a year.
- Multi-Year Base: This entire move has built a massive base, leading to the current showdown at a key horizontal resistance line formed in January 2022 .
- Recent Consolidation: For the past three months, the stock has consolidated just below this major resistance. The volume has been "drying up" during this period, which is a classic bullish sign of seller exhaustion.
🚀 2. The Current Setup (The Decisive Move)
- Price Compression: The stock is currently coiling in a tight range, less than 5% below this critical multi-year resistance.
- Building Momentum: The surge in October ( +15.96% on 63.19M in volume ) showed a strong rejection of lower prices and a powerful move back up to test the "lid" of this pattern.
📊 3. Key Technical Indicators
The underlying momentum strongly supports a bullish resolution:
- RSI: The Relative Strength Index is in a clear rising state, showing that buying strength is building.
- EMAs: The short-term Exponential Moving Averages are in a "PCO" (Price Crossover) state, confirming the bullish momentum is intact across timeframes.
🎯 4. Future Scenarios & Key Levels to Watch
The setup provides two very clear scenarios. The immediate action is to watch for the breakout.
🐂 The Bullish Case (Breakout Confirmation)
- Trigger: A decisive, high-volume close above the horizontal resistance line (approx. ₹1,350 - ₹1,370 ).
- Confirmation: This would confirm the multi-year base is complete and the stock is entering a new, long-term bull market.
- Target: The next logical price target would be ₹1,725 .
🐻 The Bearish Case (Breakout Failure)
- Trigger: The stock fails to break the resistance and momentum is not sustained.
- Confirmation: A high-volume rejection from this level, followed by a break below the recent consolidation.
- Target: This failure would likely see the stock fall to retest its immediate support level at ₹1,090 .

PAYTM LONG TERM INVESTING IDEAPAYTM on weekly chart has now stopped falling further and now consolidating on the lower levels.
Current price level is good to enter and we can add further at around 450 level.
Stop loss can be put around 400 or trail using 20/50 EMA.
This is a LONG term and a bit risky bet but if you have faith in paytm's fundamentals these are really good levels ;)

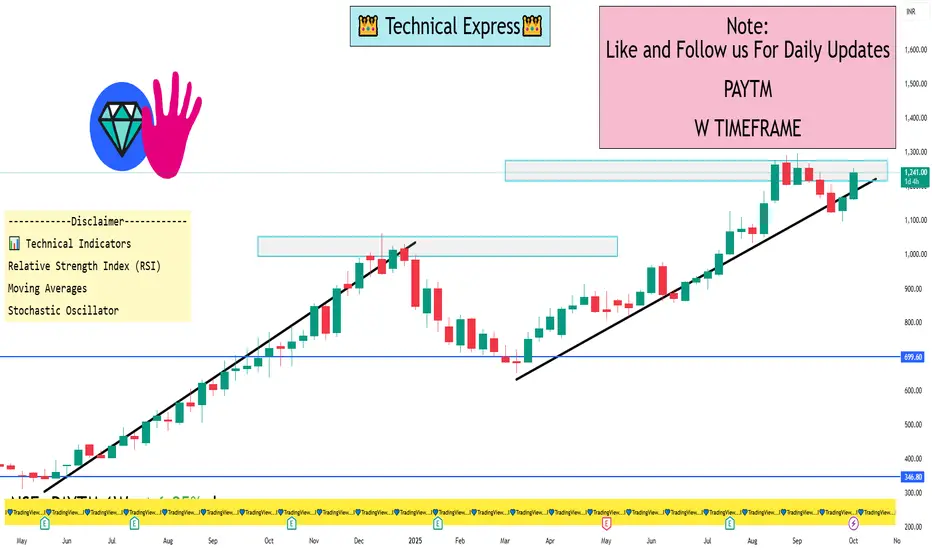
PAYTM 1 Week View 📈 Current Price Snapshot
Latest Price: ₹1,241.50
Day's Range: ₹1,224.30 – ₹1,247.80
52-Week Range: ₹651.50 – ₹1,296.60
🔧 Key Technical Levels (1-Week Timeframe)
Resistance Levels:
₹1,247.80 – Recent intraday high
₹1,288.30 – Near-term resistance zone
Support Levels:
₹1,224.30 – Recent intraday low
₹1,119.00 – Short-term support
📊 Technical Indicators
Relative Strength Index (RSI): 57.67 – Indicates bullish momentum without being overbought.
Moving Averages: Both short-term and long-term moving averages are in a bullish alignment, supporting the positive trend.
Stochastic Oscillator: In the bullish zone, suggesting continued upward momentum.
🧭 Summary
The stock is currently trading near its recent intraday high, indicating strong bullish momentum. With RSI and moving averages supporting the uptrend, PAYTM appears poised to test higher resistance levels in the near term. However, investors should monitor the stock's movement near the resistance level of ₹1,288.30 for potential breakout or reversal signals.
Paytm - Stuck in rangeRight now stock remain sideways
Tight range remains from 1200 - 1250
Upside stock will face higher resistance upto 1300 levels
Downside once 1200 is broken stock may fall upto 1150 / 1100 areas
Paytm-A new ATH is coming soonPaytm has finally closed above its long term resistance of 1000.
Stock has potential to cross 2000 in near future
Keep stock in watchlist
Stock has also formed a kind of inverted head and shoulder pattern.
Not a recommendation. Watch and learn.
PAYTM ANALYSISFOR LEARNING PURPOSE
PAYTM - The current price of PAYTM is 1151.30 rupees
I am going to buy this stock because of the reasons as follows-
1. It's coming out from a good consolidation base
2. It broke a strong resistance zone of last 3 year and now it's trying to go up
3. It is showing better relative strength as it stood strong in volatile times including last week.
4. The risk and reward is favourable. The good part- All the major bad news move has been recovered
5. The stock is acting as more of a leader in last few months. It has outperformed NIFTY as well as it's Sector
6. The stock did very bad after its IPO. Went down like anything. From its ATH, it went down by more than 84% and then it made a base and now it's trying to come out from that.
I am expecting more from this in coming weeks
I will buy it with minimum target of 35-40% and then will trail after that.
My SL is at 988.25 rupees
I will be managing my risk.

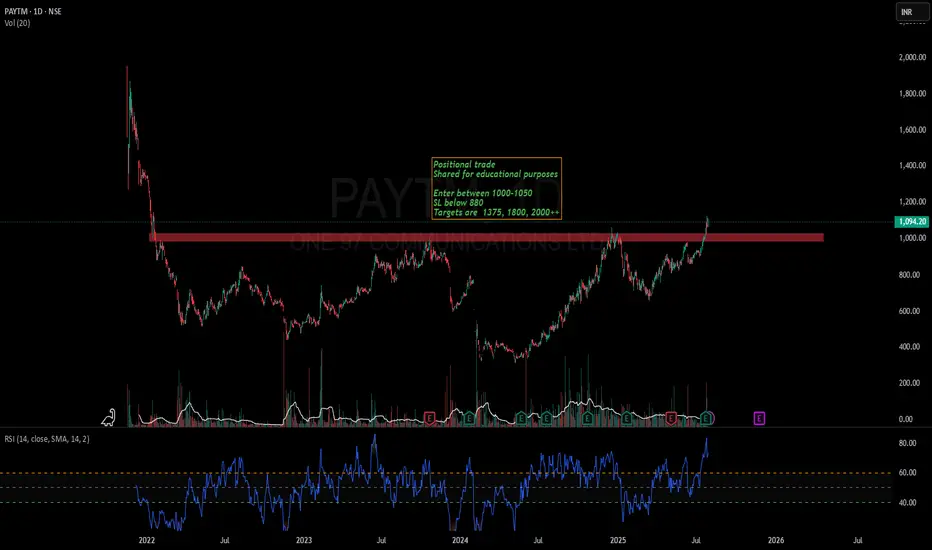
PAYTM – Technical & Fundamental Analysis📊 PAYTM – Technical & Fundamental Educational Snapshot
Ticker: NSE: PAYTM | Sector: 🏦 Digital Payments & Financial Services
CMP: ₹1,122 ▲ (as of 11 Aug 2025)
Rating: ⭐⭐⭐⭐☆ (Moderately Bullish Setup – Educational Purposes Only)
Pattern Observed: 🏆 Cup & Handle (Monthly)
PAYTM has been forming a Cup & Handle pattern on the monthly time frame, indicating the possibility of a bullish continuation. The stock recently closed at ₹1,122 (11 Aug 2025), approaching its immediate resistance zone of ₹1,151 – ₹1,180, with a potential extension toward ₹1,321 if momentum sustains. On the downside, support levels are placed at ₹1,072, ₹1,021, and ₹992. Technical indicators show RSI at 70 (breakout zone), CCI at 103, and Stochastic at 93, signaling strong momentum. While WVAP trend remains bullish and volume surged to 9.41M vs 20-SMA volume of 7.7M, the MACD is still in bearish territory, suggesting caution. Given the 52-week breakout and strong price structure, the setup currently leans bullish for swing trades, provided price holds above key supports.
One97 Communications (Paytm): Shares have gained analyst attention following a 13% rally over the past month. SEBI-registered analyst Mayank Singh Chandel highlighted Paytm’s first-ever operational profit in Q1, marking a major turnaround from losses seen just 18 months prior, bolstered by the complete exit of Chinese investor Antfin in August 2025, which is expected to improve regulatory compliance. Meanwhile, the company continues to narrow its losses—its Q1 consolidated net loss fell to ₹2.9 billion, down from ₹3.6 billion a year earlier, with a 16% year-on-year increase in revenue to ₹29.8 billion. Technically, the stock is navigating a resistance zone between ₹1,000–₹1,150, with a breakout above ₹1,150 possibly signaling further upside.
Investment Outlook & Conclusion: The stock presents a balanced risk-reward scenario. On the bullish side, continued earnings growth, sector tailwinds, and improving technical structure could support upward momentum. However, downside risks include adverse market sentiment, sectoral weakness, or failure to sustain key support levels. In the short term, price action may remain volatile with potential pullbacks, while in the long term, sustained fundamentals and trend confirmation could offer attractive opportunities.
📊 STWP Trade Analysis – The setup reflects bullish continuation characteristics in classical technical analysis. For educational illustration, a possible framework could consider a reference entry near ₹1,130, supported by an illustrative stop loss at ₹1,046 for risk management. Example upside objectives include ₹1,213 (1:1 Risk-Reward) and ₹1,296 (1:2 Risk-Reward), while a potential pullback reference zone is placed between ₹1,090 – ₹1,080 as a possible retest area.
⚠️ Disclaimer (Read Carefully)
This post is for educational and informational purposes only.
The author is not a SEBI-registered investment advisor. No buy or sell recommendations are being made.
All views are based on chart patterns, publicly available data, and personal learning experience.
Trading involves risk. Losses can exceed your investment. Always consult a SEBI-registered advisor before making financial decisions.
By engaging with this content, you agree to these terms.
________________________________________
💬 Was this useful?
Drop your thoughts, questions, or setups in the comments — let’s grow together!
🔁 Share this post with fellow traders and beginners to spread clean, structure-based learning.
✅ Follow simpletradewithpatience for beginner-friendly setups, price action insights, and disciplined trading content.
🚀 Stay Calm. Stay Clean. Trade With Patience.
Trade Smart | Learn Zones | Be Self-Reliant 📊

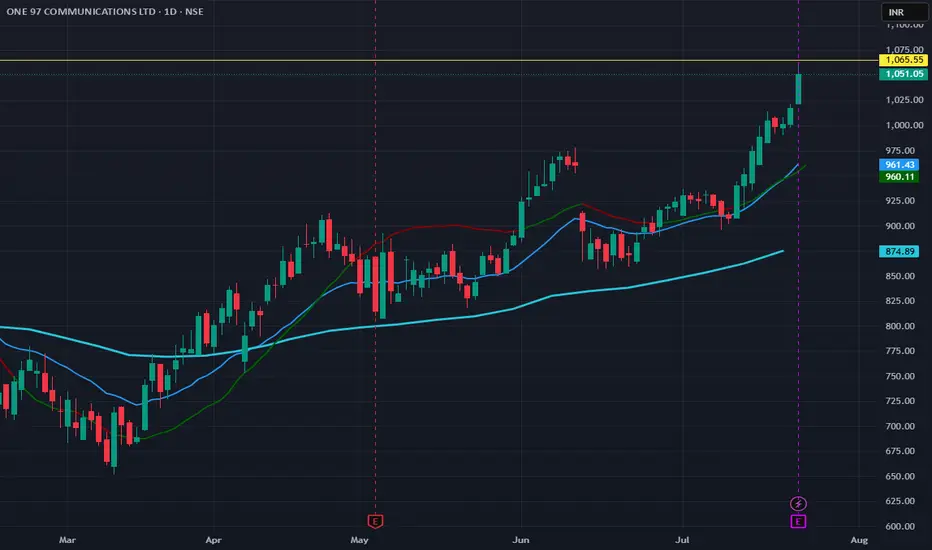
Paytm at ₹1,051: Breakout Confirmed — But What’s Next?Paytm (One 97 Communications) has officially crossed the ₹1,050 resistance zone — a key psychological and technical level. With rising volumes, a powerful uptrend, and its first-ever positive operating cash flow, the question is:
Is this the beginning of a long-term turnaround, or another momentum trade nearing exhaustion?
Let’s break it down.
📊 Shareholding Breakdown (as of June 2025)
Promoters: 0% — no founder holding
FIIs: 54.87% — strong institutional presence
DIIs: 15.83%
Public: 12.22%
🔍 Insight: The company is fully institutionally driven. No promoter skin in the game means short-term thinking could dominate unless core numbers improve consistently.
📉 Financial Performance (FY25 vs FY24)
Metric FY25 FY24 Change
Revenue ₹6,900 Cr ₹9,978 Cr 🔻 -30%
Net Loss ₹664 Cr ₹1,422 Cr ✅ Improved
Operating Profit ₹44 Cr ₹-907 Cr ✅ Positive
Operating Cash Flow ₹651 Cr Negative ✅ First time positive
⚠️ Note: The revenue decline was largely driven by the RBI’s clampdown on Paytm Payments Bank, impacting GMV and merchant payments. Despite this, cost control and business model optimization have narrowed losses.
🌐 Market Landscape
India’s digital payments market is projected to reach $156B by 2025, and $990B by 2032, growing at ~30% CAGR
Paytm remains a leader in merchant QR and Soundbox deployments
Competing with PhonePe, Google Pay, and BharatPe, but continues to differentiate with offline innovation and embedded lending
🔮 Analysts' Outlook:
Bernstein sees 23% upside from current levels
Most houses expect break-even by FY26, profit in FY27
📈 Technical Analysis – Breakout in Motion
Weekly & Monthly Chart Highlights:
✅ Breakout above ₹1,050 confirms strength
✅ Sustained higher highs & higher lows structure
✅ Volume increasing alongside price — a strong technical signal
✅ Stock trading well above 200 EMA
Level Value
CMP ₹1,051.05
Support ₹950–980
Resistance ₹1,120–1,180 (next target zone)
RSI 64 (healthy, not overbought)
📍 If the stock sustains above ₹1,050 with strong volume, it may move swiftly toward ₹1,120+.
📉 If it dips below ₹980 again, a retest of the trendline support may follow — keep trailing your stop losses.
💬 Real Talk: Can You Earn 2–5% Per Month?
Let’s be honest. 2–5% monthly returns aren’t impossible — but they’re not handed out either.
You’ll need:
✅ The right mindset
✅ Strong risk management
✅ Patience, not panic
✅ Real learning, not shortcuts
This is not a get-rich-quick scheme.
This is a get-disciplined-slowly-and-grow-consistently path.
Time invested in learning > Money invested too early.
📝 Final Take
Paytm has broken a critical resistance. The fundamentals are catching up slowly. It's still not a “buy and forget” stock — but it’s now a "watch and ride with caution" setup.
🔁 Traders: Tight trailing stop. Momentum is your friend, not your excuse.
🧠 Investors: Wait for consistent profitability or accumulate slowly with awareness of risks.
Would you chase this breakout — or wait for confirmation above ₹1,120?
📬 Want More?
👉 Follow me here for honest, data-driven stock breakdowns
📩 Subscribe to my free newsletter — every week I share research, setups, and mindset hacks for traders & investors alike.
Disclaimer: This article is for educational purposes only. Please consult a SEBI-registered financial advisor before making investment decisions.
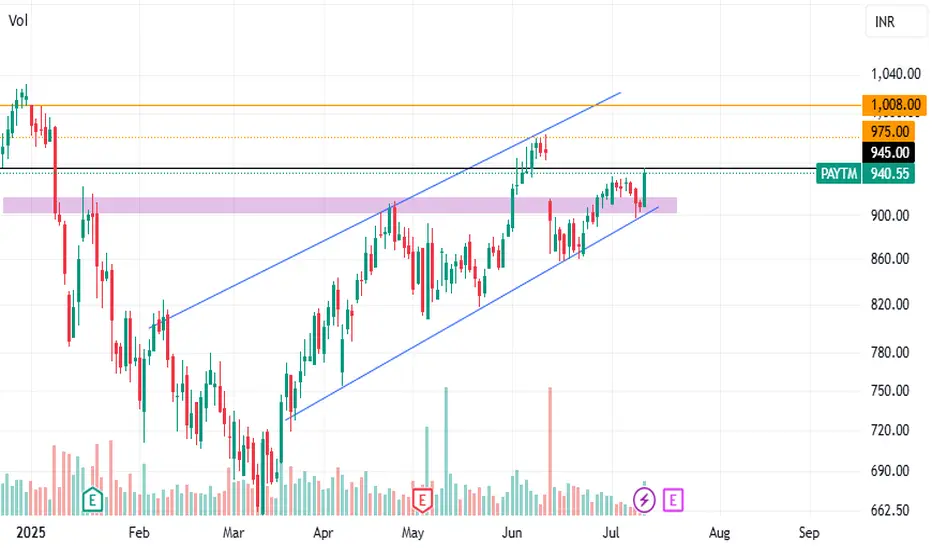
ONE 97 COMMUNICATIONS LTDPAYTM is trading within a well-defined ascending channel, and today's strong bullish candle is bouncing from the lower channel trendline. Volume has spiked near the lower channel trendline, reinforcing it as a strong support area.
Consider buying above 945, with short-term resistance at 975, which has been tested and rejected previously, and a major resistance level at 1,008.
PAYTM KARO PAYTM CMP - 975. If it cross and closs above 1050, chances of 1350 to 1700++ 900 strong support - Making inverse head and shoulder pattern so upside chances are higher...
One 97 Communications Ltd
About
Incorporated in 2000, One 97 Communications Ltd is India's leading digital ecosystem for consumers as well as merchants. As of March 31, 2021, the company has a 333 million+ client base and 21 million+ registered merchants to whom it offers payment services, financial services, and commerce and cloud services.
Key Points
India’s Leading Digital Ecosystem Platform
The company owns and operates India’s leading mobile payments and financial services distribution brand Paytm. It has built the largest payment ecosystem with a registered merchant base of 4.2 Cr, and 112 lakh payment devices facilitating over 1,100 transactions as of Q2 FY25.
Business Segments
1) Payment Services (59% in H1 FY25 vs 69% in FY22): The segment includes:
a) Payment Processing: Consumers can use cards, net banking, UPI, and UPI Lite to make online payments on the Paytm app including in-store payments through QR codes and devices.
b) Merchant Subscription: The company allows merchants to accept payments via QR codes, POS devices, payment gateway products, Soundbox devices, etc.
Operational Metrics:
Avg Monthly Transacting Users (Cr): 7.1 in Q2 FY25 vs 9.6 in FY24 vs 6.1 in FY22
Total Merchant Subscriptions (Lakhs): 112 in Q2 FY25 vs 107 in FY24 vs 29 in FY22
Gross Merchandise Value (Rs. Lakh Cr): 4.5 in Q2 FY25 vs 18.3 in FY24 vs 8.5 in FY22
2) Financial Services (21% in H1 FY25 vs 9% in FY22): The company offers mobile credit, insurance, and wealth management for consumers and merchants. It is also engaged in the loan distribution business, with capabilities across the entire loan lifecycle including origination, loan management, and collection. In Q2 FY25, the company disbursed loans totaling Rs. 5,280 Cr vs Rs. 52,390 Cr in FY24 and Rs. 7,623 Cr in FY22. 47% of the loans disbursed in FY24 were postpaid loans, suspended since May 2024, due to a decline in asset quality across the industry.
3) Marketing Services (20% in H1 FY25 vs 22): The company offers marketing services including ticketing, deals, gift vouchers, advertising, and loyalty services. It also distributes co-branded credit cards. The Gross Merchandise Value (GMV) for ticketing, deals & gift vouchers, etc., was Rs. 2,383 Cr in Q2 FY25. It has 13.8 Lakh activated credit cards as of Q2 FY25 vs 8.7 Lakh in Q2 FY24.
New Launches
In Nov 2024, the company launched UPI LITE Auto Top-up for recurring daily payments under Rs. 500. In H1 FY25, it added ticket booking services to Samsung Wallet, introduced Paytm Health Saathi for merchant partners, and unveiled India’s first NFC Card Soundbox.
Partnerships
In H1 FY25, the company partnered with FlixBus, to offer intercity bus travel tickets directly through the Paytm app and collaborated with Axis Bank to provide POS solutions and EDC devices (card machines) to the Bank & its merchant network.
Reduction of Marketing Expenses
In FY24, the company invested 9% of its total revenues on marketing and promotional expenses vs 17% in FY22.
Divestments
1) In Aug 2024, the company sold its movie ticketing business and events business to Zomato Ltd, for Rs. 2,048 Cr.
2) In Dec 2024, the company’s WOS Paytm Singapore sold its Stock Acquisition Rights in Japanese Payments Firm PayPay for Rs. 2,364 Cr.
Transfer of Business
In Sept 2021, the company transferred its Online Payment Aggregation Business to its WOS, Paytm Payments Services Ltd (PPSL). PPSL is pursuing a Payment Aggregator license from the RBI. After initial rejection in 2022 due to FDI compliance issues, PPSL secured government approval for past investments in Aug 2024 and has resubmitted its application. As of Jan 2025, PPSL is awaiting the RBI's decision on its resubmitted PA license application.
RBI Restrictions
In Jan 2024, the RBI restricted all services of Paytm Payments Bank Ltd (PPBL), a 39% associate of the company, permitting only the withdrawal of the existing customer balances however in Oct 2024, NPCI approved the company to onboard new UPI users In Oct 2023, RBI also imposed a monetary penalty of Rs. 5.39 Cr on PPBL.
This is just to boost my confidence. No Suggestions for buying. I will keep checking and updating my mistake if last post gone wrong...
Disclosure: I am not SEBI registered. The information provided here is for educational purposes only. I will not be responsible for any of your profit/loss with these suggestions. Consult your financial Adviser before making any decisions.

PAYTM | Symmetrical Triangle | Daily ### **Technical Analysis of Paytm (ONE 97 COMMUNICATIONS LTD - NSE)**
The chart highlights a **symmetrical triangle breakout**, signaling potential bullish momentum.
### **Key Observations:
**Symmetrical Triangle Formation:**
- The price oscillated between converging trendlines, forming a tightening range.
- The breakout above the upper trendline confirms bullish continuation.
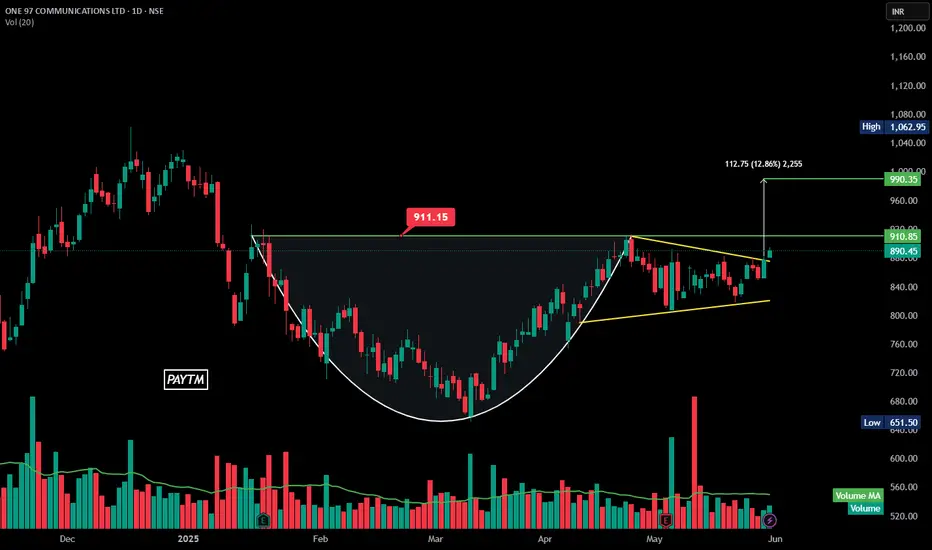
**Cup and Handle Preceding the Breakout:**
- The earlier **cup and handle** pattern reinforced accumulation before the breakout.
**Breakout Confirmation:**
- **Resistance Level:** **911 INR**—a key level to watch.
- **Target Price:** **990.35 INR**, representing a **12.86% upside** from the breakout point.
**Volume Surge:**
- Increased trading activity during the breakout strengthens the validity of the move.
### **Indicators to Watch:**
- **RSI:58, it confirms strong buying momentum.
- **MACD:** A bullish crossover reinforces trend continuation.
- **Support Level:** **911 INR**—holding above this level strengthens the bullish case.
PAYTM near resistance BreakOutNSE:PAYTM looks good on chart for upside move with Cup & Handle formation also Triangle pattern breakout recently on shorter chart.
Short term support for stock is around 850-855 and 820-830 is strong support zone,
on the upside sustaining above 900-910 resistance zone, stock can move till 980-1000.
no sell or buy recommendation.
Study material

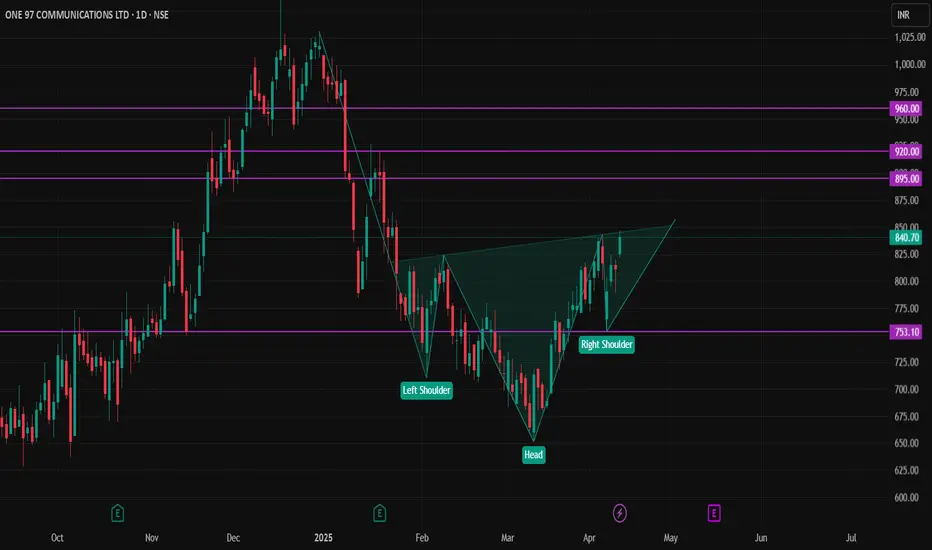
PAYTM STOCKNSE:PAYTM Stock is waiting for breakout the inverted head and shoulders pattern.
buy sustain above 750 rupees,
Target 1 is 885 to 895 rupees,
Target 2 is 915 to 920 rupees,
Target 3 is 950 to 960 rupees,
Stoploss close below 750 rupees atleast 1 day candle.
E-Commerce - Still BearishRe-publishing chart after updating zomato as eternal ltd. After double top formation, e-commerce still looking bearish. So far HH-HL formation not formed even in daily chart. Trendline hasn't broken out. Technical indicators are weak with no momentum. 12431 would be pivot point.

Paytm - Technical🇮🇳👉#Paytm shares have seen significant volatility. There was a notable surge of 4.53% on February 3, 2025, reaching an intraday high of ₹783, following strategic moves and renewed investor confidence. However, the stock has experienced a rollercoaster ride, with a 52-week low of ₹310 in mid-2024 due to regulatory concerns and a peak at ₹1,062.95 during the fintech boom of early 2024.🤞
➡️💘 Here a Technical 📉Chart about Paytm based on recent data for your reference

PAYTM - Time for it to go up?? - BOLD VIEW!Price Analysis & Overview:
1. Price is showing strength
2. Price structure change confirmation is still pending.
3. 600 area is critical.
4. Must be on radar.
5. Can be a potential multi-bagger!
6. I will plan an entry only after confirmation.
- Stay tuned for further insights, updates and trade safely!
- If you liked the analysis, don't forget to leave a comment and boost the post. Happy trading!
Disclaimer: This is NOT a buy/sell recommendation. This post is meant for learning purposes only. Views are personal. I share whatever I do. Please, do your due diligence before investing.
Thanks & Regards,
Anubrata Ray

Weekly Breakout after 2.5 yrs in PaytmNSE:PAYTM
After 2.5 years, Paytm communication is about to experience a weekly breakout. A breakout failed around October last year. This retest is crucial for the next bullish phase.
A stop loss of 850 would be ideal which is the swing low.
Buy above 1000 with a bullish candle & aim for an upward target of 1300,1550 & ATH.

Paytm-A risky U-turn multibagger stockPaytm has been in news for all negative reasons in the past which had caused the stock to crash to below 350 levels from 1800 during listing.
However, stock has now managed to breakout of the channel and also has given a horizontal breakout.
Above 1000, stock will fly and can become unstoppable.
Keep in watchlist. If you are an investor with high risk appetite, you shouldn't miss this potential breakout.

Paytm Looking Interesting on Weekly TF.NSE:PAYTM Paytm Looking Interesting on Weekly TF.
The Stock is being Continuously accumulated with rising volumes and trading above all major moving averages.
Although Still a Loss Making Company maybe there's Something someone Knows that we Don't know Yet that's what Price Action is Suggesting.
There's a Possibility of Triple Top Let's Wait and Watch.
🙋♀️🙋♂️If you have any questions about this stock, feel free to reach out to me.
📌Thank you for exploring my idea! I hope you found it valuable.
🙏FLLOW for more
👍BOOST if useful
✍️COMMENT Below your views.
Meanwhile, check out my other stock ideas below until this trade is activated. I would love your feedback.
Disclaimer: This analysis is intended solely for informational and educational purposes and should not be interpreted as financial advice. It is advisable to consult a qualified financial advisor or conduct thorough research before making investment decisions.
