Paytm

PAYTM --INTRADAY --22/08/2022PAYTM- HOURLY CHART -- INTRADAY SETUP -- 22/08/2022
1. PAYTM after making high at 840 sub level , profit booking seen and correction at last 2-3 session .
2. stock seen breakdown at hourly trendline 2 consectutive time upper channel breakdown also seen .
3. stcok at currently at strong support line around 770 level possibilities of pullback from this level for confirmation hourly / 15 min candle should close above 775 level then buy can initiate at intraday for target 780-790-800
4. breakdown at support 770 confirmation if stock close candle hourly/ 15 min bellow 765 short position can initiate for target 760- 750
** THIS IDEA IS FOR EDUCATIONAL PURPOSE .. Trade at own risk !!
HAPPY TRADING !!

PAYTM holding above first resistance 850 next targetPaytm has been following a nice parallel channel it can test the 750 support once again before going for the target 1, that would be 850.

PayTM - Target 800. GO GO GO!!!Paytm has been consolidating in a range for the last four months. The sentiment is still bearish as the price continues to trend higher in a channel forming an interesting classical cup handle price pattern. A failed breakout failing is an excellent opportunity to enter.
Target 800 Stop 698 Enter 715

Parallel Channel Paytm - 2Parallel Channel 2 entered
A Low of 510.05
10 march high break i.e., 795.80
will take resistance as a support between 861.35 and 893.70
parallel channel breakout after 1 sep 2022
retest its value near 861.35 and 893.70
company is in loss although next year comes in profit till march 2023 endings...
will gain its valuable price of 2150 (approx) again till june 2023...
#FIIs and #DIIs increased its percentage of shares in june 2022 ending
#paytm #paytmlong #paytmupi

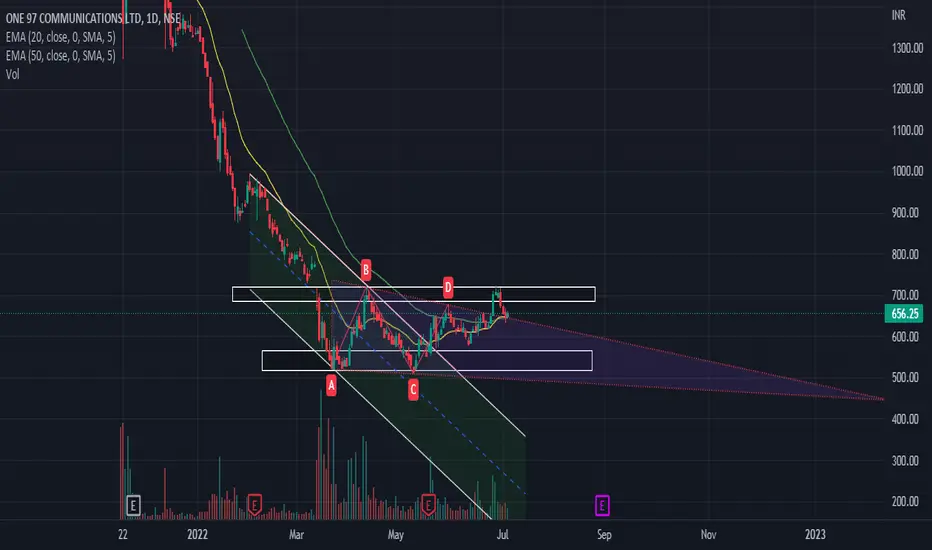
Parallel Channel PaytmParallel Channel 1 completed
A Low of 510.05
10 march high break i.e., 795.80
taking resistance as a support between 757.90 and 775.90
parallel channel breakout
checking retest
yesterday paytm results has given profit indication but company is in loss although next year comes in profit till march 2023 endings...
will gain its valuable price of 2150 (approx) again till june 2023...
#FIIs and #DIIs increased its percentage of shares in june 2022 ending

Ascending triangle breakout in PAYTM ?Ascending Triangle Breakout in PAYTM in Daily Chart.
After the continues down fall from the listing, now, the downside momentum was paused.
Bulls are slowly taking control of the stock, Previously they tired for breakout but stock was stuck in 750-770 range.
Then stock came around 680 range where there was a strong trend line support. Next day formed inside bar candle, by that again bulls paused further downside movement.
Now, the stock broke its previous 750-770 range with good candle supported by volume.
So, 770 range will be immediate support, 720 will be next Important support
Stock has a potential to reach 930 level in coming days.
If any one taking trade now, 730 will be SL.
Any one taking position for retest, then Risk taker keep 678 as SL. For less Risk taker 697 will the SL.
Overall analysis is given in the chart.
This is just a view not a recommendation to trade. Do your own analysis before taking trade.
NSE:PAYTM

PAYTM -- INTRADAY SETUP- 27/07/2022PAYTM -- 15 MIN CHART -- INTRADAY SETUP -- 27/07/2022
1. Last trading session paytm seen profit booking at hourly upper channel resistance level above 750 level and sharp fall seen from that level stock seen big correction of 7-8% towards sub 690 level
2. RSI and matrix indicators also shown overbought level from there stock fall towards oversold level now 15 min chart
3. This fall technically shown as death cross negative cross of 21,44,200 HMA , circle mark as death cross level seems stock falls sharply
4. at present stock at oversold level so some bounce can seen intraday next session buy around 695-698 target 705-710-720 and stop loss bellow 687 level
5. HAMMER AND INVERSE HAMMER CANDLE form last 15 min candle as indication of some trend reversal from oversold level
5. Next session if nifty open gap down for opening and stock open bellow hammer candle 690 then stock can continue bearish momentum so no trade should initiated at this lecel
** THIS IDEA IS FOR EDUCATIONAL PURPOSE ..trade at own risk !!
HAPPY TRADING !!

PAYTM LOOKING GOOD ABOVE 740PAYTM looking good above 740.
We can see price action in chart. after breakout of 715 and pullback from 700. We will look for upside more.
Entry - 740
Target - 795 , 840 , 870
Sl - 700
(Education Purpose Only)

PAYTM -- INTRADAY SETUP -- 18/07/2022PAYTM -- HOURLY CHART -- INTRADAY SETUP
>> As per previous idea of paytm, Stock shown good bullish momentum above 680 level. now stock can seen strong upward movement from this level
>> trendline shows good support at new channel form around 700-705 level as support and 735-740 as resistance level for channel
>> RSI seen above 60 level on dialy chart which is also sign of strong upward movement from current level
>> MACD above signal and center line at daily chart bullish indicators.
>> Stock currently trading above 21, 50, 200 SMA
>> BUY can initiate on intraday at 705-710 level for target 715-725-730 stop loss bellow trendline support at 695
>> intraday support at 700-705 Resistance 730-740
** THIS IDEA IS FOR EDUCATIONAL PURPOSE .. trade at own risk !!
HAPPY TRADING !!

PAYTM READY TO FLY - BREAKOUT NSE:PAYTM Was facing resistance at 721 but today ii has broke above 721 and given a quick upward move. You can Add a little Quantity now and also wait for retest when at 721. On crossing 200 Day EMA add full Quantity of With SL at 688 & 630 With Target of Attest 1:2
LIKE | FOLLOW | COMMENT

#Paytm #One97 #StockmarketOne97 aka Paytm
Suggested earlier also at 560 levels and target achieved
Stock again forming an ascending triangle pattern.
Currently trading at its Resistance zone also, if break we can see good 8-10% upside move
Safe buy above 725/730 levels for positional targets of 775/800 to upto 850 levels also.
Also, keep booking partial 1-2% profits and use a strict trailing stop loss.
----
Note:
Above levels are for education purposes only
Do your own analysis before taking any trade
Use a strict trailing stop loss.
Please Like & Follow

PAYTM Paytm was in downtrend since so long. It has ended and forming higher high now in 1D time frame. One good green candle is needed in weekly & daily tf. It will form soon hopefully,

Swing or positional setup in PAYTMPaytm forming a inverse head shoulder pattern on daily timeframe ..
a good breakout can happen target are according to Given levels


PAYTM has retested and showing bullish signshey guys ,
after a long DOWNTREND ,
PAYTM stock has shown a signs of recovery ,
from the very FIRST DAY , this stock was completely controlled by bears
but now , this stock was following a chart pattern called FALLING WEDGE
last week , this stock was trying to cross this pattern
ans it was SUCCESSFULLY COMPLETED .
And now this stock has retested
and it has shown a great green candle ,
which convince us to bet on this stock
and earn HIGH RETURNS
BUT FIRST CONSIDER THE GLOBAL SITUATIONS
.INFLATION
. WAR BETWEEN UKRAINE AND RUSSIA
. RISING BANK RATES
. AND INCREASING EXPORT DUTIES
AFTER CONSIDERING THESE SITUATIONS
YOU CAN BUY THIS STOCK
BUT PLS GUYS , SEE THAT IF MARKET IS OPENING GAP DOWN
THAT THIS STOCK IS UNDER HIS RESISTANCE AREA
THEN PLS WAIT AND LET THIS STOCK TRY TO CROSS HIS RESISTANCE AREA
and guys , if u like my analysis
. follow
. like
. and comment
PAYTM -- UPPER CHANNEL BREAKOUTPAYTM --DAILY CHART -- UPPER CHANNEL BREAKOUT
1. PAYTM Daily chart seen upper channel breakout above 680 today trading session which was strong resistance earlier broken upside seen chart bullish now
2. RSI seen move above 60 daily chart
3. as per new chart setup 660-680 woRk as strong support with target 720-750-780-800 and stop loss can place bellow 625 level
4. MACD seen bullish , stock trading above 20,50,200 Moving avg.
** THIS IDEA IS FOR EDUCATIONAL PURPOSE .. trade at own risk
HAPPY TRADING . !!

PAYTM: Will it turn the tables for Investors now?#PAYTM #Chart
Classic VCP Break Out here. Ride to 770-775 highly possible here. However, that's also the area of concern. Major upside only above this level. Need to hold on to 650 on Daily Closing Basis for this to happen.

PAYTM - showing good reversal signs#PAYTM, may give a breakout above this 730. better to add after a breakout and re-test to 730, can be a potential stage 2 candidate.

PAYTM -- INTRADAY SETUP- 06/06/2022PAYTM -- HOURLY CHART -- INTRADAY SETUP -- 06/06/2022
1. PAYTM trading currently at upper channel on hourly chart
2. trendline seen consecutive support at lower level, stock currently close at trendline support closing candle where bounce back likely seen on next trading session .
3. for buy level stock should cross level 625 as trendline breakout on next trading session where target upper side can seen above 635-640 level,
4. if trendline breakdown bellow 615 level stock will seen downside target bellow 600 level on intraday
5. overall stock will be uptrend if 15 min closing candle above 625 or downtrend if 15 min candle bellow 615
6. positive in fvr of uptrend is histogram seen double bottom means supply can be decrese from current level and more fvr of uptrend from current level
7. RSI abobe 50 level at daily basis as neutral to positive
** THIS IDEA IS FOR EDUCATIONAL PURPOSE .. trade at owb risk !
HAPPY TRADING. !!

book value increasing month by monthBook value increasing month by month
PROS
Company has reduced debt.
Company is almost debt free.

#StockMarket #StockIdeas #StocktoWatch #StockToBuy #positionalPAYTM
After listing stock corrected very much upto 75%.
Stock corrected upto 510 levels & it looks strong support and form double bottom pattern.
Buy for mid to long term view and add more at 510 levels
But keep Strict Stop loss of 495 levels.
----
Note:
Above levels are for education purposes only
Do your own analysis before taking any trade
Please Like & Follow

Paytm exactly played my pointsEvery time i shared all the buying and selling zone of paytm and again you can check my previous analysis of paytm n compair it with this post. I shares quality analysis with you but not getting that appreciable support you can check and compair all my post you'll get it
