PCBL Chemical LtdPCBL is nearing a breakout zone in a tightening triangle pattern and is making higher lows and lower highs. The stock is trading above the short-term EMA, which is a positive signal.
Buy on breakout above 437, with the target of 465, 485 and 500 (if momentum continues)
Stop loss: set below 410
PCBL

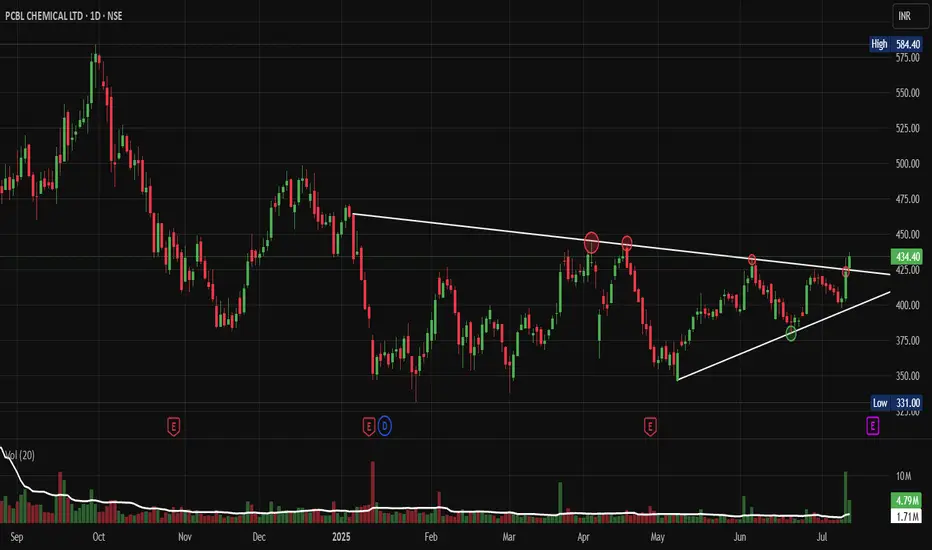
PCBL: The Sleeping Giant Ready to BreakOut of Its TriangleNSE:PCBL : The Sleeping Giant Ready to Break Out of Its Consolidation Triangle
Price Action Analysis:
• Stock has been trading in a well-defined ascending triangle pattern since early 2025
• Current price at ₹434.40 represents a +2.53% gain, showing bullish momentum
• The pattern shows a higher low formation with resistance around ₹450-460 levels
• Recent price action suggests an accumulation phase with controlled volatility
Volume Spread Analysis:
• Volume has been consistently above average during recent sessions (4.79M vs 1.71M average)
• Volume spike visible in recent trading sessions, indicating increased institutional interest
• The volume pattern supports the price consolidation with periodic accumulation phases
• Higher volume during up-moves compared to down-moves suggests buying interest
Key Technical Levels:
Support Levels:
• Primary Support: ₹420-425 (recent swing low)
• Secondary Support: ₹390-395 (ascending trendline support)
• Major Support: ₹360-370 (previous consolidation zone)
Resistance Levels:
• Immediate Resistance: ₹450-460 (triangle upper boundary)
• Key Resistance: ₹480-490 (previous highs)
• Major Resistance: ₹520-530 (psychological level)
Base Formation:
• The stock has formed a strong ascending triangle base over 6-7 months
• Base depth of approximately 15-20% from highs to lows
• Duration suggests a sustainable breakout when it occurs
• Base shows characteristics of institutional accumulation
Technical Patterns:
• Primary Pattern: Ascending Triangle (Bullish)
• Secondary Pattern: Flag formation on shorter timeframes
• Volume-Price Relationship: Positive divergence during recent consolidation
• Moving Average Setup: Price trading above all its key moving averages
Trade Setup:
Entry Strategy:
• Breakout Entry: ₹465-470 (above triangle resistance with volume confirmation)
• Pullback Entry: ₹440-445 (on any dip to support with volume)
• Accumulation Entry: ₹420-430 (for longer-term investors)
Exit Levels:
• Target 1: ₹520-530 (measured move from triangle base)
• Target 2: ₹580-590 (previous swing high zone)
• Target 3: ₹650-680 (extension target based on base depth)
Stop-Loss Levels:
• For Breakout Trades: ₹445-450 (below breakout level)
• For Accumulation Trades: ₹410-415 (below key support)
• Trailing Stop: Use an 8-10% trailing stop after the first target
Position Sizing:
• Conservative Approach: 2-3% of portfolio
• Moderate Approach: 3-5% of portfolio
• Aggressive Approach: 5-7% of portfolio (only for experienced traders)
Risk Management:
• Risk-Reward Ratio: Minimum 1:2 for all trades
• Maximum risk per trade: 2% of total capital
• Use the position sizing calculator based on stop-loss distance
• Avoid adding to losing positions
• Book partial profits at each target level
Sectoral Backdrop:
Chemical Sector Overview:
• Indian chemical sector showing strong fundamentals with export growth
• The speciality chemicals segment is experiencing robust demand
• The government's PLI scheme supports domestic chemical manufacturing
• Global supply chain diversification benefiting Indian chemical companies
Industry Trends:
• Increasing demand for agrochemicals and pharmaceutical intermediates
• Focus on sustainable and green chemistry practices
• Rising input costs are being managed through pricing power
• Strong export opportunities in speciality chemicals
Fundamental Backdrop:
Company Overview:
• NSE:PCBL is a leading player in speciality chemicals and carbon black
• Strong presence in the tire industry through carbon black manufacturing
• Diversified product portfolio, reducing concentration risk
• Established relationships with major tire manufacturers
Financial Highlights:
• Consistent revenue growth over the past few quarters
• Improving margin profile due to operational efficiency
• Strong balance sheet with manageable debt levels
• Increasing return on equity and asset efficiency
Growth Drivers:
• Expanding tire industry in India and globally
• New product launches in speciality chemicals
• Capacity expansion plans for key products
• Focus on high-margin speciality products
Risk Factors:
• Raw material price volatility
• Environmental regulations compliance costs
• Competition from global players
• Cyclical nature of the tire industry
My Take:
NSE:PCBL presents a compelling technical setup with its ascending triangle pattern nearing completion. The combination of strong volume accumulation, supportive sectoral trends, and improving fundamentals creates a favourable risk-reward scenario. Traders should wait for a decisive breakout above the ₹465 levels, accompanied by volume confirmation, for optimal entry. Meanwhile, investors can consider gradual accumulation at current levels, exercising proper risk management.
Keep in the Watchlist.
NO RECO. For Buy/Sell.
📌Thank you for exploring my idea! I hope you found it valuable.
🙏FOLLOW for more
👍BOOST if you found it useful.
✍️COMMENT below with your views.
Meanwhile, check out my other stock ideas on the right side until this trade is activated. I would love your feedback.
Disclaimer: "I am not a SEBI REGISTERED RESEARCH ANALYST AND INVESTMENT ADVISER."
This analysis is intended solely for informational and educational purposes and should not be interpreted as financial advice. It is advisable to consult a qualified financial advisor or conduct thorough research before making investment decisions.
"PCBL Breaks Resistance, Signaling Strong Uptrend Potential "PCBL has successfully broken above a key resistance level, indicating strong bullish momentum. This breakout suggests increased investor confidence and the potential for further price appreciation. If the stock sustains this momentum with good volume, it could continue its upward trend. However, traders should watch for any pullbacks or retests of the breakout level before confirming the next move. 🚀📈
🚨 Disclaimer: Not Financial Advice! 🚨
This is for educational (and entertainment) purposes only! 📚😂 Do your own research, consult a professional, and remember—stocks can go up, down, or sideways faster than your morning coffee spills! ☕📉📈 Invest responsibly! 🚀💸
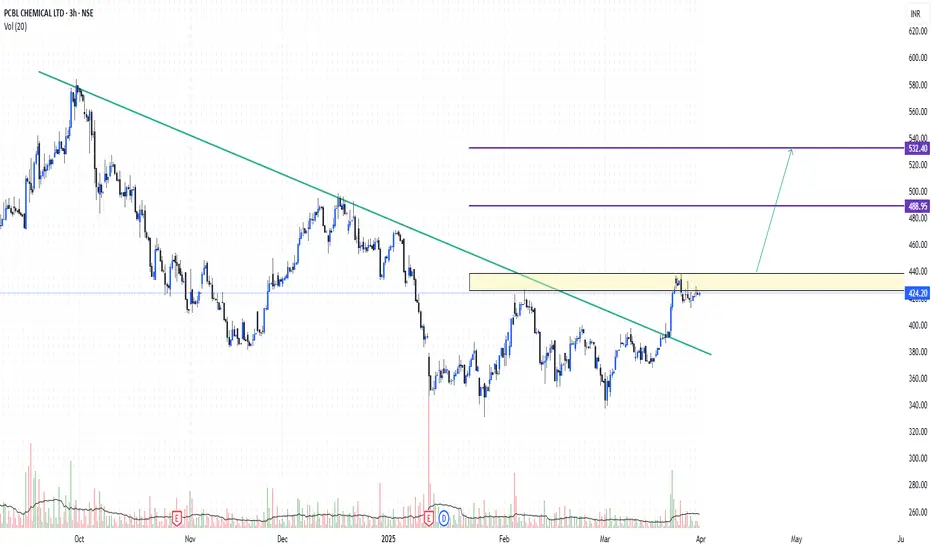
PCBL Daily Chart- LONGHere’s a detailed analysis of PCBL on Daily Chart
1. Trendline
A downward sloping trendline is drawn from previous swing highs, indicating a resistance zone. The recent price action shows that the stock has broken above this trendline with strong momentum, suggesting a potential trend reversal or breakout.
2. Volume
The chart highlights rising volumes as the price breaks out of the trendline. Increasing volume during a breakout adds strength to the move, confirming that buyers are stepping in.
3.Price Pattern
A Triple Double Bottom pattern is visible at the bottom, marked by three distinct touches at the same support level. A triple bottom is a bullish reversal pattern, and the breakout above the trendline validates the pattern, indicating a potential upward move.
4. 20 EMA (Exponential Moving Average)
The price is trading above the 20 EMA, which shows short-term bullish momentum. Sustained trading above this level confirms that the stock is in an uptrend.
5.Suggested Trade Setup:
Entry: After a retest of the trendline around ₹400–405 or on a continuation above the breakout candle high of ₹419.40.
Stop Loss (SL): Below the recent swing low or the 20 EMA, around ₹385.
Target: First target: ₹450 (psychological level and prior resistance).
Second target: ₹475 (previous supply zone).
Educational Disclaimer:
This analysis is for educational purposes only and should not be considered financial advice. Please conduct your own research or consult a professional advisor before making any trading decisions.

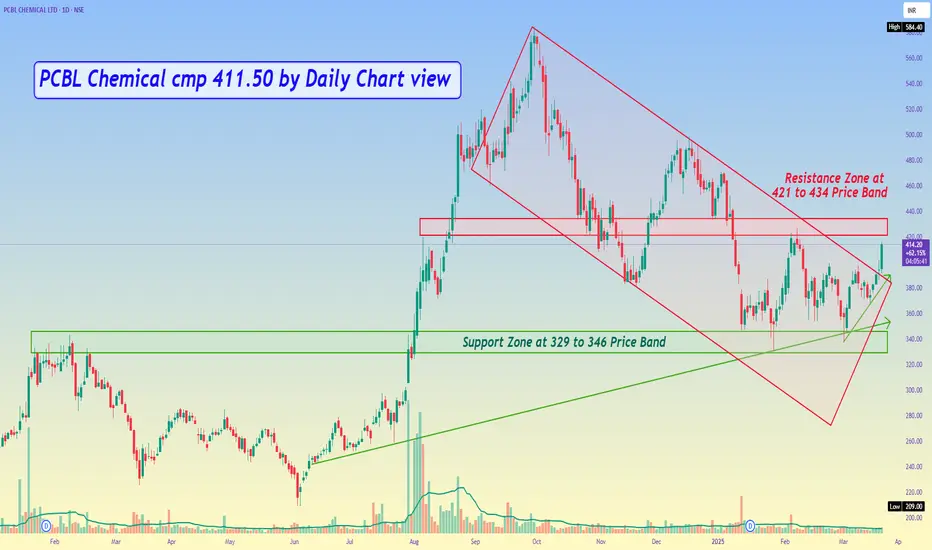
PCBL Chemical cmp 411.50 by Daily Chart viewPCBL Chemical cmp 411.50 by Daily Chart view
- Support Zone at 329 to 346 Price Band
- Resistance Zone at 421 to 434 Price Band
- Falling Price Channel breakout in the making process
- Volumes improving in close sync with avg traded quantity
- Much awaited breakout seems happening from the Support Zone
Pcbl Chemical – Supply Turned Demand, Higher Lows & Breakout Set📊 Stock: PCBL CHEMICAL LTD (NSE) – 1W Chart
📈 Bullish Structure Developing!
Supply turned into demand! Initially, the stock faced a strong supply zone, leading to a correction and consolidation.
Breakout & Sustained Move – After breaking out, the stock sustained above the breakout level for a long period, confirming demand at this zone.
Higher Lows Formation – A classic bullish structure is developing, indicating accumulation.
CT Base Breakout Approaching – The stock is breaking out of a contraction phase, which could lead to further upside.
Volume is a concern, but price action remains strong. A volume pickup could fuel a stronger move! 🚀
💬 What’s your take on this setup? Are you tracking PCBL? Drop your thoughts below! ⬇️

PCBL - opportunity for quick 4% gainsNSE:PCBL
cmp 388
there is an opportunity for getting quick 4% gains in this stock.
on hourly timeframe there is trendline breakout plus positive diversion on the RSI
I will be looking for entry at cmp 388 with target of 405-410
SL will be 366
The objective of this analysis is knowledge sharing and education. There isn't any buy or sell advise in this article.
It is expected of each person to carry out own research and evaluation to ascertain whether my perspective is matchingwith your studies.

PCBL - Ichimoku Breakout📈 Stock Name - PCBL Limited
🌐 Ichimoku Cloud Setup:
1️⃣ Today's close is above the Conversion Line.
2️⃣ Future Kumo is Turning Bullish.
3️⃣ Chikou span is slanting upwards.
All these parameters are shouting BULLISH at the Current Market Price and even more bullishness anticipated AFTER crossing 573.
🚨Disclaimer: This is not a Buy or Sell recommendation. It's for educational purposes and a guiding light to learn trading in the market.
#CloudTrading
#IchimokuCloud
#IchimokuFollowers
#Ichimokuexpert
Excited about this analysis? Share your thoughts in the comments below!
👍 Like, Share, and Subscribe for daily market insights! 🚀
#StockAnalysis #MarketWatch #TradingEducation #ichimoku #midcap #smallcap #largecap #PCBL

PCBL Ltd - Breakout Setup, Move is ON...#PCBL trading above Resistance of 505
Next Resistance is at 588
Support is at 373
Here are previous charts:
Chart is self explanatory. Levels of breakout, possible up-moves (where stock may find resistances) and support (close below which, setup will be invalidated) are clearly defined.
Disclaimer: This is for demonstration and educational purpose only. This is not buying or selling recommendations. I am not SEBI registered. Please consult your financial advisor before taking any trade.

PCBL Ltd - Breakout Setup, Move is ON...#PCBL trading above Resistance of 373
Next Resistance is at 505
Support is at 233
Here are previous charts:
Chart is self explanatory. Levels of breakout, possible up-moves (where stock may find resistances) and support (close below which, setup will be invalidated) are clearly defined.
Disclaimer: This is for demonstration and educational purpose only. This is not buying or selling recommendations. I am not SEBI registered. Please consult your financial advisor before taking any trade.

PCBL - Bullish viewReasons to buy:
1. Stock is trading at all time high. Breakout in one day chart has already occurred.
2. Buying at retest.
I have entered the trade at market level.
All my trades are strictly for educational purpose. Please do your own analysis before entering the trade. I am not responsible for your profit or loss.

PCBL BreakoutPCBL Breakout, Buy Only On Dip To :
Buy 20% At 178
Buy 20% At 166
Buy 30% At 155
Buy 30% At 145
SL - 108 ( Monthly Closing Basis )
Target - 300+++

#LONG:Cup & Handle pattern formed in PCBL(daily chart)PCBL reached an ATH of 159.40 in Jan'18 before falling by 83% to a low of 27.05. It again rose to a high of 153.75 in Sep'22 and thereafter fell to a low of 108.70. In the process it formed a perfect Cup & Handle pattern on daily charts. Since, 2018 it was trading below multi-year resistance trend line.It has given from cup & Handle pattern on 14th Jun'23, forming a large bullish candle rising 8.52% in a day.The Stock had already risen by 8.74% today(at the time of writing this article), hitting an ATH of 178.30, which is also a 10-Year High.
Stop Loss: 15.5 (daily closing basis)
Potential: 55 to 90%
Time period: 6 months(Expected)

PCBL : Breakout Candidate#pcbl #trendingstock #momentumtrade #breakout
PCBL: 1-3 Months
>> Strong Bounce back from Recent Volatility
>> Good Inherent Fundamental Strength
>> Breakout Candidate
>> Good Strength & Volume
>> Low Risk High Reward Trade
Swing Traders can lock Profit at 10 % & Keep Trailing
Please give a Boost or comment if u r Liking the analysis & Learning from it. Keep showing ur Love by following
Disclaimer : This is not a Trade Recommendations & Charts/ stocks Mentioned are for Learning/Educational Purpose. Do your Own Analysis before Taking positions.

PCBL : Breakout Candidate#PCBL #breakoutstocks #vcppattern #trendingstock
PCBL : Weekly Chart (1-3 Month)
>> Breakout Candidate
>> Trending Setup
>> Repeated VCP Patterns Visible
>> Volumes Building up
>> Good Strength in stock
Swing Traders can lock 10% profit & keep Trailing

Q3 2024 Looking into the company’s Performance, PCBL Ltd’s revenue increased by 11 percent on a quarter-on-quarter basis from Rs. 1,487 crores in Q2FY24 to Rs. 1,657 crores in Q3 FY24. Further, revenue increased by 21 percent year on year from Rs. 1,363 crores in Q3FY23 to Rs.1,657 crores in Q3FY24
PCBL Ltd’s net profit increased by 20 percent on a quarter-on-quarter basis from Rs. 123 crores in Q2FY24 to Rs. 148 crores in Q3FY24. Further, net profit increased by 52 percent year on year from Rs. 97 crores in Q3FY23 to Rs.148 crores in Q3FY24.
According to the business filing, PCBL Ltd has announced an interim dividend of Rs. 5.50 per equity share of Re. 1 each for the fiscal year ending March 31, 2024, and has set Monday, January 29, 2024, as the Record Date for payment of the aforementioned Interim Dividend.
Ashish Kacholia holds 70,84,990 shares, i.e. equivalent to 1.88 percent of the company as of the December quarter of 2023.

Swing Trade Opportunity in PCBLPossible trade only if the friday's close is higher than the Thursdays close price
Refer the chart for Entry, Target and SL.
NOTE: This trade is only for Equity Swing buy and not to be considered for options trading.
Please do follow Position Sizing and Risk Reward Ratio while planning any trades.
Note: This information is for education purpose only and please do your own research and consult your financial advisor prior to taking any action.
TO CONNECT WITH ME CHECK OUT MY BIO.
If you like this Idea, Please do like my ideas and share it with your friends. check my bio.
Please boost my ideas and send cheers as it acts as a motivation to keep posting my analysis.
Thank you

PCBL - Ichimoku BreakoutStock Name - PCBL Ltd
Ichimoku Cloud Setup :
1). Today's close is above the Conversion Line
2). Future Kumo is Turning Bullish
3). Chikou span is slanting upwards
All these parameters are showing bullishness at Current Market Price
and more bullishness AFTER crossing 262
#This is not Buy and Sell recommendation to any one. This is for education purpose and a helping hand to learn trading in Market.
#CloudTrading
#IchimokuCloud
#IchimokuFollowers
#Ichimokuexpert
I hope you all like my analysis.
Please do share your thoughts into comment section.
Please give a like, share & subscribe for daily analysis.

PCBL - Cup & Handle #PCBL
CMP : ₹ .197.3
Broken 2 years resistance trend band . Also a Cup & Handle formation is visible. Technically looking good.
Disclaimer : Post only for educational purpose. Not a buying / selling recommendation. This is only my personal view. I am not a SEBI registered analyst . Do your own analysis and ac t accordingly .

PCBL Ltd buy callmultiyear breakout stock
buy @ 145
tgt-170\200\250\500
multiyear breakout stock
buy @ 145
tgt-170\200\250\500

PCBL LTD - 150% RETURNS!!!BUY - PCBL LTD
CMP - Rs. 132
Target - 1: Rs. 250
Target - 2: Rs. 335
.
.
Technicals - Cup and Hande Pattern BO
.
This is just a view by an expert analyst, please invest at your own risk.
.
Follow me for more!

Pcbl breakout trade idea for swing trading I daily make educational content videos for swing trading

PCBLPCBL break the support and it shows the confirmation signals by touching the break out line ,so we expect a down in price
