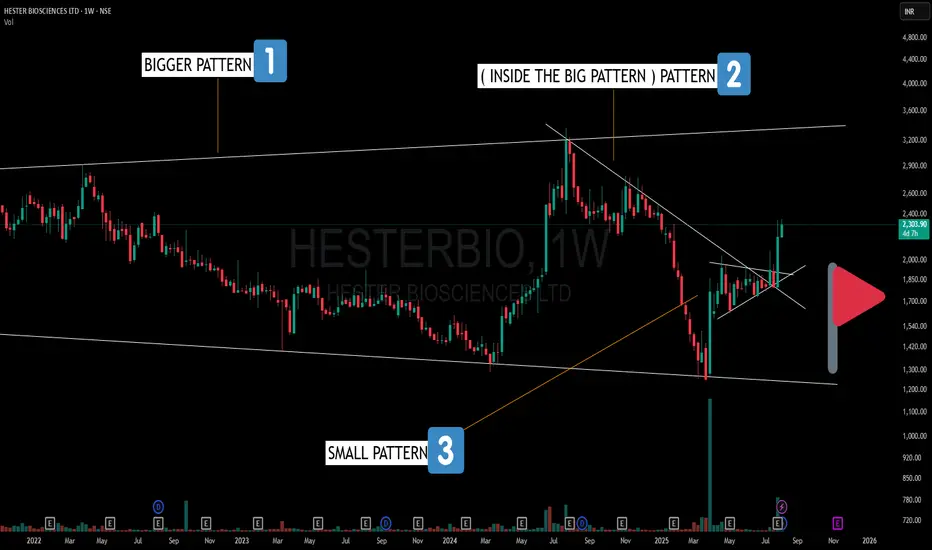
HESTERBIO – A Pattern Inside a Pattern Inside a Pattern!🔍 Here’s what stands out on the Weekly Chart:
1️⃣ Broadening Pattern – Larger structure with higher highs and lower lows, indicating expanding volatility.
2️⃣ Counter Trendline Break – A smaller, random pattern within the broadening formation showing V-shape recoveries and trend shifts.
3️⃣ Bullish Pennant – A compact consolidation pattern just before a strong breakout leg.
This is a great example of how multiple time-frame structures and nested patterns can co-exist—each adding another layer to market behavior.
Pennant
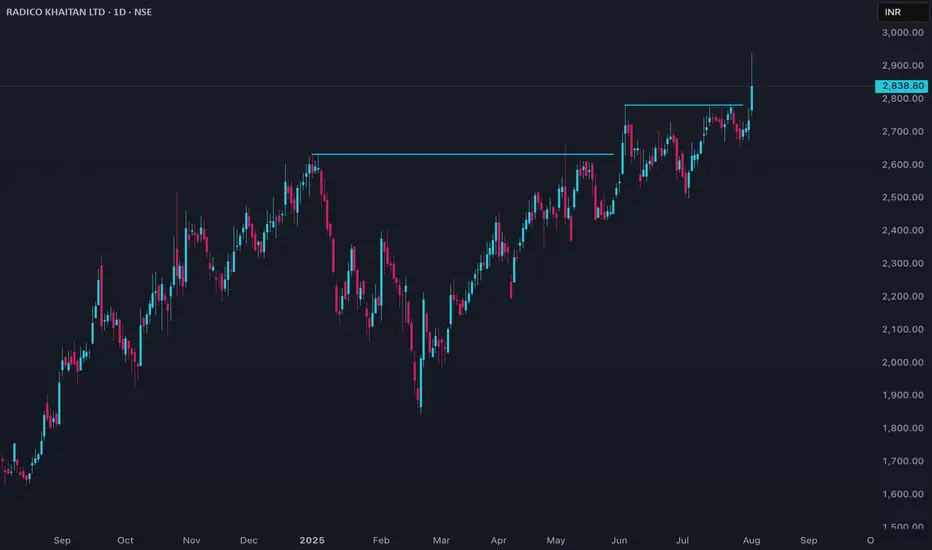
Radico Price ActionRadico Khaitan’s stock is trading around ₹2,840 as of early August 2025, having climbed sharply from about ₹2,700 in July and near ₹2,050 back in February. The share price hit an all-time high at the start of August and has more than doubled over the past 12 months, outperforming its peers in the spirit and beverages sector.
Recent price momentum has been driven by strong financial results: for the quarter ending June 2025, Radico reported net sales of over ₹1,500 crore, a year-on-year increase of more than 32%. Market capitalization is robust and the stock is actively traded, with volumes surging during rally periods. However, valuation is elevated: the price-to-book ratio is around 14 and price-to-earnings is at the high end for its segment, reflecting rich investor expectations.
Operationally, Radico maintains steady margins and has shown above-average revenue growth, consistently launching new premium products and expanding distribution. The company’s return on equity averages about 11–12% over three years, slightly below top FMCG performers but stable.
Technically, the stock is in a strong uptrend, trading well above major moving averages, but may be considered overbought in the very short term after recent rapid gains. Liquidity remains healthy, supporting continued volatility and trading opportunities.
In summary, Radico Khaitan is a high-growth, well-established spirits company with strong recent sales and a share price at historic highs. While fundamentals support continued strength, caution is warranted given expensive valuations and the potential for short-term corrections following such a swift rally.
Gopal Snacks Ltd Price ActionGopal Snacks Ltd’s share price is around ₹359.5 as of August 3, 2025. Over the past year, the stock has shown only a modest increase (up about 1%), with greater strength seen in the last six months (up 7%). The 52-week range is broad, with a high near ₹520 and a low around ₹253, indicating significant volatility. Average daily trade volumes have also risen, supporting liquidity.
The company’s financial performance for FY25 shows total revenue at approximately ₹1,474 crore, a slight rise over FY24. However, net profit slumped sharply to ₹19 crore in FY25 from ₹100 crore a year earlier, with the operating profit margin declining to about 5.3% (from nearly 10%). EPS stands at ₹1.52 for the most recent year. Key ratios—P/E around 82.7 and P/B near 11—point to a premium valuation, especially considering the weak recent profit growth.
Operationally, Gopal Snacks has faced challenges, including a significant quarterly loss attributed to rising costs and a one-off fire incident, which hurt margins and caused a 12% revenue drop that quarter. As a result, compounded profit growth is negative for the trailing twelve months, and return on equity dropped to 14% (from nearly 27% over the previous three years).
Promoter holding remains high (over 81%), but the stock is classified as high-risk, with volatility more than three times that of the broader Nifty index. Despite a positive dividend payout ratio (now around 66%), overall yield remains modest at less than 0.3%.
In summary, Gopal Snacks Ltd is a small-cap FMCG stock trading markedly below its 52-week highs, reflecting weak earnings momentum after a challenging year. Stronger long-term fundamentals and established market presence support the stock, but recent headwinds—including falling margins, higher volatility, and rich valuations—call for investor caution if seeking near-term upside.

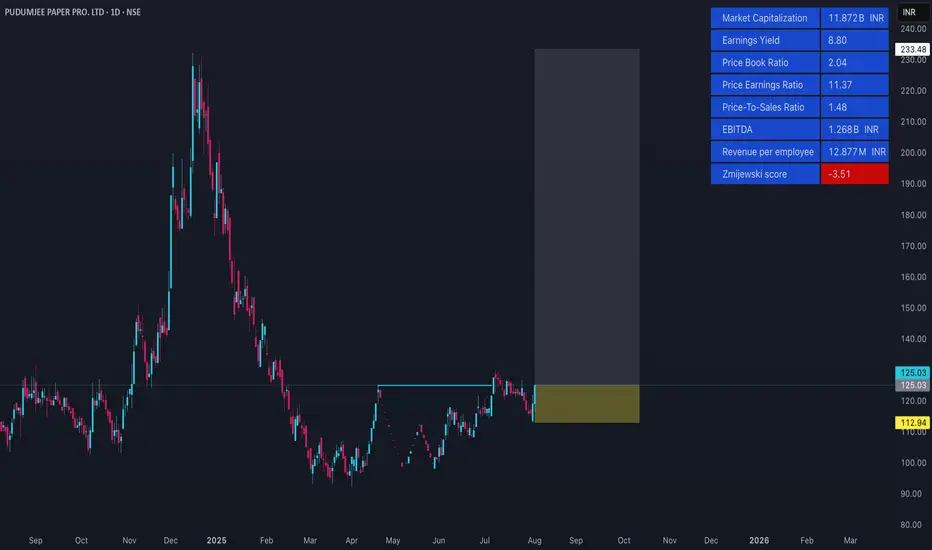
PDMJEPAPER Price ActionPudumjee Paper Products (PDMJEPAPER) trades near ₹125 as of early August 2025, with 52-week highs around ₹232 and lows near ₹90. The stock has demonstrated moderate to high volatility in recent months, with sharp daily moves both upward and downward. Over the last three months, the share price has risen roughly 4–5%, though its one-year return is negative, down about 5%. In contrast, the stock remains an exceptional long-term outperformer: up over 200% in 3 years and roughly 720% over 5 years.
Short-term price trends show a recovery from late June and July lows near ₹110–116, gaining back strength towards ₹125 by August. The market capitalization stands at approximately ₹1,100 crore, and analyst platforms suggest the current valuation is around 11–12 times earnings, with a price-to-book below 2, implying moderate valuation relative to recent growth.
Turnover and liquidity are healthy, with notable volume spikes during price rallies. The company has also outperformed its sector over multi-year periods. Historically, returns in August are mixed, but positive August rallies have been observed in recent years.
Operationally, Pudumjee Paper remains a mid-cap paper manufacturer with a focus on volume growth and steady, positive operating margins. While dividend yields are modest, financial stability is reflected in recent results. Investors should remain cautious due to past volatility and the cyclical nature of the paper sector, but the stock’s long-term performance signals strong sector positioning and improving fundamentals.
This summary is based on current market prices and trends as of August 2025, with emphasis on key performance and valuation metrics, and does not include references to specific data sources.
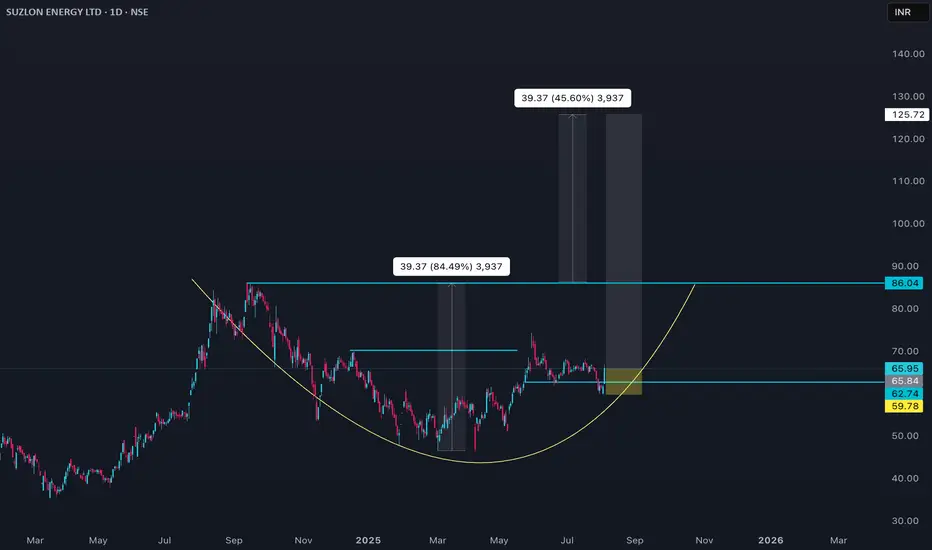
Suzlon Energy Price ActionSuzlon Energy’s share price is around ₹66 as of early August 2025. The stock price has shown strong volatility with a 52-week high near ₹86 and a low around ₹46. Over the last three months, the price has gained about 17%, but it has declined slightly by around 2–3% over the past year. Long-term gains are impressive, with the stock appreciating over 850% in 3 years and over 1,400% in 5 years.
Financially, Suzlon posted robust revenue growth of approximately 67% year-on-year, with revenues crossing ₹10,800 crore in the latest fiscal year. Profitability has surged, highlighted by a net profit increase of over 200%, strong EBITDA margins near 16–18%, and return on equity above 40%. The company has a healthy order book of 5.6 GW, indicating strong future revenue visibility.
Valuation metrics show a high price-to-earnings ratio around 40-43 and a price-to-book ratio near 14, reflecting elevated investor expectations. The stock carries a high beta near 2.6, indicating it is more volatile than the overall market.
Suzlon’s debt has been reduced significantly over recent years, improving financial stability. The firm is a leading player in India's wind energy sector, supported by government policies and large-scale renewable targets.
Seasonally, August tends to be a weaker month historically, but recent positive news like major turbine order wins have boosted sentiment. While the stock shows high growth potential and strong operational execution, its elevated valuation and volatility call for caution among short-term investors. Overall, Suzlon Energy stands as a high-beta, high-growth renewable energy company with solid financial turnaround.
This analysis describes recent market and financial data without specific source references, focusing on key trends and metrics as of August 2025.
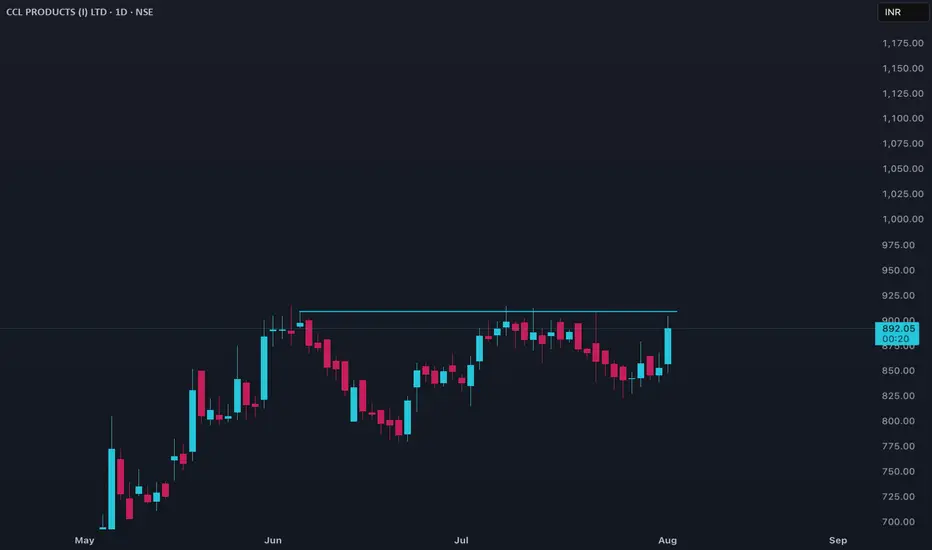
CCL Price Action CCL Products (India) Ltd is currently trading around ₹852 to ₹890 as of early August 2025, with a market capitalization near ₹11,370–₹12,000 crore. The stock has shown strong recent momentum, rising about 37% over six months and around 50% in the past three months, reflecting robust investor confidence.
The company reported consolidated quarterly revenues of approximately ₹835 crore and profits around ₹100 crore, with annual figures showing about ₹3,100 crore in total income and ₹310 crore in net profit, indicating solid operational performance and growth.
Valuation metrics show a price-to-earnings (P/E) ratio near 37 and price-to-book (P/B) ratio above 6, which reflect a premium valuation consistent with the company's growth trajectory and market position in the agri and agri inputs sector.
CCL Products pays a modest dividend with a yield below 1%, while costs related to employee expenses and interest are well managed relative to revenues. Technical signals recently indicate bullish trends, suggesting potential short-term upside, though the stock price remains near its recent highs.
In summary, CCL Products (India) Ltd is exhibiting strong price appreciation backed by solid revenue and profit growth. Its premium valuation highlights investor expectations for continued growth, but potential buyers should consider the high multiples and the cyclicality of the agri inputs sector when assessing near-term risk and reward.
PGHL Price ActionProcter & Gamble Health Ltd (PGHL) is currently trading around ₹5,900 as of early August 2025. The stock has shown decent upward momentum, with a price range around ₹5,700 to ₹6,000 in recent weeks, though it has experienced some volatility within this band.
PGHL has delivered solid returns over the past year, roughly 15%, and longer-term growth is also positive with a multi-year compounded annual growth rate in the double digits. The company maintains a market capitalization close to ₹9,850 crore and offers a dividend yield around 4.4%, providing steady income to shareholders.
Valuation metrics indicate PGHL trades at a premium, justified by its stable revenue growth and presence in the health and pharmaceutical segment. While short-term price fluctuations occur, the overall outlook remains favorable, supported by consistent operational performance and dividend payouts.
In summary, PGHL is a fundamentally sound health sector stock with solid past returns, moderate volatility, and reasonable dividend income, suitable for investors looking for stable growth in the healthcare industry.

Narayana Hrudayalaya Ltd Price ActionNarayana Hrudayalaya Ltd (NH) is trading around ₹1,946 as of August 1, 2025, after hitting a record high of ₹2,370 in late June. The stock has gained over 53% in the past year and about 44% in the last six months, showing strong long-term momentum, though it has corrected nearly 10% over the previous month and 2% in the past week.
Financially, NH remains robust. For the trailing twelve months, revenue stands at approximately ₹5,483 crore and net profit at ₹791 crore, giving a net profit margin of about 14.4%. The company’s market capitalization is close to ₹39,900 crore, making it one of the largest listed hospital operators in India. Key financial ratios include a price-to-earnings (P/E) ratio of about 49.5 and a price-to-book (P/B) ratio nearing 18—both substantially above the sector average, reflecting strong premium and optimistic growth expectations.
Operating performance continues to impress: sales growth for the March quarter was up 15% year-on-year, while margins are stable and efficient. The most recent dividend declared is ₹4.50 per share, maintaining a rising payout trend.
Technically, momentum is slightly negative in the short term, with bearish signals on daily moving averages and a recent drop below key short-term exponential averages, suggesting the possibility of near-term consolidation or mild pullback after a strong prior rally.
In summary, NH remains a growth leader in the hospital and healthcare space, combining strong recent price performance and operational strength. The stock is trading at a substantial premium, justified by consistent growth and sector leadership, but near-term upside may be limited as the price consolidates from recent highs and digest valuation multiples, especially if no further earnings acceleration materializes.

Hester Price ActionAs of July 31, 2025, Hester Biosciences Ltd is trading near ₹1,950 after a recent rebound, though it has experienced a significant decline over the past year, down roughly 37% from its 52-week high above ₹3,250. The stock’s recovery in the last three months has been moderate, with gains of about 9%, and short-term sentiment appears slightly positive given the recent upward movement.
The company’s current price-to-earnings ratio is elevated, close to 58, and the price-to-book ratio is about 4.9, indicating a premium valuation compared to its book value. Hester Biosciences maintains a market capitalization near ₹1,650 crore, placing it among smaller specialty pharma and agri-biotech firms. While the core fundamentals show resilience, the firm recently reported a contraction in sales for the first time in three years, which led to some investor caution.
Technically, Hester Biosciences is recovering from its yearly lows near ₹1,240 and is showing renewed buying interest at current levels, confirmed by an uptick in volumes and momentum. However, given the sharply reduced returns over the past year, sentiment is mixed, and further upside will likely depend on improvement in financial result trends and any breakout above resistance points established during its downtrend.
Overall, the near-term outlook is cautiously constructive with recent stabilization, but investors should monitor for sustained improvements in revenue and earnings to confirm a continued reversal.

Kajaria Ceramics Price ActionKajaria Ceramics is currently trading around ₹1,177, with a market capitalization close to ₹18,750 crore as of the end of July 2025. The stock has shown solid performance in recent months—up about 46% over the last quarter and nearly 19% in the past six months, although it experienced a mild 0.2% dip over the last week. Despite this rally, the stock is valued at a relatively high price-to-earnings (P/E) ratio of around 59 and a price-to-book (P/B) ratio of approximately 6.6, suggesting that it is trading at a premium to its asset base and compared to industry averages.
Profit growth has lagged sales growth, with annual sales increasing modestly but profit growth remaining subdued. The 52-week price range is quite wide, with a high of ₹1,579 and a low of ₹759, reflecting periods of both volatility and strong recoveries.
Analyst outlook remains moderately positive, with one-year price targets averaging near ₹1,259 but estimates ranging widely from ₹731 to ₹1,716. Near-term forecasts mostly see the price consolidating between ₹1,150–₹1,200, with oscillations rather than sustained moves upward or downward.
In summary, Kajaria Ceramics stands out for its recent price momentum and market strength. However, its stretched valuation multiples and only moderate earnings growth highlight the need for careful consideration if expecting further near-term appreciation. The company's premium valuation is reliant on continued improvement in industry demand and profitability. Its financial position and recent run-up make it a stable but potentially fully valued pick at present levels.

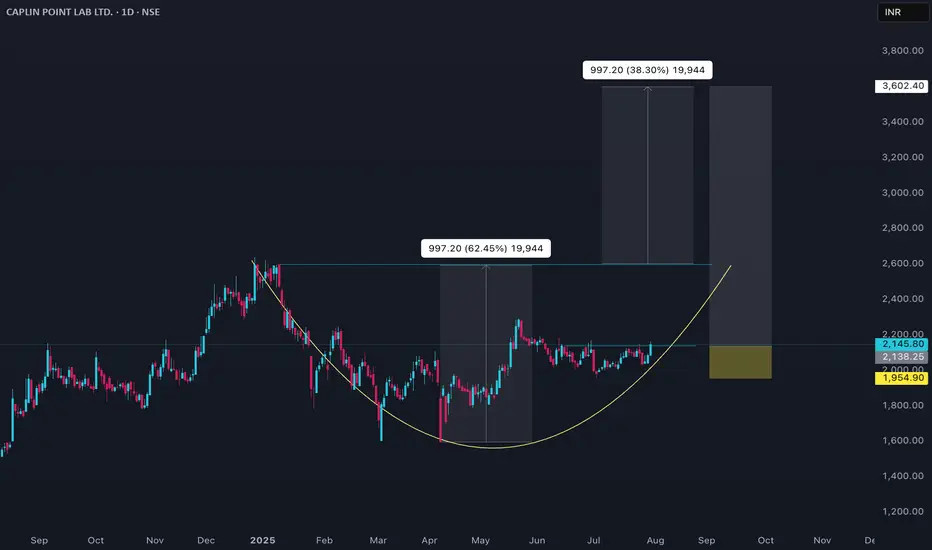
CAPLIPOINT Price ActionAs of July 31, 2025, Caplin Point Laboratories Ltd (CAPLIPOINT) is trading near ₹2,085, showing a mixed but steady performance with some recent price fluctuations around this level. The stock briefly touched intraday highs around ₹2,095 and lows near ₹2,030, maintaining support in the ₹2,030–₹2,055 range. Market capitalization stands broadly near ₹15,590 crore.
Caplin Point benefits from solid fundamentals in the pharmaceutical sector, supported by consistent revenue growth and operational efficiencies. The price-to-earnings ratio sits around 29, while the price-to-book ratio is approximately 5.5, indicating premium valuation relative to book but in line with sector expectations. Dividend yield is low at about 0.15%, reflecting the company’s focus on growth over payout.
Technically, the stock tends to hover above its medium-term moving averages like the 50-day and 200-day SMAs, showing cautious bullish momentum, although near-term volatility remains. Trading volumes are moderate, and the relative strength index is near mid-range levels, suggesting balanced momentum without overbought or oversold extremes.
Overall, Caplin Point Laboratories currently reflects steady fundamentals with a valuation premium typical of its pharma peer group, supported by stable trading ranges and positive medium-term technical signals. The near-term outlook remains cautiously optimistic, with key support near ₹2,030 and potential resistance around ₹2,100–₹2,120.
Jubilant Price ActionAs of July 31, 2025, Jubilant Pharmova Ltd is trading around ₹1,236, showing strong bullish momentum with gains of over 7% in recent sessions. The stock has recovered well from lower levels near ₹1,170 seen earlier, with sustained buyer interest and solid volume support. Technical indicators reveal that the price is above its short-term moving averages, reflecting positive market sentiment.
Fundamentally, Jubilant Pharmova maintains a robust position in the pharmaceutical and life sciences sector with steady revenue growth and improving profitability. The company benefits from a diversified business model and ongoing operational efficiencies, which have helped it sustain earnings growth amid industry challenges. Valuation metrics like the price-to-earnings ratio are moderate, reflecting reasonable investor confidence relative to sector peers.
The near-term outlook for Jubilant Pharmova appears constructive, with potential for further upside provided it holds above key support levels around ₹1,170–₹1,180. Momentum indicators and volume trends support the continuation of the uptrend, although investors should remain cautious of profit-booking risks after sharp rallies.
In summary, Jubilant Pharmova demonstrates solid fundamental strength and positive technical signs, making it an appealing choice for investors seeking exposure to the pharmaceutical sector with a growth orientation.

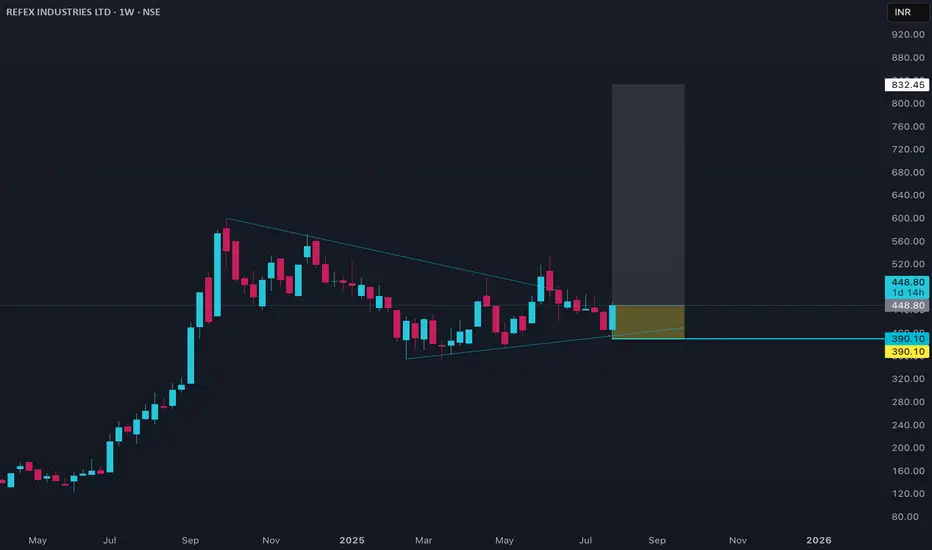
Refex Price ActionAs of July 31, 2025, Refex Industries is trading near ₹448, showing strong bullish momentum with recent gains of about 10% in the last day. The stock has held well above key support levels near ₹400–₹430, indicating solid buyer interest. It has a market capitalization close to ₹5,800 crore.
Fundamentally, Refex Industries carries a price-to-earnings ratio around 33 and a price-to-book ratio above 4, which suggests a premium valuation supported by solid profitability—the return on equity stands near 30%. Technically, the stock trades above short- and medium-term moving averages such as the 5-day, 10-day, and 20-day SMAs, with some resistance expected around ₹450–₹465. Breaking above this level could open further upside potential toward ₹480–₹500. Volume trends in recent sessions confirm the strength of the price move, and the relative strength index (RSI) indicates room for further upside before becoming overbought.
In summary, Refex Industries exhibits strong upward price action backed by healthy fundamentals and volume support. Key levels to watch include support near ₹400–₹430 and resistance at ₹450–₹465, with the near-term outlook remaining constructive on sustained momentum.
GVT&D Price ActionGE Vernova T&D India Ltd (GVT&D) has experienced a significant surge, with its stock price around ₹2,597 as of July 30, 2025. Over the past year, the stock delivered an impressive return of about 61%. Over three years, the returns are even more dramatic, exceeding 2,100%. However, the broader financials reveal a company with mixed metrics.
The stock’s high price-to-earnings (P/E) ratio and price-to-book value suggest it is currently overvalued compared to peers and the market average. Analyst forecasts for the next 12 months range between ₹2,005 and ₹3,000, with a consensus target near ₹2,450. Most analysts continue to view the stock favorably and assign it a “strong buy” outlook, though with caution about its rich valuation.
GVT&D’s profitability stands out; it has shown robust growth in both operating profit and earnings per share recently. Return on equity has climbed above 40% in the past year, indicating efficiency in generating returns for shareholders. The company is also almost debt-free and maintains stable cash flows, which reduces financial risk.
Volatility for GVT&D is slightly higher than the market average, but price movement has been relatively stable, with no extreme swings in recent months. Still, investors should be aware that such high past returns may not be sustainable, especially with modest sales growth and valuation multiples well above industry norms.
In summary, GVT&D remains a high-performing and highly-valued stock in the Indian power equipment sector, with strong recent momentum, robust profitability, and a largely positive market outlook—albeit with potential risk due to elevated pricing and slower sales growth compared to its historic surge.

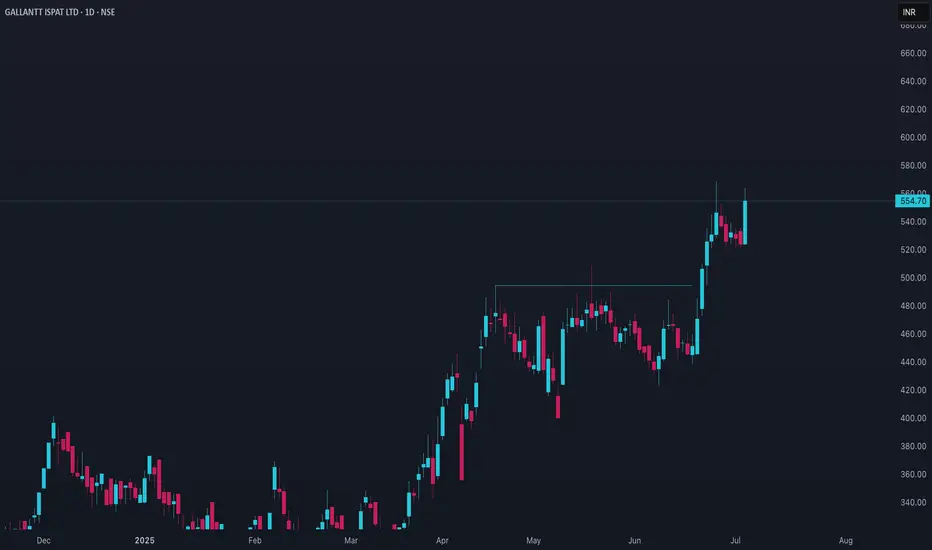
Gallantt price ActionGallantt Ispat Ltd has shown notable price momentum in 2025, with the stock trading in the ₹524–₹555 range and reaching an all-time high of ₹568.65 in late June. Over the past year, the stock has delivered strong returns, nearly doubling from its 52-week low. The last three and six months have seen particularly robust gains, though the past month has included some profit booking and mild declines.
On the financial front, Gallantt Ispat reported a full-year net income of over ₹400 crore for FY25, almost doubling from the previous year. Revenue growth has been steady, but the latest quarter saw a sequential decline in profit after tax, reflecting higher expenses and some variability in operational efficiency. The company’s earnings per share for the year also improved significantly.
Recent quarters have seen an increase in non-operating income, which has contributed to profit growth but raises questions about the sustainability of these gains if operating performance does not keep pace. The company is trading at a high valuation relative to its book value, and its return on equity over the last three years has been moderate.
Technically, the stock has found support near ₹520 and faces resistance at its recent high. Sustained movement above this level could lead to a fresh breakout, while a drop below support may prompt further consolidation. Overall, Gallantt Ispat remains in a positive trend but is subject to volatility and the need for continued operational improvement to justify its elevated valuation.
# ADVENZYMES Price Analysis (July 2025)Current Price and Trading Pattern
Advanced Enzyme Technologies Ltd (ADVENZYMES) is trading near ₹335 in late July 2025. The price range for recent sessions is ₹331–₹346, with daily swings generally limited to 1–2%. Trading volumes are average for its segment, indicating steady, if unspectacular, investor interest. The 52-week price band extends from a low of ₹258 to a high of almost ₹571, showing that the stock has experienced significant volatility and a substantial correction from last year’s peak.
## Performance Overview
- **1-Month:** The stock has been consolidating, exhibiting minimal directional bias and relatively stable prices.
- **6-Month:** There has been a notable decline, significantly underperforming its sector benchmarks. The price remains below important moving averages, indicating sustained technical weakness.
- **12-Month:** ADVENZYMES has declined approximately 30% over the past year, in marked contrast to the modest gains seen in broader equity indices.
## Financials and Valuation
- **Market Capitalization:** Approximately ₹3,750–3,800 crore.
- **Earnings per Share (TTM):** About ₹11.7.
- **P/E Ratio:** Nearly 28, somewhat below the specialty chemicals sector average, likely reflecting recent challenges in growth and profitability.
- **P/B Ratio:** Close to 2.6.
- **Dividend Yield:** Roughly 1.5–1.6%, with an interim dividend of ₹4 per share recently declared.
## Business Health
ADVENZYMES is a leading manufacturer of enzymes and probiotics with global clients across healthcare, food processing, and specialty industrial markets. The latest financial results show minor revenue growth but declining net profits and operating margins, primarily due to increased costs and a shift in the product mix. Earnings per share have reached multi-quarter lows, prompting concern about operational efficiency and cost management.
## Shareholder Structure
- **Promoters:** Hold about 43% of shares.
- **Institutional Investors (FII/DII):** Approximately 26%.
- **Retail/Public:** The remaining shares.
## Risk and Volatility
- The stock is roughly three times as volatile as major market indices, making it a high-beta investment.
- Liquidity is sufficient for the usual investment sizes, but price performance has lagged sector peers over the past year.
## Technical and Sector Comparison
ADVENZYMES is trading below its major short-, medium-, and long-term moving averages, highlighting a bearish trend. In comparison, the specialty chemicals sector has had mild positive momentum, which makes ADVENZYMES a notable underperformer in its peer group.
## Outlook
The company’s fundamentals remain sound from a market positioning perspective, bolstered by a track record of dividend payment and global reach. However, the recent deterioration in revenue growth, margins, and earnings clouds the short-term outlook. The technical setup stays negative, and further consolidation or downside is possible unless there is clear operational improvement or sector-wide momentum. Investors should keep a close watch on margin trends, revenue acceleration, and cost control initiatives as signals for recovery.
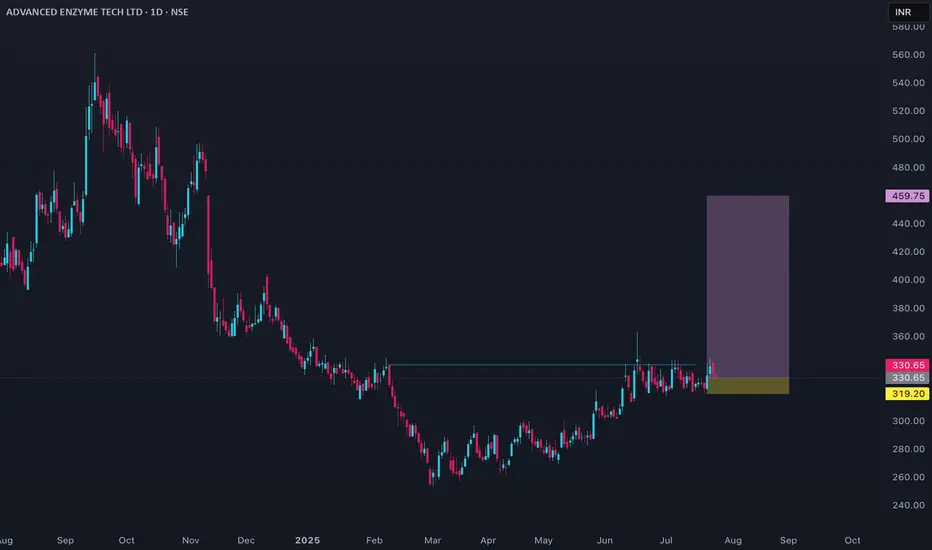
bullish trade one more day stable trendline so i am bullish now but rember 1 monday is main day and close trendline not cross friday day low

North East is booming and transport of cement is not easyThese are locally made ingredients
They cant be moved from far off places
Transportation increases cost
I feel that this stock can be in a big bull run into this decade

Syngene International Price Action## Current Price and Trend Overview
- The stock is currently trading near ₹657, having pulled back considerably from its 52-week high close to ₹961, but still above the 52-week low around ₹600.
- Price movement has been mixed, with recent gains of about 2% over the last week but a decline of nearly 10% in the past three months. Over six months, the stock is down close to 20%. The longer-term gain (three-year basis) is about 5%.
- The stock remains within a broad horizontal range, with prices fluctuating between about ₹600 and ₹735 in recent months. Price volatility is moderate.
## Technical and Market Structure
- A short-term bounce occurred from a May low, but overall momentum remains sideways. Both short- and long-term moving averages are generally positive, offering some technical support.
- Key support levels are seen at ₹645–₹650, with stronger support near ₹600. Immediate resistance is around ₹670–₹680; a break above could indicate further upward momentum.
## Valuation and Financial Perspective
- The price-to-earnings (P/E) ratio is in the mid-50s, relatively high for the sector, signaling a premium valuation.
- Price-to-book (P/B) value is above 5, suggesting the company trades at more than five times its book value.
- Market capitalization is about ₹26,500 crore, making Syngene a significant but not leading player in its industry.
- Return on equity is modest at around 12%, and dividend payout remains low relative to profits.
## Recent Performance Factors
- Promoter holding is stable, which is generally regarded as a sign of confidence.
- The latest quarterly earnings showed a minor upside surprise, with earnings per share coming slightly above market expectations.
- Revenue is expected to show a steady uptrend in the coming quarters, but overall growth rates have moderated compared to earlier years.
## Outlook and Sentiment
- The prevailing sentiment is cautious, with the stock recently upgraded by some analysts from “Hold” to “Buy Candidate,” based largely on improved moving average signals and a rare technical “Golden Star” event that often precedes positive moves.
- Option chain analysis indicates a wide range, reflecting indecision among market participants.
- Analysts’ 12-month price targets generally center around ₹712, with a bullish scenario up to ₹825 and a downside floor near ₹570.
## Summary
- Syngene International’s share price is consolidating with no clear breakout, but several technical and fundamental factors are turning slightly positive.
- Upside potential exists if key resistance levels are crossed, while failure to hold current support could lead to further downside.
- The stock remains in focus for longer-term investors looking for stable growth in the contract research and biopharma segment, though near-term trading is likely to remain range-bound unless a new catalyst emerges.

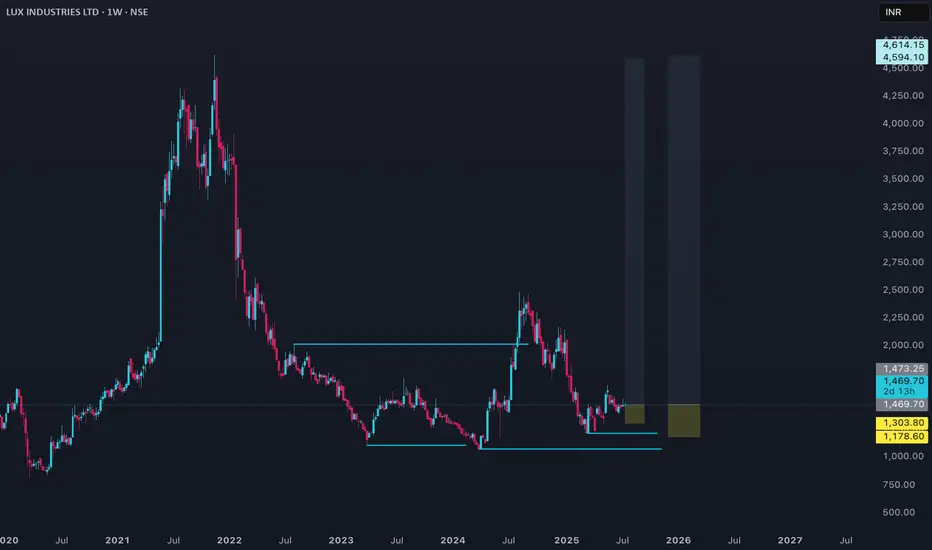
LUXIND Price Analysis## Current Price & Recent Performance
- The latest share price is around ₹1,468.
- Over the past year, the stock is down nearly 25%, showing underperformance.
- In the last five years, returns are positive but modest, with periods of pronounced volatility.
- The 52-week range spans from a low near ₹1,211 to a high close to ₹2,493, highlighting large swings in price.
- Short-term momentum remains soft, with one-month and three-month returns relatively flat.
## Valuation & Financial Metrics
- LUXIND is currently valued at a price-to-earnings ratio close to 27, which is above broader market averages but not extreme for its sector.
- The price-to-book ratio sits at about 2.5, marking a premium to historical levels for textile manufacturers.
- Debt is low, and the latest dividend yield is minimal, suggesting the company retains most profits for growth.
- Price-to-sales and enterprise value-to-EBITDA ratios point to average to modestly expensive relative valuation.
- Discounted cash flow analysis and fair value models indicate the stock is somewhat overvalued at current prices.
## Growth, Profitability & Fundamentals
- Revenue growth has averaged approximately 10% annually in recent years with some acceleration recently observed.
- Earnings trends have been inconsistent, with a decline over the past five years but a robust rebound in the latest reporting periods.
- Net profit margins remain steady, roughly 6%, and operating expense control is demonstrated by low interest and employee cost ratios.
- Return on equity is below 10%, which is modest and signals room for efficiency improvement.
## Market Sentiment & Analyst View
- Most short- and medium-term forecasts suggest neutral to mildly positive technical momentum, with occasional buy signals from technical models.
- Longer-term analyst price targets vary, but consensus expects limited upside in the near future given current valuation levels.
- Projected earnings per share and revenue growth remain solid, with the company expected to improve performance metrics over the next few years.
- Intrinsic value estimates based on fundamental analysis suggest the stock trades above its calculated fair value, raising some caution for new investors.
## Key Takeaways
- LUXIND stands out for disciplined cost management and stable margins, but faces pressure from subdued industry growth and relatively high valuation metrics.
- While the business remains fundamentally sound and growth is projected to continue, the stock may be fully priced at current levels.
- Short-term price action could stay range-bound unless there is a significant change in sector sentiment or a positive surprise in earnings.
- Investors may consider waiting for a more attractive entry point if focusing on value, while growth-oriented investors might monitor for signals of a sustained earnings recovery.
NDRAUTO Price Action#### Current Price and Performance
- **NDR Auto Components** is trading near ₹1,050–₹1,100 as of July 9, 2025, after a recent pullback from its all-time high of ₹1,191 set earlier in the month.
- The stock has delivered an exceptional one-year return of over 135%, with a three-month gain of more than 70%.
- Recent price action shows high volatility, with swings of 7–11% on certain days and a short-term correction of about 8% in the past week.
- Over the past month, the stock is down about 2–3%, reflecting some profit booking after a rapid rally.
#### Trend and Technical Overview
- The medium-term trend remains positive, supported by robust earnings growth and strong momentum.
- Technical indicators suggest the stock is consolidating after reaching overbought levels, with support seen near ₹1,000 and resistance around ₹1,150.
- The stock’s volatility is elevated, and its beta is above 2, indicating higher sensitivity to market movements.
#### Valuation and Financial Metrics
- NDRAUTO trades at a premium, with a price-to-book ratio above 8 and a price-to-earnings multiple reflecting high growth expectations.
- The company’s market capitalization is approximately ₹2,500 crore.
- Return on equity (ROE) is strong, around 19–23%, and return on capital employed (ROCE) is above 20%.
- Net profit for FY25 rose nearly 38% year-on-year to over ₹53 crore, with revenue up 18% to about ₹713 crore.
- Operating margins have improved to nearly 11%, and earnings per share (EPS) for the year is above ₹22.
- The dividend yield is modest at 0.26%, with a payout ratio around 12%.
#### Market Sentiment and Outlook
- Market sentiment remains positive, with the company consistently reporting record profits and sales.
- Analysts highlight the company’s efficient operations, strong order book, and improving profitability.
- The recent correction is seen as a healthy consolidation after a sharp rally, though further volatility is likely in the short term.
- The long-term outlook is favorable, supported by ongoing growth in the auto components sector and the company’s expanding market share.
#### Summary
NDRAUTO has delivered outstanding returns over the past year, driven by robust financial performance and strong sector momentum. The stock is currently consolidating after hitting record highs and remains highly volatile. While valuations are elevated, the company’s growth trajectory and operational efficiency support a positive outlook for medium- to long-term investors. Short-term caution is warranted due to recent volatility and profit booking.

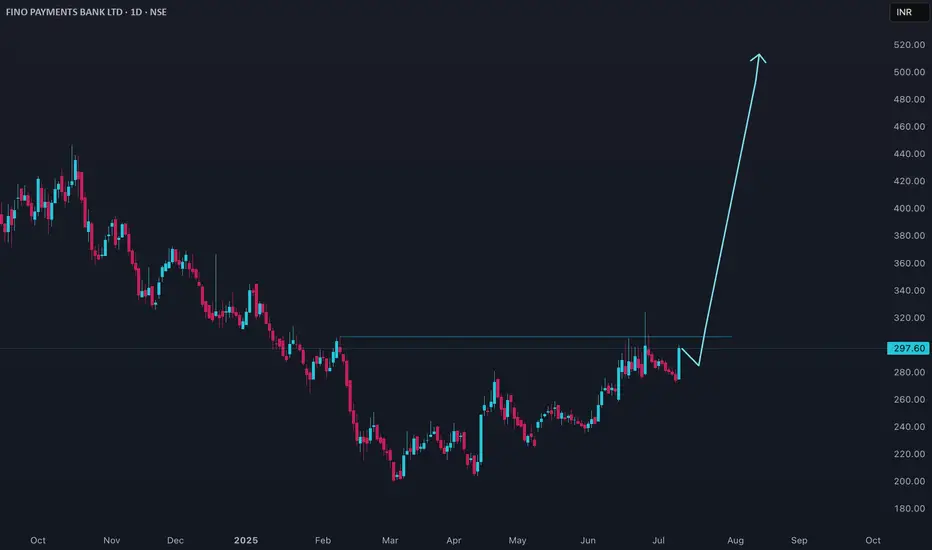
FINOPB Price Action#### Current Price and Performance
- **Fino Payments Bank (FINOPB)** is trading around ₹274–₹278 as of July 8–9, 2025.
- The stock has seen a recent high of ₹300 and a low of ₹274.95 in the latest trading sessions.
- Over the past month, the price has declined from the ₹286–₹290 range, with a notable drop from its 52-week high of ₹467.
- The 52-week low stands at ₹200, highlighting significant volatility in the past year.
#### Trend and Technical Overview
- The short-term trend is **negative**, with the stock slipping about 4% over the past week and nearly 7% in the last month.
- Volumes are robust, with daily trading often exceeding 1.5 million shares, indicating high market participation and speculative interest.
- The stock is currently trading closer to its lower circuit limit than its upper circuit, reflecting bearish sentiment.
#### Valuation and Financial Metrics
- FINOPB is priced at a **low price-to-earnings (P/E) and price-to-book (P/B) ratio**, though exact values are not meaningful due to inconsistent profitability.
- The trailing twelve-month (TTM) earnings per share (EPS) is positive and has grown 7.3% year-on-year.
- The market capitalization is around ₹2,477 crore.
- Dividend yield is 0%, and the company has not announced any dividends recently.
#### Market Sentiment and Outlook
- Sentiment is cautious, with the stock underperforming the sector and broader indices in 2025.
- The price action reflects ongoing concerns about growth visibility and profitability, despite some improvement in recent quarters.
- The stock is viewed as a high-risk, high-volatility play, with traders dominating activity rather than long-term investors.
#### Summary
FINOPB is in a corrective phase, trading near the lower end of its yearly range after a sharp decline from its highs. While trading volumes are high and EPS has shown some growth, the lack of dividends and inconsistent profitability weigh on sentiment. Investors should remain cautious, as the stock’s volatility and weak trend suggest further downside risk unless there is a clear improvement in fundamentals.
### JYOTISTRUC Price Analysis#### Current Price and Performance
- Jyoti Structures Ltd is trading at approximately **₹17.59** as of July 8, 2025.
- The stock has experienced high volatility in recent weeks, with daily swings of 2–5% being common.
- Over the past month, the price has generally trended downward from the ₹19–₹20 range, with multiple sessions closing in the red.
- The 52-week high is near ₹22, and the low is just above ₹15, indicating a wide trading range and active speculative interest.
#### Trend and Technical Overview
- The short-term trend is **negative**, with the stock declining about 10% over the last two weeks.
- Daily volumes remain elevated, suggesting ongoing trader participation but also reflecting uncertainty and rapid profit booking.
- The stock has failed to sustain above key resistance levels near ₹18.50–₹19.00, and support is now seen around ₹17.00.
#### Valuation and Financial Metrics
- Jyoti Structures is a small-cap company in the capital goods sector, and its financials remain under pressure, with limited earnings visibility.
- The company has a history of restructuring and remains sensitive to sector news, which adds to price volatility.
- Valuation multiples are not meaningful at this stage due to inconsistent profitability.
#### Market Sentiment and Outlook
- Sentiment is cautious, with traders focusing on short-term momentum rather than long-term fundamentals.
- The stock’s recent decline and inability to hold higher levels suggest that risk remains elevated.
- Any sustained recovery will likely depend on improvement in financial results or sector-specific positive developments.
#### Summary
JYOTISTRUC is currently in a corrective phase, marked by high volatility and weak short-term momentum. While trading interest is strong, the lack of earnings clarity and recent price declines point to ongoing risk. Investors should approach with caution, focusing on technical support levels and monitoring for signs of fundamental improvement.
