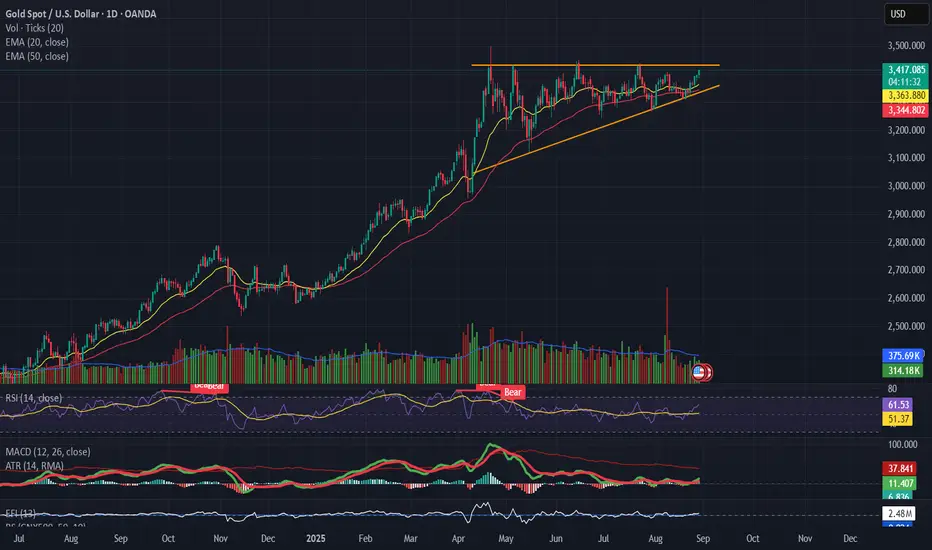
GOLD(XAUUSD) Forming a pennant / ascending triangle 📌 Gold (XAUUSD)
Forming a pennant / ascending triangle with strong resistance near $3,390 – 3,400.
Volume is declining, suggesting indecision.
RSI holding above 50 but not powering higher → momentum is slowing.
MACD flatlining, no fresh bullish impulse yet.
👉 Breakout above $3,400 needed for continuation. Breakdown below $3,340 risks correction.
Pennantbreakout
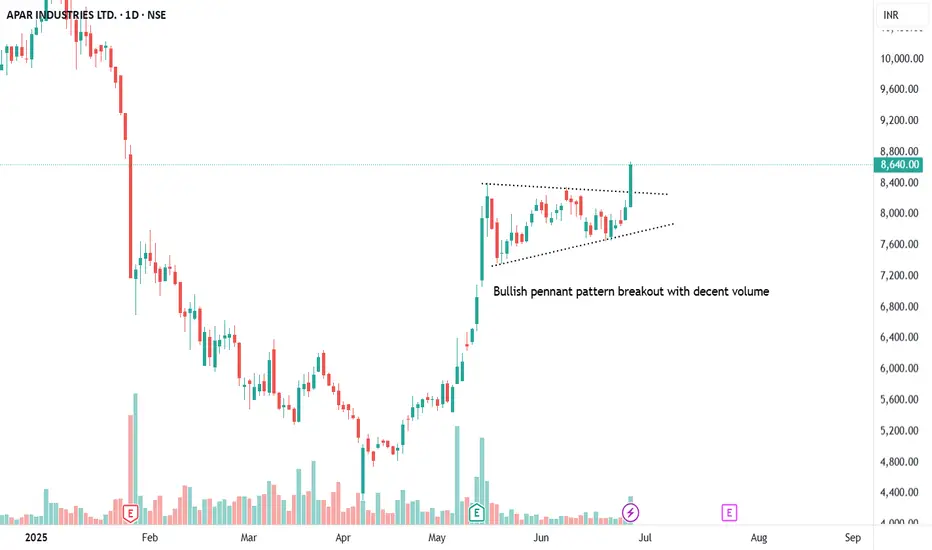
APARINDS - Bullish Pennant patternAll details are given on chart for educational purpose only. If you like the analyses please do share it with your friends, like and follow me for more such interesting charts.
Disc - Am not a SEBI registered analyst. Please do your own analyses before taking position. Details provided on chart is only for educational purposes and not a trading recommendation
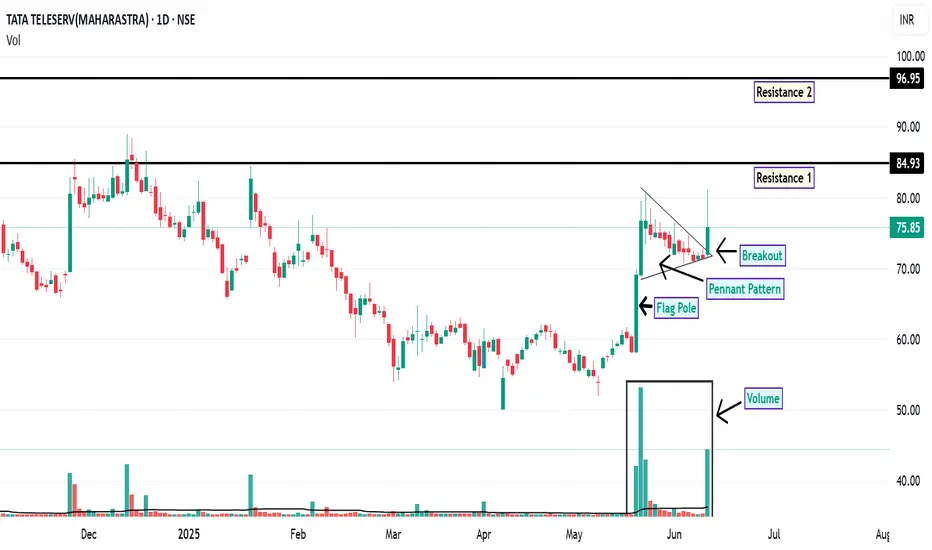
TTML: Pennant Breakout Signals Potential Upside
On the daily chart, TTML has recently exhibited a breakout from a pennant formation , a pattern often associated with potential continuation of the prevailing trend. This breakout is accompanied by a notable increase in trading volume, which may indicate growing market interest and participation.
Additionally, the price action has shown support at the 200-day EMA, a widely observed long-term trend indicator. This confluence of technical signals may suggest a strengthening bullish sentiment.
From a momentum perspective, both the RSI and MACD indicators are currently positioned in bullish territory on both the daily and weekly timeframes. This alignment across multiple timeframes can be interpreted as a sign of potential trend continuation.
Looking ahead, the price may revisit the ₹75 level, which could act as a demand zone. Should the stock manage to close and sustain above ₹76.40 , the next potential resistance levels to monitor are around ₹84.93 and ₹96.95 . For risk management, a suggested stop-loss level could be considered below ₹62 , based on recent support structures.
Disclaimer: This analysis is intended solely for informational and educational purposes. It does not constitute investment advice or a recommendation to buy or sell any financial instrument. Market participants are encouraged to conduct their own research or consult with a licensed financial advisor before making any investment decisions.
SBICARD: Monthly Pennant Breakout - How High Can It Fly?NSE:SBICARD
The stock has given a pennant pattern breakout on monthly chart with good volume along with second month on consecutive buying
This month's closing would be interesting to watch as it'd confirm the follow on move
916.95 / 946 / 1149 will act as strong resistance levels especially 1149 which is around it's ATH level a monthly close above it will fuel the further rally.
Since it's ATH in September 2021 stock has been in a downtrend but seems like things are about to change for good
SBI Cards & Payment Services is India's second-largest credit card issuer and a subsidiary of SBI.
Market Position :
SBI Cards is a leader in the credit card industry, holding an 18.5% market share in card-in-force and a 15.7% share in spending. You'll find them actively expanding into Tier-2 and Tier-3 cities to tap into new markets. Plus, partnerships with brands like Apple and Singapore Airlines help them attract premium customers.
Recent Financials (Q3 FY25):
Revenue: ₹4,767 crore (up 1% YoY).
Net Profit: ₹383 crore (down 30% YoY).
Net Interest Income (NII): ₹3,790 crore (down 3.5% YoY).
Asset Quality: Gross NPA at 3.24%, Net NPA at 1.18%.
9-Month Performance (9MFY25):
Revenue: ₹14,300 crore (up ~2% YoY).
Net Profit: ₹1,200 crore (down ~25% YoY).
Where is SBI Cards Headed?
Management is optimistic, projecting annual revenue growth of 10%-15% over the next two years. The plan involves:
Tapping into smaller cities to bring in new customers.
Boosting the digital experience for seamless customer interactions.
Launching exciting co-branded cards aimed at high-value users.
And don't forget, potential RBI rate cuts in FY26 could lower borrowing costs and boost the bottom line.

RAMCOCEM - Breakout in Weekly Timeframe and Monthly TimeframeThe price has been forming a pennant pattern since 2020, and it broke out last week. This setup could be considered for swing trading.

Gold: “Bullish Pennant” lures XAUUSD buyers on US NFP DayGold prices are starting to rise, reducing weekly losses on the first positive day in three. This reflects a market shift toward the traditional safe-haven asset as investors remain cautious ahead of the US employment report for September, particularly the Nonfarm Payrolls (NFP) data.
Buyers remain in control
Even though gold has lacked momentum over the past two weeks, it is holding above the late September breakout from a four-month trend line resistance, which now acts as support. The XAUUSD also forms a “Bullish Pennant” pattern, attracting buyers. The rising RSI (14) indicates strength, but the sluggish MACD and pre-NFP jitters are holding back immediate movement in the precious metal.
Key technical levels to watch
Gold's immediate focus is on the bullish pennant's resistance line, currently near $2,665, which poses a challenge for intraday buyers. Above that, the recent all-time high of $2,685 and the $2,700 mark will attract bulls. If gold trades successfully above $2,700, it could target around $2,735, which is the theoretical goal of the pennant.
On the downside, support levels are set at $2,638 and $2,635, thanks to the pennant's bottom line and a long-term resistance-turned-support. Further down, an upward-sloping support line from early August and the 200-SMA will provide additional support for XAUUSD near $2,580 and $2,560, respectively.
Gold bulls can overlook pullbacks
Although US employment data may pose challenges for gold buyers, several strong support levels make it tough for sellers to regain control. This suggests that bulls can stay confident, even if prices experience a pullback—unless there’s a significant drop below the 200-SMA.

BAJAJ FINSERV ATH BREAKOUTBajaj Finserv has been consolidating since 2021 and had formed a bullish pennant pattern , which it has already given breakout of , If The stock gives strong weekly closing above all time high levels with good volumes it can bring further momentum in stock
Do lookout for weekly closing above 1933 levels for possible target of ~ 2800 on positional basis

Technical Analysis for HCCChart Pattern: Bullish Pennant
Breakout: Resistance with good volume
Entry Strategy: Buy at Current Market Price (CMP) ₹48
Stop Loss (SL): ₹37 for risk management
Target: ₹98
Trade Duration: Swing Trade for 3-6 months
#HCC #TechnicalAnalysis #BullishPennant #BreakoutTrading #StockMarket #SwingTrade #TradingStrategy #VolumeAnalysis

Cup and Handle Pattern in Finolex Industries on Weekly ChartFinolex Industries has making good chart pattern on Weekly time frame.
Buy (Half qty) at 235
Buy (Full qty) at 250
SL at 200
Target 1: 280
Target 2: 305
Target 3: 350

Adani Energy - Flag / Penant BreakoutAdani Energy has been under recovery mode after sharp fall. The stock has shown the flag / pennant breakout on daily and weekly charts. Buy this stock @ 1140 with SL @ 1000 and TGT @ 1450

GARFIBRES Bull Flag PatternGARFIBRES attempting retest from bull flag pattern breakout on 1D timeframe. Enter on bullish confirmation. Follow strict stop loss rules as market has turned very volatile.

KTKBANK / KARNATAKA BANK - Previous All Time High BreakoutKTKBANK
1) Time Frame - Weekly.
2) Previous Life Time High was 194.60 in the year 2008. It was broken on July 2023 & Sustained / Consolidated for 6 months above the price 194.60 and marked a breakout with strong bullish candle and closed at All Time High currently.
3) The next resistance would be in between the price 300 to 314.
4) Recommendation - Strong Buy

BAJAJ FINANCE | LOOKING GOOD FOR TARGET OF 8000+Bajaj Finance was trading in pennant pattern and gave a breakout. Looking a good buy around 7700 for the targets of 8000 & 8150.
To motivate us, Please like the idea If you agree with the analysis.
Happy Trading!
InvestPro India

HFCL - Breakout from pennant - Continuation b.o.The analysis is done on Weekly TF hence price may take few weeks to few months in order to reach the targets. Trade setup is explained in image itself. This is a continuation breakout chart.
When price comes out of such narrow zone on higher timeframe, chances of such breakouts being successful increases manifold.
The above analysis is purely for educational purpose. Traders must do their own study & follow risk management before entering into any trade
Checkout my other ideas to understand how one can earn from stock markets with simple trade setups. Feel Free to comment below this or connect with me for any query or suggestion regarding this stock or Price Action Analysis.

HFCL Swing Trade 📈 Trade Analysis: Swing Trade Setup
🔍 Chart Pattern: Identified a promising pennant chart pattern, suggesting potential breakout.
📊 Volume Confirmation: Breakout supported by significant volume, indicating strong market interest.
⚖️ Risk to Reward: Favorable risk-to-reward ratio, providing a good potential for profit compared to the risk taken.
🔄 Trade Duration: Planning for a 6-month swing trade to capture potential long-term gains.
🛑 Risk Management: Implementing a trail stop-loss strategy. Will move the stop-loss to breakeven once the stock reaches the 100 Rupees level.
📢 Disclaimer: Remember, the market involves risks, and this is not financial advice. Always do thorough research and consider consulting with a financial advisor. Trade responsibly.

SOMANYCERA - Huge potential. Bullish pennant + Huge Cup & handleThe analysis is done on Weekly TF hence price may take few weeks to few months in order to reach the targets. Trade setup is explained in image itself. This is a continuation breakout chart.
The above analysis is purely for educational purpose. Traders must do their own study & follow risk management before entering into any trade
Checkout my other ideas to understand how one can earn from stock markets with simple trade setups. Feel Free to comment below this or connect with me for any query or suggestion regarding this stock or Price Action Analysis.

Bullish Pennant and Double Bottom BreakoutWeekly chart analysis of NSE:LATENTVIEW
A bullish pennant has been seen on weekly chart pattern. In technical analysis that usually forms after a strong price movement upward, followed by a brief consolidation period.
A double bottom is a bullish chart pattern observed in technical analysis. It usually occurs after a downtrend and signifies a potential reversal in the price of an asset. The pattern resembles the letter "W" and consists of two troughs at approximately the same price level, separated by a peak (the pattern's central point), the same has been marked on chart .
Key Points:
Continuation Pattern: The bullish pennant is generally considered a continuation pattern.
Traders interpret its formation as a temporary pause or consolidation within the broader upward trend before the price is likely to continue moving higher.
Breakout: The pattern is confirmed when the price breaks above the upper trendline of the pennant, accompanied by an increase in volume. This breakout signals a potential resumption of the prior uptrend.
PLEASE NOTE THAT:
This chart analysis is only for reference purpose.
This is not buying or selling recommendations.
I am not SEBI registered.
Please consult your financial advisor before taking any trade

RBLBANK,1D pennant flag BO and retestNSE:RBLBANK formed Flag and pole or pennant flag and gave breakout and did retest.
Entry :248.5
Target : 270
SL : 235
RR : 1.6

SUZLON: Swing Breakout IdeaSUZLON again took support this week over the rising trendline which it has been respecting from over 7 months since it began its wonderful breakout. The descending resistance line was also broken out today. Pennant formation. The swing breakout also sent price above 10 and 20 EMA and a crossover was avoided. RSI again crossed over 60 and yesterday was 5% upper circuit. It might continue its upward journey if it crosses the 27 high.

TRB under Bearish Pennant Pattern#TRB 1hr. Chart Analysis
After Bullish Growth and Manupulation by Whalers in TRB Since 25th to 28th Sept. from $25 to $67, just 2.5x in just 3-days, it's HYIP is finished yet and moving towards downtrend again as a Correction chart into Bearish #Pennant Pattern.
It's Very big chances to break-out this pattern into next 24-hrs., minimum upto $38-40 and as per pattern maximum upto $28-30 also.
Lets see, where it goes and how manupulators watching it again.
Always #DYOR before investing into those type of highly Volatile #Crypto projects and Trade wisely by using of #StopLoss. Its just a #NFA.
Also,
Must Like, Follow, Comment & Share our Analysisi too.

Tata Steel - Long Trade - Kursi Ki Peti Baand LijiyeNSE:TATASTEEL on weekly charts has a commanding positional advantage. Since commodities are news and dollar driven, some little knee jerk reactions can emerge during the journey, and perhaps by the end of September or early October, NSE:TATASTEEL can become a brilliant trade to play with. The positional view is also displayed on the chart, but it will need patience to maintain your current positions.
Pattern Formed - Flagpole & Bullish Pennant
Positional SL - Low point of the pennant pattern
Immediate SL for long trade - Top of the pennant breakout line or say 115 on WCB
Conclusion - Breakout of the pattern and retest done. Should resume upwards journey
Let's see how the story develops. Best wishes!
Disclaimer -
- My thoughts are shared here. This is both for my own records and for keeping track of what I see on charts.
- If you are referring to this, please keep in mind that it is only for educational and research purposes.
- Past performance is no guarantee of future results.
- You must accept responsibility for any decision you make. DO NOT TAKE THIS AS AN INVESTMENT RECOMMENDATION.
- It's your hard-earned cash. Trade / Invest wisely, keeping in mind your trading style, goals and objectives, time horizon, and risk tolerance.
- Before investing, conduct your own research and consult with a financial advisor.
TIA!

Poddar Pigments forming a 3 week tight doji patternPoddar Pigments after a good time correction is going into bullish zone again, the formation of 3 week tight doji pattern near the trend line breakout zone is a good sign of demand this scrip is getting. Looks like this pigments scrip will be giving a breakout soon. Stop loss should be placed @ 290 here.
*DISCLAIMER*
This analysis is only for educational purpose. I am not a SEBI Registered Analyst/Advisor. Please consult your financial advisor before taking any position and please use a Stop Loss for any Investments/Trading Positions. It is your hard earned money so give risk management your highest attention. Do take this disclaimer seriously.

Prakash Industries triangle patternPrakash Industries triangle pattern formation on daily TF as well as on weekly TF. Here I'm posting only the daily TF chart. Soon to be breakout share, keep in watchlist. Breakout above 75 and stop loss will be around 50. Trade for 1:2 Target.
