PERSISTENT - STWP Equity SnapshotSTWP Equity Snapshot – PERSISTENT (Educational | Chart-Based Interpretation)
📌 Intraday Reference Levels (Structure-based)
Reference Price Zone: 6,542.5
Risk Reference (Structure Invalidation): 5,991.2
Observed Upside Zones: 7,204.06 → 7,645.09
📌 Swing Reference Levels (Hybrid Model | 2–5 days | Observational)
Reference Price Zone: 6,542.5
Risk Reference (Structural Breakdown): 5,715.56
Higher Range Projection (If structure resolves upward): 8,196.39 → 9,436.8
Key Levels – Daily TF
Support: 6,298 | 6,084 | 5,962
Resistance: 6,635 | 6,757 | 6,972
🔍 STWP Market Read
Persistent Systems Ltd is currently positioned in a broad consolidation range, following a strong prior up-move. Price is oscillating between well-defined demand and supply zones, indicating balance between buyers and sellers rather than directional dominance.
Momentum indicators remain constructive, with RSI near 60.47, suggesting underlying strength without immediate exhaustion. Volume expansion on recent sessions points toward active participation, though the absence of sustained follow-through beyond resistance keeps the structure range-bound for now. Until price decisively exits this range, patience and structure awareness remain key.
📊 Chart Structure & Indicator Summary
Structure: Range formation after prior impulse
Trend: Neutral to sideways
Momentum: Moderate, stabilising
RSI: Healthy zone — supportive but not stretched
MACD & ADX: Mixed, indicating lack of strong directional trend
Volume: Elevated participation, monitoring for expansion
📈 Final Outlook (Condition-Based)
Momentum: Moderate
Trend: Range
Risk: High (range extremes & volatility)
Volume: High, active participation
💡 STWP Learning Note
Range phases are periods of market digestion. Clarity emerges only after structure resolves — until then, discipline and risk control matter more than anticipation.
⚠️ Disclaimer:
This is an educational market interpretation based on chart structure and publicly available data. It is not a recommendation, advice, or solicitation. Equity markets involve risk. Please consult a SEBI-registered financial advisor before taking any investment or trading decision.
📘 STWP Approach:
Observe momentum. Respect risk. Let structure guide decisions.
💬 Did this add value?
🔼 Boost to support structured learning
✍️ Share your views or questions in the comments
🔁 Forward to traders who value disciplined analysis
👉 Follow for clean, probability-driven STWP insights
🚀 Stay Calm. Stay Clean. Trade With Patience.
Trade Smart | Learn Zones | Be Self-Reliant 📊
PERSISTENT

Persistent entry above 6800 closing base Persistent closing above 6800 2days then enter for fresh buying and tgt is 8700 positional
after create a position if close below 6800 you must be exit,

Persistent Technical Analysis#Persistent Systems Limited - Technical Analysis
Chart Overview
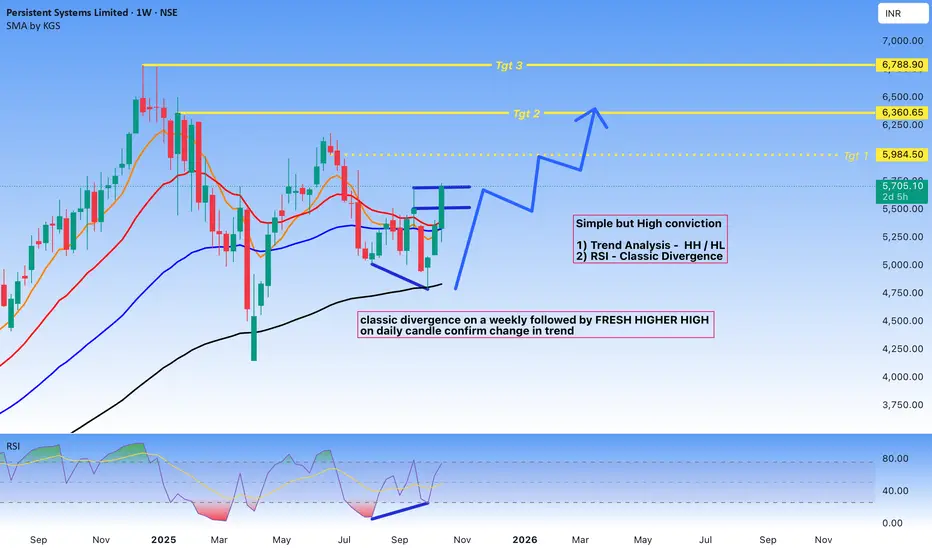
**Timeframe:** Weekly (1W)
**Current Price:** 5,708.20
Technical Setup
Trend Analysis
The chart displays a compelling technical setup based on higher highs and higher lows pattern analysis. After a significant correction from previous highs, the stock has formed a strong base and is showing signs of trend reversal.
Key Observations
RSI Classic Divergence
The Relative Strength Index is displaying a classic bullish divergence pattern. While price action formed lower lows during the correction phase, the RSI formed higher lows, indicating weakening bearish momentum and potential trend reversal. This divergence has been confirmed on the weekly timeframe, adding significant weight to the bullish case.
Fresh Higher High Confirmation:
Following the divergence, price action has broken above the previous swing high on the daily candle, confirming a potential change in trend structure. This break represents a shift from the previous pattern of lower highs and suggests renewed bullish momentum.
Price Targets
The analysis identifies three potential target zones:
- **Target 1:** 5,984.50 (Immediate resistance)
- **Target 2:** 6,360.65 (Medium-term target)
- **Target 3:** 6,788.90 (Extended target)
These targets are derived from previous resistance levels and Fibonacci extension analysis.
Moving Averages:
The chart shows multiple moving averages (likely 50 SMA and 200 SMA based on the red and orange lines). Price is currently attempting to reclaim these key moving averages, which would further validate the bullish thesis.
Risk Considerations
While the technical setup appears favorable, traders should consider:
- Confirmation on higher timeframes for reduced false signal risk
- Volume analysis to validate the breakout
- Proper risk management with stop-loss placement below recent swing lows
## Disclaimer
This is a technical analysis for educational purposes only and should not be considered as financial advice. Always conduct your own research and consult with a qualified financial advisor before making investment decisions. Past performance does not guarantee future results.
Persistent Systems Breakout parallel channelPersistant system has given a breakout and now I think it is ready to break its 52 week high. It will cross 6800-7000 is possible.
PERSISTENT – Bullish Engulfing + RSI Breakout📊 PERSISTENT – Technical & Educational Snapshot
Ticker: NSE: PERSISTENT | Sector: 💻 IT Services
CMP: ₹ ▲ (as of 20 Aug 2025)
Rating (for learning purpose): ⭐⭐⭐⭐
Pattern Observed: 📈 Bullish Engulfing + RSI Breakout
PERSISTENT is displaying strong bullish momentum across multiple technical indicators. The presence of a strong bullish candle with Open = Low, combined with an RSI breakout, highlights aggressive buying pressure. A Bullish Engulfing pattern further supports the continuation bias. Meanwhile, the Bollinger Band Squeeze-Off suggests increased volatility with a likely breakout on the upside. Together with a volume-supported move, these signals indicate strength in the trend.
📊 Volume Check:
🔹 Current Volume: 628.85k
🔹 20SMA Volume: 604.21k ✅
💥 Above average – confirming genuine buying interest!
💡 Learnings:
Bullish engulfing + Open=Low candles often signal strong buyer dominance.
RSI breakouts are stronger when paired with above-average volumes.
Bollinger Band squeeze-offs frequently precede powerful directional moves.
Defining pullback areas and invalidation levels helps structure risk management.
Key Levels:
Resistance: 5410 | 5475 | 5580
Support: 5240 | 5135 | 5070
Pullback Level: 5284
Invalidation Level: Close below 5008
STWP Trade Setup:
Entry (Long): Above 5370
Stop Loss: 5173 or below
Reference Levels: 5566 | 5763
⚠️ Disclaimer – Please Read Carefully
The information shared here is meant purely for learning and awareness. It is not a buy or sell recommendation and should not be taken as investment advice. I am not a SEBI-registered investment advisor, and all views expressed are based on personal study, chart patterns, and publicly available market data.
Trading — whether in stocks or options — carries risk. Markets can move unexpectedly, and losses can sometimes be larger than the money you have invested. Past performance or past setups do not guarantee future results.
If you are a beginner, treat this as a guide to understand how the market works — practice on paper trades before risking real money. If you are an experienced trader, remember to assess your own risk, position sizing, and strategy suitability before entering any trade.
Consult a SEBI-registered financial advisor before making any real trading decision.
By reading, watching, or engaging with this content, you acknowledge that you take full responsibility for your own trades and investments.
💬 Found this useful?
🔼 Give this post a Boost to help more traders discover clean, structured learning.
✍️ Drop your thoughts, questions, or setups in the comments — let’s grow together!
🔁 Share with fellow traders and beginners to spread awareness.
✅ Follow simpletradewithpatience for beginner-friendly setups, price action insights & disciplined trading content.
🚀 Stay Calm. Stay Clean. Trade With Patience.
Trade Smart | Learn Zones | Be Self-Reliant 📊

PERSISTENT | Cup and Handle | Breakout | DailyAnother **superb bullish setup** on **PERSISTENT SYSTEMS LTD**!
Textbook **Cup and Handle** pattern here with a **flag inside the handle**, adding extra confirmation. Let’s break it down:
---
## ☕ **PERSISTENT SYSTEMS – Cup & Handle Breakout**
### 📍 **Pattern**:
* **Cup Depth**: ₹1805.15
* **Breakout Point (Neckline)**: ₹5960
* 🎯 **Target**:
₹5960 + ₹1805.15 = **₹7775** ✅
---
### 📈 **Technical Analysis Highlights**
* ✅ Breakout from handle + flag pattern near neckline
* ✅ RSI breakout above falling trendline — confirms momentum
* ✅ All EMAs are in **bullish alignment**
* ✅ Price above 8/21/55/144 EMA and 79% change YoY
---
### 🔍 **Bullish Confluence**
* Cup & Handle (long-term pattern)
* Flag inside Handle (short-term continuation)
* RSI breakout = Strength confirmation
* Strong earnings growth (see EPS panel)
---
### 📊 **Trade Setup**
* **Entry**: ₹5960–₹6020 range (already broken out)
* **Target**: ₹7775
* **Stoploss**: ₹5700 or below flag support (tight stop \~₹5600)
---

PERSISTENT : Coming out from the ZONE!Key Observations:
Price Action Context:
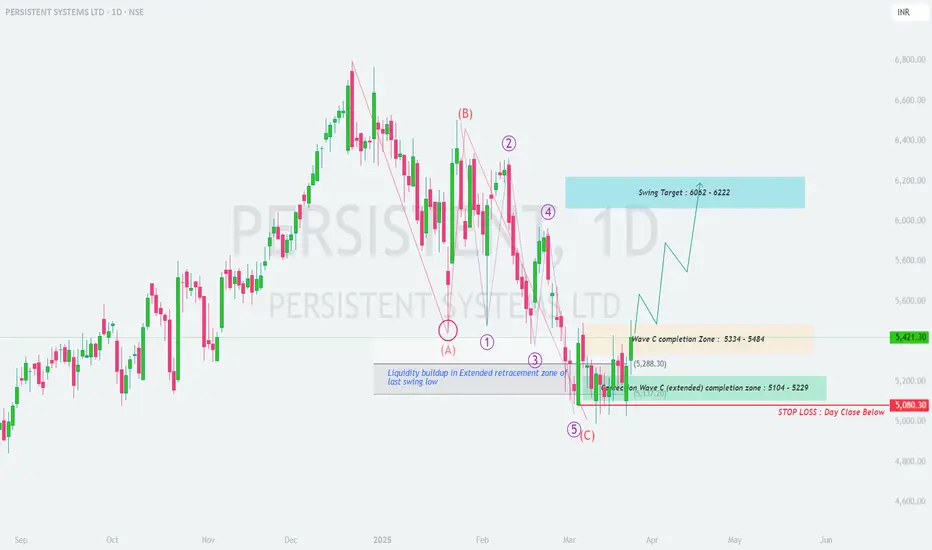
The stock is currently trading at ₹5,306, showing a strong +2.78% intraday move.
This price action is occurring within what appears to be an extended retracement zone of the prior swing, suggesting a possible consolidation before continuation.
Wave Analysis (Elliott Wave Perspective):
Wave C appears to have completed in the ₹3,234 – ₹5,464 zone, which is typically where corrective waves terminate before a new impulsive move begins.
The current structure hints at a bullish Wave 5 extension, with a projected completion zone between ₹5,104 – ₹5,229.
Key Levels:
Support (Demand Zone): ₹5,104 – ₹5,229
Resistance (Profit Targets): ₹6,032 (initial) → ₹6,222 (extended)
Invalidation Level: Daily close below ₹5,104
Why This Setup Matters:
Legalarity Concept (Consolidation Before Breakout):
The stock is forming a legalarity structure, which refers to a period of sideways price action after a strong trend.
This often precedes a continuation move if support holds.
Momentum Confirmation:
Today’s bullish candle (+2.78%) suggests buying interest near the support zone.
A decisive break above ₹5,464 (Wave C high) could confirm the next leg up.
Risk Management:
Since no trade setup is perfect, we must define where we’re wrong.
If price closes below ₹5,104, the bullish structure weakens, and traders should reconsider.
Trade Plan (Educational Breakdown):
Entry Logic:
Aggressive Entry: Near current levels (₹5,300 – ₹5,400) with tight stops.
Conservative Entry: Wait for a pullback to ₹5,104 – ₹5,229 support zone.
Profit Targets:
First Target (₹6,032): Partial profit booking level.
Second Target (₹6,222): Extended swing high, where resistance may appear.
Stop Loss:
Daily close below ₹5,104 (invalidates the bullish structure).
Risk-Reward Assessment:
If entering at ₹5,300 with a stop at ₹5,100:
Risk = ₹200 per share
Reward (to ₹6,222) = ₹922 per share
Risk-Reward Ratio = ~1:4.6 (Favorable for swing trades)
Seasonal & Macro Factors:
Historical Trends: The stock has shown strength in Sep-Dec (year-end rally tendencies).
Current Market Sentiment: A breakout above ₹5,464 could attract momentum buyers.
Educational Takeaways:
✅ Always define support/resistance before trading.
✅ Use invalidation levels to manage risk.
✅ Wave analysis helps anticipate where trends may resume.
✅ Risk-reward should justify every trade.
Disclaimer: This is educational content, not financial advice. Do your own analysis.
#NSE #PERSISTENT #TechnicalAnalysis #SwingTrading #StockMarket
How to Use This Analysis:
Watch for confirmation above ₹5,464 for higher conviction.
Adjust position size based on your risk tolerance.
Track price action near targets for exit signals.
PERSISTENT System Buy for 35% GainPERSISTENT System Buy for 35% Gaining, showing Double Bottom Formation
wait for weekly closing above level
CMP : 5060
TGT : 6790
SL : 4700
Disclaimer : It is my personal view as a trader and for educational purpose only. Equity market involves risk. Please consult your financial adviser before taking any decision.

#PERSISTENTEnter near 5917 which is the support to retest No Overlap and confirm the rise ahead
Starts a new journey
Entry at Intraday with CCi 34 >110 and CCI 8 5 < -135

PERSISTANT BREAKOUTPERSISTENT giving breakout
with huge volume strong rsi
trading above 20 ema
educatinal idea only


Can it Persistently Rise? Market Cap 38,892 Cr.
Stock P/E 41
Industry PE 33
Piotroski score 8
ROCE 31 %
ROE 26 %
Debt to equity 0.17
OPM 18 %
EBIDT growth 3Years 38 %
Promoter holding 31 %
Persistent Systems provides software engineering and strategy services to help companies implement and modernize their businesses. It has its own software and frameworks with pre-built integration and acceleration.
BFSI accounts for the majority of revenues at 31.6%, followed by Healthcare & Life Sciences (20.8%). Tech & emerging verticals account for the remaining 47.6% of revenues.
The company has a global presence with presence in 17 countries including India, Australia, Canada, Germany, Japan etc.
The North American region contributes 78.8% of the total revenue. Contribution from India region was 10.6% and Europe was 8.7% while the Rest of the World contributed 1.9% of total revenue.

persistent MONTH FRAME analysisStock on month frame is in uptrend
strongly defended its base area
its a breakout candidate after consolidation
stop loss to reward is healthy

You would not want to miss this pattern in Persistent!Persistent systems has been in strong bull run from 2020 to end of 2021.
Since 2021, the stock is consolidating and has formed a beautiful inverted head and shoulder consolidation as a flag of flag pole pattern
The stock might start a new uptrend above 5000. However, buying at top in such volatile market is risky.
Kindly trade as per your own analysis.

Persistent Weekly brack-out and pull backThe presistance system is the IT sector good stock to buy the current level the weekly chart is clear show that dec 2021 the 5018 is resistance level. but currenlty the share is brackout and now the price is pullback.
If you are buy this level, this is the low risk & high return expected.
Note:- This is only for education purpose// for more subscribe my youtube channel

Nifty IT breakout above 29400 Nifty IT cmp 29355 breakout above 29400 sustaining Target 30800/31300++++
Stocks to Keep On Radar
Coforge
Infosys
Persistent
Wipro
HCL Tech
Tech Mahindra
LTTS
LTI

Persistant Trade idea Persistant Trade idea
1800-1900 points breakout range
Pattern Inverted Head & Shoulder - Bullish
Daily scale -ABCD pattern
Perfect set up for june series

Persistent Weekly Charts suggest Upside RallyPersistent Weekly Chart is about to Breakout on upside with possible targets 50% Upside in next 6-8 Months.
Multiple Patterns identified on weekly charts - CUP Patter / Inverse H&S Pattern / Flag & Pole Pattern.
LTP - 5041
SL - 4800
Targets - 7000+
Time frame - 6-8 Months
Happy Investing to my Friends & Followers.

Persistent - CASHLooks like the stock has break the Resistance level of 4636-4670 and the price has come for retest.
Will create a long position here for target of 4915-4930 with a stop loss at 4610-4600.

PERSISTENT System 18th & 19th may 2023PERSISTENT successfully retested the level and looks good to buy above 4830 SL 4796 Targets 4864,4904,4943

Persistent Ready for new BO#Persistent CMP 4691 forming a base around this level. Earlier it respected the Demand zone between 3900-4100 and came abv again the resistance level of 4400.
Seems ready for good upside from here to 5000/5500/6500 in mid term.
Trailing SL 4575 closing basis.

PERSISTENT LONG IDEA NSE:PERSISTENT
PERSISTEND making some kind inverse h&S pattern and taking good support around 4450 - 4500 level we can see some swing opportunity in this stock
ENTRY would be - 4450
TARGET - 4700
SL - 4370 below stoploss
