PFC : W pattern Breakout (weekly chart)#PFC W pattern Breakout
Good Volumes buildup in the run up to breakout
It might retrace little then bounce back.
See the price action and Keep the Levels in mind
wait patiently for trgts.
Happy Trading
PFC


PFC at multiple resistence Pfc is a sell. weekly candle hit resistence. once can sell for a target of 115,112.

PFC - DAILY CHART - 26.09.2022 - BAHAVAN CAPITALPOWER FINANCE CORPORATION as per Daily chart analysis stock should take a Support at 104.60 as per previous supports and if it continues to break and fall then Below 103 then Target is 99.
With FII Net Selling 5101.30 Crores and DII Net Buying 3532.18 Crores it looks like FII have begin the selling once again and tomorrow could be an important day to see whether market is able to recover by consolidating forming a Reversal Doji candle in Nifty and Bank Nifty or continue to fall. Lets see whether the market if at falls can take reversal at jun 17th 2022 Nifty level of 15183.
I have Bought Vedanta and will continue to buy more stocks during this correction.
Happy Profitable Trading to all..
Happy Navaratri wishes to All...

BEARISH: PFCThe stock can see a significant correction
1. The stock is rebounding from a resistance line from which previous rally has seen correction
2. The stock is on the verge of breaking a support line
3. The stock is breaking down the bollinger band and possibly ending a consolidation which was happening over the past couple of weeks
All analysis if only for educational purpose.


PFC - LongAnalysis done on 2 hours chart. W pattern may form. Harmonic Cypher pattern prediction. Already trendline is broken. Follow entry, SL. Target 1 for conservative traders rest can trail SL.

Simple Trade Setup | PFC | 16/05/22 [INTRADAY]NSE:PFC
I am posting this on request from one of the follower...
Observations:
1) On 1day time frame, it is near critical range which is 104-106. which was working as support in recent days and as well as in past year.
If it breakdown this range then we can see down move.
100 is psychological support level.
Please refer below chart : 1day time frame.
-------------------------------------
Trade Setup for 16-05-2022
1) Don't Jump in to trade at the beginning of the market. Let it get settle for 15-20min first and judge the price action.
2) Everything is mentioned on the chart. I hope it is easy to understand.
3) All the levels will work as support, resistance, entry and exit w.r.t price action near that level.
4) Avoid gap up or gap down chase. Wait and trade between levels.
Please refer below chart for levels.
Hope I made it easy to understand it.
Do comment your doubt or suggestion.
Note: Trade with Strict SL. It may or may not hit all the levels. So one can book profit / loss at respective level considering how price action works near that level.

PFC: Shorting opportunity on Daily TimeFramePFC is in a channel pattern on 1 moth TF since 2010.
On a Daily TF it is following a downward trend line and recently formed a bearish engulfing candle at the trend line, so it could be a good opportunity to short.
Short term target: 104 (next strong support).
Long term target: 80-85 (monthly channel support).
P.S: If market continues uptrend then we might need to look for another opportunity on this.

#StockMarket #StockIdeas #StocktoWatch #StockToBuy #positionalPFC - Power Finance Corp
Stock correcting from a recent high, forming a falling wedge pattern with support in 110 range
Recently pattern breakout in the chart and consolating from the last 4days in range
Safe Buy above 117 levels for targets of 120-130 levels
With SL of 110 on closing basis
In case of GapUp avoid setup.
Also Stock can be add to gain dividend payout
----
Note:
Above levels are for education purposes only
Do your own analysis before taking any trade

PFCLong downtrend, consolidation at bottom , broke out of consolidation , retraced , can go for long.

Long PFC...High Probability SetupPFC
Cmp - 125
Stop - 115
Expectation -
T1 - 140
T2 - OPEN, Review at 140
Expected Holding Period - 3 months or earlier for T1, 5 months or earlier for T2, else wait
View:- Swing/Investment


FY21-22 Swing Trade Idea #190: Long on PFC This is a public swing trade idea (other private ideas accessible through website) and is only for Learning and observational purpose. Please understand your risk and take full responsibility of your actions. We would comment on any further updates on our entry, targets and stop-loss on this idea, so make sure to follow if you want to get further updates. Our objective to help anyone who wants to learn technical analysis using charts. You can post your queries in comment section here and we will try to answer asap.

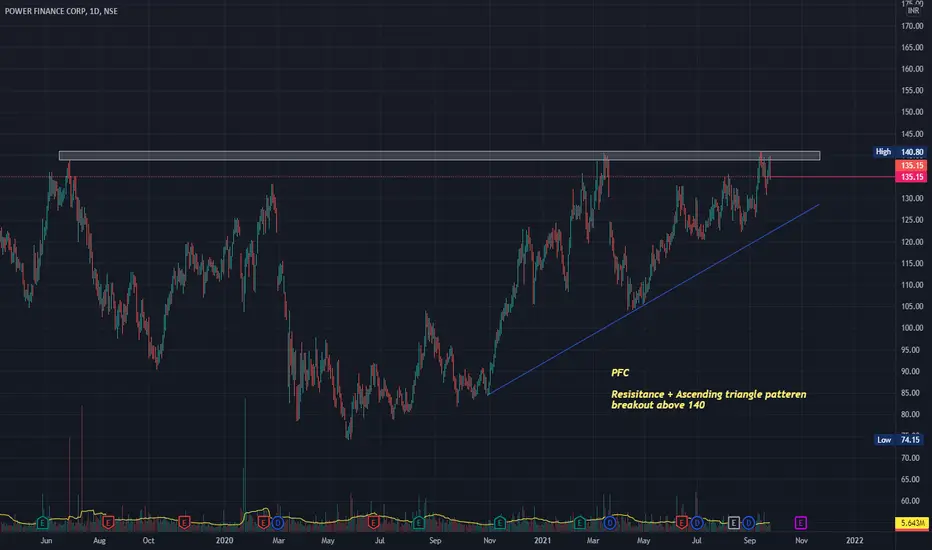
Near long time resistance. BO can give good movePFC is at a long time resistance. BO above 140 can give target 0f 147 , 157 and above

Bright chances of Hugh MoveThis is Monthly Timeframe.
PFC is near is resistance of a very long resistance line.
We saw a big breakout in TATA Power from power sector few months back.
Will it happen same with PFC?
The chances are looking bright as it is sideways for years.
And here, RR ratio is also looking good which 1:2 if I kept stoploss near the recent support.
It may also go above it's all time high.
Power demand is increasing. There a lot fundamental positive actions are taking place.
So it will benefit it.
This post is for information purpose only.

PFC fundamentally strong stockNSE:PFC
breaks its 2 yrs résistance.
also ready to coming out from 10 yrs channel pattern.
buy on dips SL- below the zone.
#LONGTERM STOCK
#the_pravin #simPlepriceaction #notoindicator #nakedchart #swingtrading

PFC Head and Shoulder pattern formation and retest of prev highClear Inverse HNS pattern formation in PFC which is a positive signal to go long in the stock
CMP is 139
SL is 119 (Daily closing basis)
Target1 is Rs 156
Target2 is Rs 169
Target3 is Rs 200
Do your own analysis before investing.

PFC - INTRADAY BREAK & RETEST Plan your Trade & Trade your Plan
Up trending Stock
Inverse Head & Shoulders Pattern Breakout
Retest to H&S Neckline
Fib Rejection from 50% level
Entry can be done with confluence from lower timeframe like 5min or lower if you like.
Let uptrend be confirmed in lower timeframe and place your stoploss by looking at higher time frame.

Nifty Energy - Next Big Theme ???Nifty Energy to outperform Nifty in coming days.
Both Long term and short term trend became bullish.
Very positive changes are happening in this
sector and
Charts are looking bullish .... : :)
Few stocks to track in this segment are
Power grid
Tata power
Ntpc
Coal India
PFC,REC,PTC...

SELF EXPLANATORY SERIES : QUICK ANALYSIS ON PFCIn this self explanatory series i will be posting charts with pure technical analysis only without full length explanations , Traders can ask their doubts in comments section, Happy trading.
Disclaimer : This idea was to just give you an insight about my own view and personal observations. Please do your own research or consult an investment advisor before doing any investment or trading

PFC LongPFC Expecting some consolidation and pullback before rally try buying along with the institution best entry 128-130 zones
