PFC: Golden Zone Rejection + Demand Support = Reversal?⚡ POWER FINANCE CORP (PFC) – Wave 4 Correction Ending | Demand Zone Reversal Setup!
🧠 Chart Context & Wave Overview
The chart of Power Finance Corporation Ltd (Daily Timeframe) shows a well-structured Elliott Wave corrective pattern (a-b-c) , where price has likely completed its Wave 4 correction and is preparing for a potential Wave 5 bullish impulse .
Price has reached the strong Wave 4 (Weekly) completion zone between ₹394–₹281 , aligning with previous demand generation area and Fibonacci retracement support.
📊 Key Highlights:
Price rejected from Golden Retracement Zone (50–78%) , confirming end of Wave (b).
Structure completed Wave (a)-(b)-(c) corrective leg.
Currently trading near the upper range of Wave 4 support (₹361–₹374) .
📚 Educational Insights
💡 Golden Retracement Zone (50%–78%):
This zone often acts as a major reversal area for corrective waves — it’s where sellers exhaust and buyers step back in.
🔄 Break of Structure (ChoCH):
A confirmed change of character above the last swing high signals the end of correction and beginning of new impulse.
🧩 Demand Zone Reactions:
Demand zones formed by prior accumulation (like ₹360–₹380) usually offer high-probability reversal setups in trending markets.
🎯 Projection & Prediction
🟢 Support / Entry Zone: ₹361 – ₹374
🔵 Second Entry Zone (If retested): ₹281 – ₹300
🔴 Stop Loss (Closing Basis): ₹270
🎯 First Target: ₹468
🚀 Second Target: ₹531
A breakout above ₹395 (trendline resistance) will confirm the structure shift, activating the bullish leg toward the first target zone.
💡 Trading Strategy (Educational Purpose Only)
📈 Entry Plan:
Look for bullish reversal candle patterns (hammer, engulfing) or structure break near ₹360–₹374 zone.
Aggressive traders can accumulate in current demand zone; conservative traders can wait for breakout and retest above ₹395.
🎯 Targets:
• Target 1 → ₹468
• Target 2 → ₹531
⚖️ Risk Management:
• Risk only 1–2% per trade.
• Maintain SL below ₹270 (daily close).
• Avoid chasing after breakout; buy the retest for better risk/reward.
🧩 Educational Takeaways
✅ Elliott Wave + Fibonacci + Demand Zone confluence provides strong reversal probability.
✅ Wave 4 corrections are deep but offer great swing opportunities.
✅ A confirmed structure breakout = early sign of Wave 5 initiation.
✅ Patience and disciplined position sizing are essential for trend reversals.
📊 Summary & Outlook
PFC appears to have completed its Wave 4 correction within the ₹361–₹374 demand zone.
If price sustains above ₹395 and breaks the trendline resistance, a new Wave 5 impulse rally could target ₹468–₹531 in the coming weeks.
The structure remains bullish as long as ₹270 holds on a closing basis. ⚡
⚠️ Disclaimer
I am not a SEBI-registered analyst .
This analysis is for educational and informational purposes only — not financial advice.
Please do your own research or consult a financial advisor before taking trades.
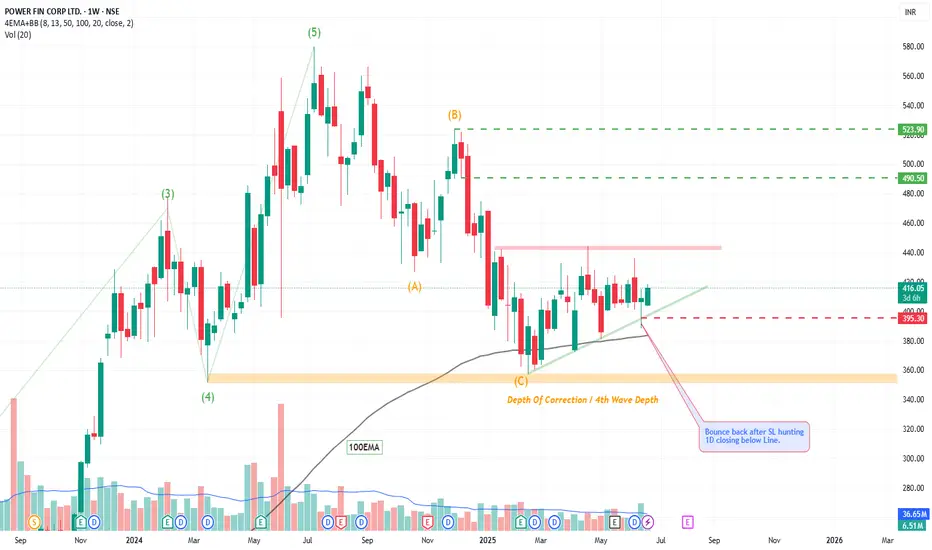
Pfclong

PFC By KRS Charts24th June 2025/ 9:40
Why PFC?
1. Fundamentally Good Company + Regular Dividend Payouts.
2. Technically, Feb 2025 low depth was equals to impulse Wave 4 , which shows correction got its full depth from wave theory perspective .
3. After Depth of Correction , it gave fake sell entry from 100EMA also and bounce back in Feb- Mar 2025 and sustaining above 100EMA currently.
4. Recently price action was making some sort of sideways pattern Flag or Triangle but most imp. is that I have noticed in mid-June in 1D TF it gave closing below support zone and from next day it enters back above the zone. which denotes SL hunted and Sellers got fake entry.
Note: Market do shakeout before breakout just to shake early investors and to hit SL of Breakout Traders. Can happens both sides Buy and Sell.
SL & Targets are mentioned!!
Power Finance Corporation Ltd - Breakout OpportunityDate : 12-Jun-2024
Rating : Buy - Positional Trade
LTP : Rs. 492.05
Targets: (1) Rs. 559 --> (2) Rs. 660
SL : Rs. 442 on daily close basis
Technical View:
• NSE:PFC is in its primary uptrend and was recently going through it's secondary downtrend.
• After touching the high of 559 on 3-Jun-2024, it has retraced 29% to 395.20 level.
• On 12-Jun-2024, NSE:PFC has broke out from its secondary down trend with high volume.
• Prices are trading above 20 DMA, 50 DMA and 21 DEMA.
• RSI is trading at 54.79 and MACD is trading at 11.77.
• Looking good to start a new swing from here.
• All the above observations are noted in Daily Timeframe.
Disclaimer : I am not a SEBI registered analyst/consultant and not recommending anyone to take any BUY or SELL position in stock market. Investing in stock market is risky and one should do a self analysis and validation before investing in stock market. Ideas are published for learning purpose only.

Weekly Bullish Flag Breakout in Power Stock A Bullish Breakout of Flag and Pole pattern is visible on the Weekly chart of NSE:PFC
MACD gave Positive crossover on Daily, Weekly and Monthly chart. So, expecting the momentum to continue.
One can create a fresh position in the scrip as per the levels mentioned on the chart.
Risk Disclaimer:
The information provided in this analysis is based on my personal interpretation of market conditions and the available data at the time of writing. It is advisable to seek advice from a qualified financial professional and to conduct your own research before making any investment decisions.

PFC : Breakout Candidate#pfc #breakoutstocks #VCPpattern #Flagpattern #Lowriskhighreward
PFC : Weekly (1-3 Months) Holding Period
>> Breakout Soon for New Rally
>> Flag Structure
>> VCP Pattern
>> Highly Trending Setup
>> Good Strength & Decent Volume
>> Low Risk High Reward Trade
Swing Traders can lock profit at 10% and Keep Trailing for more
Disclaimer : This is not a Trade Recommendations & Charts/ stocks Mentioned are for Learning/Educational Purpose. Do your Own Analysis before Taking positions.

Power finance Corp. Symmetrical Triangle Breakout CMP 123 buy Power finance Corp.
Symmetrical Triangle Breakout CMP 123
buy above 125 - closing basis
Target 131- 142- 148- 153-160- 175-180+

PFC - Ichimoku BreakoutStock Name - Power Finance Corporation Limited
Ichimoku Cloud Setup :
1). Today's close is above the Conversion Line
2). Future Kumo is Turning Bullish
3). Chikou span is slanting upwards
All these parameters are showing bullishness at Current Market Price
and more bullishness AFTER crossing 220
#This is not Buy and Sell recommendation to any one. This is for education purpose and a helping hand to learn trading in Market.
# Cloud Trading
# Ichimoku Cloud
# Ichimoku Followers
I hope you all like my analysis.
Please do share your thoughts into comment section.
Please give a like, share & subscribe for daily analysis.

PFC - Ichimoku Bullish Breakout Stock Name - Power Finance Corporation Limited
Ichimoku Cloud Setup :
1). Today's close is above the Conversion Line
2). Future Kumo is Turning Bullish
3). Chikou span is slanting upwards
All these parameters are showing bullishness at Current Market Price
and more bullishness AFTER crossing 191
#This is not Buy and Sell recommendation to any one. This is for education purpose and a helping hand to learn trading in Market.
# Cloud Trading
# Ichimoku Cloud
# Ichimoku Followers
I hope you all like my analysis.
Please do share your thoughts into comment section.
Please give a like, share & subscribe for daily analysis.

A Breaking stockPFC, Power finance corporation.
This scrip is continuously approaching to resistance. Scrip has formed a Cup & handle pattern on charts and its strongly bouncing from the golden zone.
Entry @ 155 - 165
Short term target - 180, 190, 200
SL - 155
Type :- Cash

PFC - Ichimoku Bullish Breakout Stock Name - Power Finance Corporation Limited
Ichimoku Cloud Setup :
1). Today's close is above the Conversion Line
2). Future Kumo is Turning Bullish
3). Chikou span is slanting upwards
All these parameters are showing bullishness at Current Market Price
and more bullishness AFTER crossing 144
#This is not Buy and Sell recommendation to any one. This is for education purpose and a helping hand to learn trading in Market.
# Cloud Trading
# Ichimoku Cloud
# Ichimoku Followers
I hope you all like my analysis.
Please do share your thoughts into comment section.
Please give a like, share & subscribe for daily analysis.

PFC : W pattern Breakout (weekly chart)#PFC W pattern Breakout
Good Volumes buildup in the run up to breakout
It might retrace little then bounce back.
See the price action and Keep the Levels in mind
wait patiently for trgts.
Happy Trading

PFC - LongAnalysis done on 2 hours chart. W pattern may form. Harmonic Cypher pattern prediction. Already trendline is broken. Follow entry, SL. Target 1 for conservative traders rest can trail SL.

PFC Looks attractive for dividend PlayThe company was conferred with the status of Navratna PSU by Government of India on 22nd June, 2007. Under the Navratna status, the government has delegated enhanced powers to CPSEs having comparative advantage and the potential to become global players. The corporation is registered as a Non Banking Financial Company with the RBI.
PFC is providing large range of financial products and services like project term loan, lease financing, direct discounting of bills, short term loan, consultancy services etc for various power projects in generation, transmission, distribution sector as well as for renovation & modernisation of existing power projects.
The Ministry of Power, Central Electricity Authority and PFC are working together to facilitate development of Ultra Mega Power Projects with the capacity of about 4000 MW each under Tariff based competitive bidding route. Being large in size, these projects will meet the power needs of number of states through transmission of power on regional and national grids.
The company’s clients are State Electricity Boards, State Power Utilities, State Electricity/Power Departments, Other State Departments (like Irrigation Department) engaged in the development of power projects, Central Power Utilities, Joint Sector Power Utilities, Equipment Manufacturers and Private Sector Power Utilities
Some fundamental ratios :
Market Cap 27,681.25 Cr.
Earnings per share (EPS) 52.01
Price-Earning Ratio (PE) 2.02
Industry PE 3.22
Book Value / Share 285.08
Price to Book Value 0.37
Dividend Yield 9.54 %
No. of Shares Subscribed 264.01 Cr.
FaceValue 10
My view: This is one of My strategy where I plane to buy PSUs at above 10 % dividend yield. I bought REC around 90 where I saw a dividend Yield of 16% , If you see a PSU whose dividend Yiels is more than 15 % than , it is a great opportunity to capture the value.

Long PFC...High Probability SetupPFC
Cmp - 125
Stop - 115
Expectation -
T1 - 140
T2 - OPEN, Review at 140
Expected Holding Period - 3 months or earlier for T1, 5 months or earlier for T2, else wait
View:- Swing/Investment

PFC - INTRADAY BREAK & RETEST Plan your Trade & Trade your Plan
Up trending Stock
Inverse Head & Shoulders Pattern Breakout
Retest to H&S Neckline
Fib Rejection from 50% level
Entry can be done with confluence from lower timeframe like 5min or lower if you like.
Let uptrend be confirmed in lower timeframe and place your stoploss by looking at higher time frame.

PFC NEAR BREAKOUTStock is trading near strong supply zone and this time it looks like stock will breakout wait for weekly close above the supply and buy for given targets.. Purely for education purpose research on your own before investing

[Short Term]Cup & Handle Pattern in PFC (Target -162+)On a Daily Chart, PFC shows breakout above 130 of cup and handle pattern's neckline. After this breakout seen retracement upto the breakout level. Expected it will continue its uptrend upto 162+ in upcoming few trending session. Can go long in this trade above 130 for target of 140,150 and 162+ with stop loss @120.

Power Finance CorpStock is showing great momentum possibly break the triangle formation.
ADX is also showing upside movement .. good stock to buy and hold for some time
Buy on dip recommended

Stocks in My WatchList for long swingStocks in My WatchList for long swing
*Sbi life Insurance. Cmp 1000
*iciciprudential Cmp 561
*HDFC Cmp 2496.75
*Bajaj Finserv Cmp 11318
*Icici Lombard CMP 1449.95
*Axis bank Cmp 716
*PFCL Cmp 108.65
-Paurik Trivedi


PFC Setup Flag pattern Can Breakout #Good Q3 Earnings- NSE:PFC Consolidating @ Resistance sinc emany days
- Good Q3 earnings Reported
- Bullish Flag Pattern formed

PFC ready for a breakout soon keep on your watchlistPFC ready for a breakout soon keep on your watchlist This is for educational purpose only

PFC : weekly chart - investment opportunityPFC will give a good move post breakout.
Entry - ONLY on pullback (else we might be trapped in a FAKEout)
