Pfizer: supply zone breakout-A simple supply zone breakout
-My entry is at 5800, with a stop loss of 5599
-there has been a volume uptick of late with some interesting developments in the cancer and other fields including expansion in China by the parent company
-Covid resurgence also increases the demand of the vaccine which may again improve the top and bottom line
PFIZER

Daily Technical Analysis & Trade Setup📊 Pfizer Ltd – Technical Chart Analysis
Date Analyzed: 27-May-2025
Time Frame: Daily
Price Action Overview:
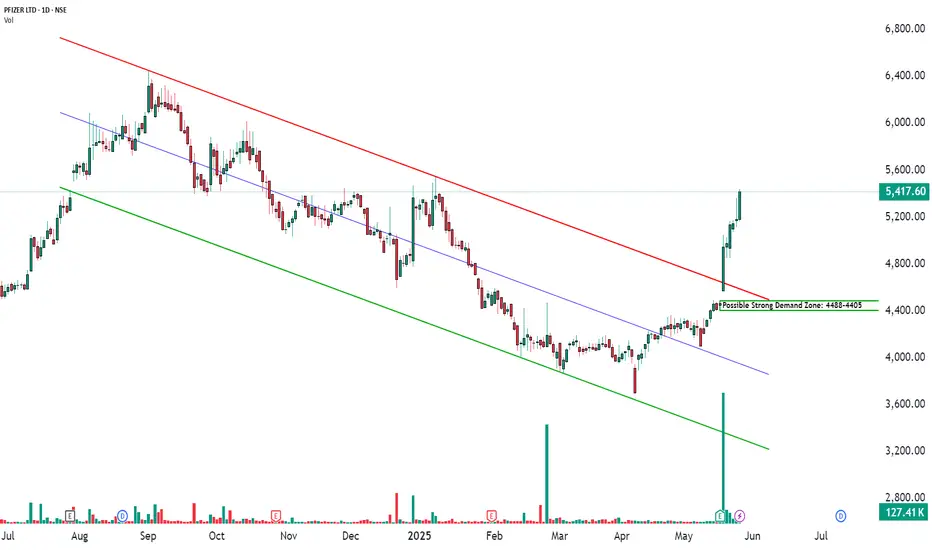
Pfizer Ltd has recently witnessed a sharp bullish move, backed by a strong breakout candle on the daily chart. This up-move is accompanied by a significant volume spike, suggesting increased market participation and conviction in the direction of the breakout. The price has convincingly broken past a key resistance zone, turning it into a potential support zone going forward.
Chart Pattern / Candlestick Analysis:
Breakout Candle: A large green candle with strong body formation.
Volume Breakout: The stock saw a 20-Day Volume Breakout, confirming the strength of the move.
Momentum Continuation Phase: The price structure indicates a transition from accumulation to markup phase, possibly following a Volatility Contraction Pattern (VCP) that resolved on the upside.
Technical Indicators:
Stochastic (D/W/M): Strong bullish readings across daily and weekly timeframes.
CCI (D/W): Shows strength on daily and weekly charts.
MACD (D/W): Bullish crossover on daily and weekly charts.
RSI (D/W): Daily RSI is above 90, showing momentum strength.
Support & Resistance Levels:
Support Zones:
Support 1: 5240.87
Support 2: 5064.13
Support 3: 4965.57
Strong Support: 3800–4000 zone (historical demand zone)
Resistance Zones:
Resistance 1: 5516.17
Resistance 2: 5614.73
Resistance 3: 5791.47
Weak Resistance: 6177.85 and 6547.75 (based on higher timeframe pivots)
Educational Analysis:
This chart is a textbook case of a Breakout with Confirmation. Pfizer Ltd traded within a descending channel from August 2024 to April 2025, consistently forming lower highs and lower lows within two parallel downward-sloping trendlines. This phase indicated sustained bearish sentiment and acted as a long-term consolidation zone. However, in late May 2025, the stock broke out decisively above the upper resistance line of the channel, supported by a surge in volume—an essential sign of institutional participation. Such breakouts gain further credibility when accompanied by bullish signals from momentum indicators like RSI and MACD, which often turn upwards before or during the breakout. For traders tracking breakout setups, this alignment of price structure, volume, and momentum provides a strong confirmation of trend reversal potential and buying interest.
How to Trade Pfizer Ltd (For Educational Purpose Only):
How to Trade Pfizer Ltd (for learning purpose):
Entry Example: 5438.00
Stop Loss: 5068.10 (Risk: 369.90)
Target Example: 5807.90 / 6177.85 (Reward: 369.90 / 739.85)
Sample Quantity: 50 shares
RR Ratio: ~1:1 / ~1:2
Aggressive Traders: May consider riding the trend with trailing stop
Conservative Traders: Can wait for a pullback into the fresh strong demand zone (4488-4405)
⚠️ Risk Management Tip: Always trade with a clearly defined stop loss. Avoid entering positions impulsively. It is advisable to start with a smaller quantity and increase your exposure only if the price action confirms the continuation of the trend. Capital protection should always be the priority.
📢 Disclaimer
This content is created purely for educational and informational purposes. It is not intended as investment advice, stock recommendations, or trading tips. Trading and investing in the stock market involves risk. Please consult with a SEBI-registered financial advisor before making any investment decisions. The author/creator is not registered with SEBI and shall not be held responsible for any losses incurred based on this information. Always do your own research and use proper risk management.
👉 If you found this analysis helpful, don’t forget to Follow, so you never miss out on a trade-worthy setup, breakout opportunity, or valuable educational insight again. Stay updated and trade smarter! 💡📈
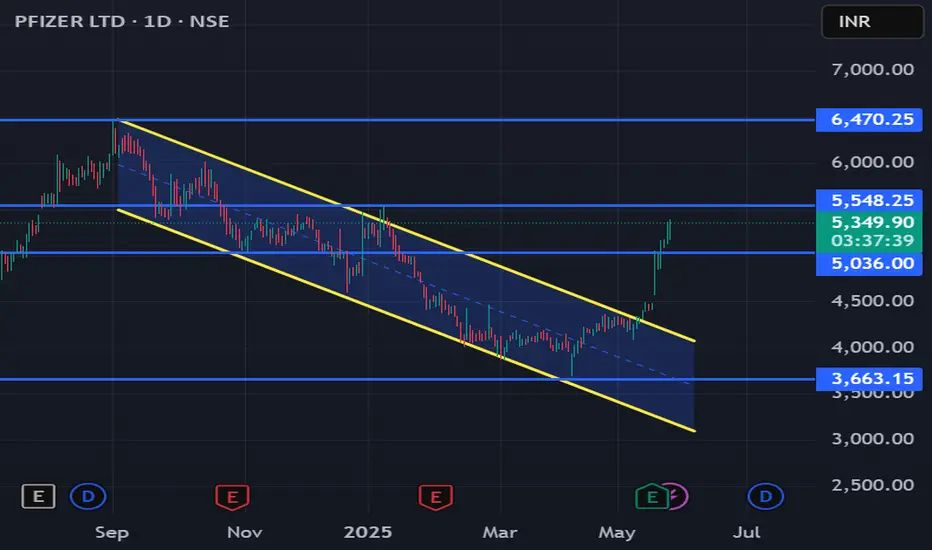
Pfizer: Sustained Channel Breakout Above 5300Details:
Asset: Pfizer Ltd (PFIZER)
Breakout Level: 4400 (Channel breakout), strong sustain above 5300
Potential Targets: 5600, 6500
Stop Loss: Below 5100
Timeframe: Medium to Long Term
Rationale: Pfizer gave a clear channel breakout at 4400 and has now convincingly sustained above 5300, indicating strong institutional accumulation and upside potential.
Market Analysis:
Technical Setup: Channel breakout with follow-through price action and no signs of weakness above 5300.
Sector Outlook: Positive long-term outlook for pharma sector with rising healthcare demand and export momentum.
Risk Management:
Use SL below 5100 to guard against potential pullbacks.
Timeframe:
Medium to long-term targets of 5600 and 6500 look achievable if current levels hold.
Risk-Reward Ratio:
Strong risk-reward with breakout structure intact and long consolidation base formed below.
Watch for continued volumes and bullish momentum to validate the move further.
PFIZER LTDPharma sector seems to be ending bearish trend
and might reverse towards bullish move.
Pfizer showing Morning star pattern which is
reversal bullish pattern on a daily time frame.
Pfizer is also taking support of 200 EMA which is
again a bullish sign.
Do your own analysis before buying trade.

PFIZER LTDWith the Stupendo Fantabulously Phantasmagorically Magical Rally, the selling pressure witnessed here for the past few sessions suggest that this stock shall take a breather.

PFIZER - Mega Breakout AheadHey Family, there is a one more stock Which is showing a great opportunity.
Key Points:-
* Formation of Cup Pattern in daily & Weekly TF.
* After Breakout of cup Pattern this can be re-test the resistance Level.
* It's Near Breakout of Resistance and trying to Break Resistance Zone But showing some Weakness in this week We need a good closing with good volume.
* Volume Accumulation (Volume is Rising).
What is your view please comment it down and also boost the idea this help to motivate us. We are Certified. All views shared on this channel are my personal opinion and is shared for educational purpose and should not be considered advise of any nature.

Buy Pfizer Short Term Trading Advice by Goodluck Capital
Buy Pfizer
Buy Range- 4850 - 4900
Target- 5150 - 5200
StopLoss- below 4750
Potential Return- 6-7%
Approx trade duration 12 - 14 days

PFIZERparallel channel started from Mar'99 and making top in Sept 21
now head and shoulder formation is complete
now a dead cat bounce and followed by bears

EXCITING BULLISH PATTERNExciting Bullish Pattern Alert
PATTERN : Ascending Triangle being formed
SYMBOL : Pfizer
DESCRIPTION : Stock with strong daily and hourly support

Pfizer - CMP: 4385The stock had given a breakout with good delivery volume and again it retraced to touch the trendline. Good opportunity to go long.

PFIZER#PFIZER--- It looks like a lot accumulation is going at these levels and expecting the stock to bounce in the near future.


Pfizer - Accumulation ZonePfizer - Accumulation Zone
In a short-term uptrend...
Educational Purpose ...


PFIZER Ready For A BouncePFIZER
Buy-Above 4500
Sl-4300
T-4800 4959 5000+
The stock is ready to give a bounce . Consider buying as RR is too good from here.

PLong

Pfizer LTD - Daily Analysis - CMP 4471 buying levels 4330-4450 Pfizer LTD - Daily Analysis - CMP 4471
buying levels 4330-4450
target 4785- 5000- 5220- 5420- 5600-+
sl below 4200 (candle closing basis)

📊 #PfizerLTD Swing Trade Opportunity 🎯NSE:PFIZER
📌 To Trade on This Chart, You Should Have Reversal Trading Knowledge. As Harmonic is One Of The Best Reversal Trading Strategy, But Always Remember That Harmonic Patterns Also Can Fail (there is no holly grail In Stock Market). That's Why One Should Must Have Knowledge Of Reversal Trading To Trade On Harmonic Patterns.
📌 That Dash Line Is Called PRZ, From That Dash Line To that Horizontal Simple Line Area Is Whole PRZ(Price Reversal Zone).
******whatever charts or levels sharing here or on any other platforms are just for educational purpose only, Not A Recommendation To Buy Or Sell. Please do your own analysis before taking any trade on them. We are not SEBI registered.

Short PfizerPfizer is looking week as string support zone has breached with triangle pattern creation.
RSI ROC and Vortex is week.

PFIZER - Ready to make ATHPFIZER
Buy-Above 5200
Sl-4860
T- 5600 5850 6250+
The stock is trading on weekly parallel channel support. Consider buying with the swing low as sl.

PFIZER OPEN FOR LONG MAINTAINING CHANNEL 1.TARGET OPEN
2. RESPECTING CHANNEL
3. GOOD RISK REWARD
4. TARGET OPEN 24% FOR NEXT 3 MONTHS
like/Share IF YOU agree
All Ideas Are for Educational Purpose Only :)

buy on dippfizer sustained on week on 20sma on montly time frame that confirmed the direction of upcoming trend
so took long position on monday of 2nd week following monthly chart
