Hidden Parallel Channel: Weighted Lines & Zones ExposedThis chart illustrates key technical elements where price interacts with multiple reference lines and zones, emphasizing their observed relevance based on proximity and historical behavior.
The red counter trend line, distant from price by 35-40%, carries less immediate weight, while the white counter trend line touched by price demonstrates stronger participation. Green highlights a long-term weekly demand zone from historical levels, and the white zone on daily timeframe marks a prior gap down with resistance reaction.
Parallel dotted white lines outline a hidden channel, repeatedly respected and rejected by price, underscoring its structural significance. These elements combine multi-timeframe context to showcase how markets organize around dynamic references rather than static predictions.
Motto is to showcase how one can create setup from any or all of the above ingredients, its all about perspective and how you approach and backtest in markets - experience is importnat - field experience in trading is scrolling Trading view and keep backtesting .
Disclaimer: This is purely educational content on price action, zones, and patterns. Not SEBI-registered advice. Charts use historical data >3 months old; NO forecasts, NO buy/sell recommendations, or guarantees of results. DYOR and consult professionals.
PGEL

PGEL: Suggest Momentum ShiftPG Electroplast Ltd. (PGEL) has recently shown signs of emerging strength after a prolonged phase of consolidation. Over the last two trading sessions, the stock has demonstrated upward momentum, suggesting a possible attempt to break out of its range-bound structure. This observation is supported by several technical factors:
1. Moving Averages & Volume Dynamics
The stock has successfully closed above the 20-day EMA, indicating short-term bullish sentiment.
It is currently trading near the 50-day EMA, although it has not yet closed above this level. The recent price movement has been accompanied by increased trading volume, which may reflect growing market participation.
2. Change of Character (CHOCH)
The break above the 20-day EMA, despite the price not closing above the 50-day EMA, may signal a CHOCH. This is often interpreted by technical analysts as a potential shift in trend direction, particularly from bearish to neutral or bullish.
3. RSI Momentum
The RSI has moved above the 60 level, suggesting strengthening momentum. This level is typically viewed as a transition zone between neutral and bullish conditions.
4. MACD Signal
A bullish crossover on the MACD indicator has occurred on the daily timeframe. This crossover may indicate a potential shift in momentum, especially when supported by price structure and volume.
Breakout Confirmation Level:
A sustained close above ₹597 could be interpreted as a breakout from the consolidation zone. If this level is cleared with volume support, the next potential resistance may lie near ₹712 , based on historical price action. The lower boundary of the recent consolidation zone, around ₹494 , may act as a support level. This area could be monitored for potential retests or invalidation of the breakout attempt.
Disclaimer: This analysis is intended for educational and informational purposes only. It does not constitute investment advice or a recommendation to buy, sell, or hold any financial instrument. Market participants are encouraged to conduct their own research and consult with a licensed financial advisor before making any investment decisions.

PGEL: Worth Taking a risk- Bottom formation.
- Good momentum and strength is expected
⚠️ Disclaimer: This is NOT a buy/sell recommendation. This post is meant for learning purposes only. Views are personal. Please, do your due diligence before investing.⚠️
💬 Share your thoughts in the comments below! ✌️
🔥 Trade Safe! ✅ 🚀

PG ELECTROPLAST – Volume Breakout from Tight Base________________________________________________________________________________
📈 PG ELECTROPLAST – Volume Breakout from Tight Base | Bullish Momentum Brewing
🕒 Chart Type: Daily Chart
📆 Date: July 9, 2025
________________________________________________________________________________
📌 Price Action:
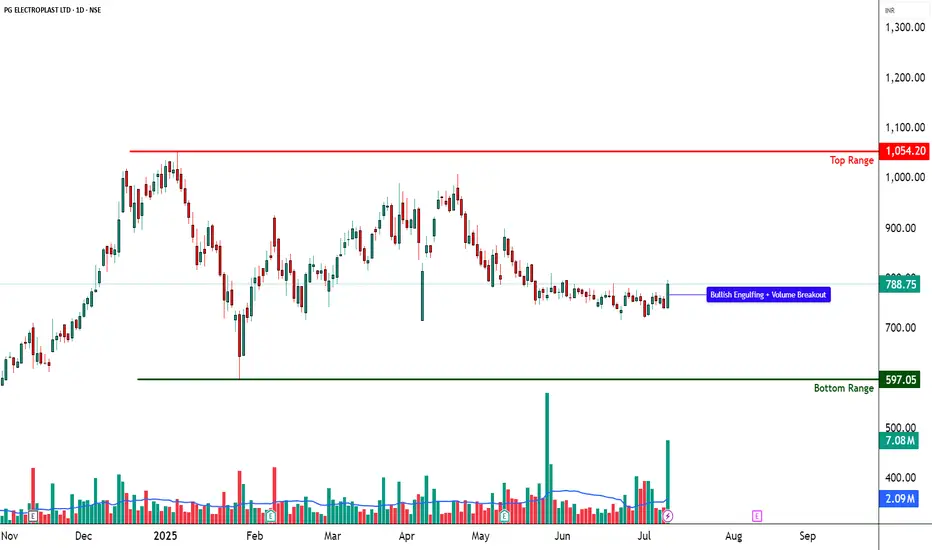
PG ELECTROPLAST LTD has shown an impressive breakout from a tight base, rising from the 735–755 congestion zone with a wide-range bullish candle on July 9. The candle had an open = low structure, closed near the high, and was backed by massive volume. This signals clear buying strength and suggests that bulls are stepping in after a period of low volatility and sideways movement. The stock had been trading in a narrow band and has now broken out with strong conviction, hinting at the beginning of a possible trend reversal or a short-term momentum rally.
________________________________________________________________________________
📊 Chart Pattern:
The chart displays a tight base breakout from a multi-week compression zone. While not a textbook wedge or flag, the narrowing range combined with flat moving averages suggested the stock was coiling up for a move. The breakout candle pierced the upper end of the range, with volume confirming that it wasn't a false push. This kind of price behaviour often leads to trend expansion — especially when confirmed by broader volume activity.
________________________________________________________________________________
🕯️ Candlestick Pattern:
Bullish Engulfing Candle
Open = Low Structure
Strong Bullish Range Candle
This combination, particularly when seen after a base, is a strong signal of fresh buying interest. It also fits the “Buy Today, Sell Tomorrow” short-term momentum logic, especially for educational model trades.
________________________________________________________________________________
🔊 Volume Analysis:
The breakout was supported by a 10-day volume breakout, with volumes spiking over 3x the average. This is not just intraday noise — it reflects strong delivery participation and genuine interest. Volume spike at breakout is a key sign of smart money involvement. Moreover, the spike occurred from a compressed base, which adds further weight to the strength of the breakout.
________________________________________________________________________________
📈 Technical Indicators:
RSI (Daily): 56 — rising from neutral territory, not yet overbought
MACD: Bullish crossover active on Daily & Monthly
Stochastic: 90 on Daily – indicates strong upward momentum
CCI: 155 – overbought but in a bullish continuation zone
Bollinger Bands: Price broke out of a tight squeeze zone — start of volatility expansion phase
BB Squeeze + Bullish VWAP: Adds confirmation that the trend is beginning to expand
________________________________________________________________________________
🧱 Support & Resistance:
🔺 Resistance Levels:
810.43 – First resistance to watch above current price
832.12 – Prior swing level; price may pause or consolidate here if momentum continues
867.33 – Longer-term resistance zone, marked as a level of interest
Top Range: 1054.2 – Long-term weak resistance zone that triggered the previous major selloff
🔻 Support Levels:
753.53 – Closest support below breakout
718.32 – Well-tested swing level; acted as floor in recent range
696.63 – Important structural support
Bottom Range (Demand Zone): 597.05 – Major long-term support, last zone from where price rallied strongly
________________________________________________________________________________
👀 What’s Catching Our Eye:
The combination of price compression, bullish engulfing breakout, and high volume participation makes this setup stand out. Volume is not just high — it’s clean and backed by structure. The candle formation, RSI breakout, and BB squeeze all come together, creating a powerful setup for momentum continuation. This kind of alignment is rare and usually signals smart money entry.
________________________________________________________________________________
🔍 What We’re Watching For:
The most critical zone is the 796.90 breakout level. If price sustains above it for the next couple of sessions, the structure remains intact. We’re also watching for a possible retest toward the 753–755 zone — if the stock pulls back there on low volume and bounces again, it may offer a low-risk entry setup. Continuation beyond 810 could build momentum, but we will rely on risk-reward and price behaviour — not predictions.
________________________________________________________________________________
✅ Best Buy Level for Equity (Low Risk Idea):
Breakout Entry: Above 796.90, only on follow-through or sustained closing above breakout zone
Pullback Entry: Into the 753.53–755 support zone if the price stabilizes and shows a bullish reversal
Stop Loss: Structure-based, below 736.95 (on closing basis)
Risk-Reward Thinking: Look for 1:1 initially, then trail the stop as the move develops; no fixed projections — price action will guide the outcome
________________________________________________________________________________
💼 Sector Tailwinds:
PG ELECTROPLAST operates in the electronics and contract manufacturing sector — two spaces getting a major boost from PLI schemes, China+1 shift, and rising domestic demand. India’s push toward import substitution, rising middle-class consumption, and government incentives are all helping businesses like PG scale up. This provides a strong macro tailwind to any technical strength seen on charts.
________________________________________________________________________________
⚠️ Risk to Watch:
If price slips back below 753, the breakout weakens
A close below 736.95 negates the breakout setup and could invite selling pressure
Indicators are showing strength, but slightly stretched — so expect volatility and avoid over positioning
Never trade based only on breakout excitement — always wait for confirmation and manage risk first
________________________________________________________________________________
🔮 What to Expect Next:
If the price holds above 796.90, the path toward 810.43 may open up quickly. Sustained volume and consolidation near highs would indicate strength, while sharp rejection could signal a trap. A minor pullback to support zones (753–755) could offer a second opportunity if structure holds. The next few candles will tell us whether this breakout becomes a trend or just a temporary spike.
________________________________________________________________________________
🧠 How to Trade PG ELECTROPLAST (For Educational Use Only):
Breakout Plan (Hypothetical):
🔹 Entry: Above 796.90 (only if price sustains)
🔹 Stop Loss: 736.95 (closing basis; risk-controlled)
🔹 Trade Logic: Use position sizing as per capital and SL distance
🔹 Risk-Reward: Look for 1:1 minimum, trail for 1:2+ if structure expands — don’t fix targets, let the chart lead
🔹 Pullback Buy: Into 753–755 zone with same SL (if structure supports)
________________________________________________________________________________
⚠️ Disclaimer (Please Read):
• This chart is shared for educational purposes only and is not investment advice.
• I am not a SEBI-registered advisor.
• The information provided here is based on personal market observation.
• No buy/sell recommendations are being made.
• Please do your own research or consult a registered financial advisor before making any trading decisions.
• Trading involves risk. Always use proper risk management.
________________________________________________________________________________
💬 Found this helpful?
Where would you look for a trade in PG — breakout follow-through or pullback into the support zone?
Share your thoughts or questions in the comments ⬇️
🔁 Share this with your trading community
✅ Follow STWP for clean technical setups backed by price action and volume
🚀 Let’s trade with patience, logic, and clarity!
Be Self-Reliant | Trade with Patience | Learn with Logic
________________________________________________________________________________
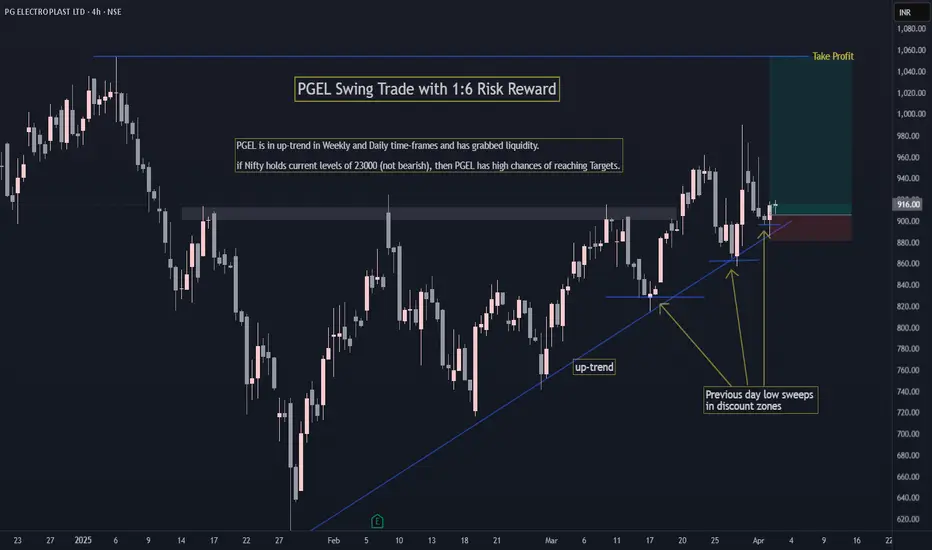
PGEL Swing Trade with 1:6 RRPGEL is in up-trend in Weekly and Daily time-frames.
It has grabbed liquidity from previous day low.
1:6 Risk to Reward. (on a safer side you can take 1:5 RR trade by increasing your SL a bit).
if Nifty holds current levels of 23000 (ie. not bearish), then PGEL has high chances of reaching Targets.
Happy trading!
Pg Electroplast Limited - Breakout Setup, Move is ON...#PGEL trading above Resistance of 853
Next Resistance is at 1200
Support is at 599
Here are previous charts:
Chart is self explanatory. Levels of breakout, possible up-moves (where stock may find resistances) and support (close below which, setup will be invalidated) are clearly defined.
Disclaimer: This is for demonstration and educational purpose only. This is not buying or selling recommendations. I am not SEBI registered. Please consult your financial advisor before taking any trade.

Pg Electroplast Limited - Breakout Setup, Move is ON...#PGEL trading above Resistance of 599
Next Resistance is at 853
Support is at 439
Here is previous chart:
Chart is self explanatory. Levels of breakout, possible up-moves (where stock may find resistances) and support (close below which, setup will be invalidated) are clearly defined.
Disclaimer: This is for demonstration and educational purpose only. This is not buying or selling recommendations. I am not SEBI registered. Please consult your financial advisor before taking any trade.

PGEL - Electronics production in India PGEL - Electronics production in India. It supports multiple brand products from AC, Freeze, Coolers and other electronic instruments.

Rocket has been launched after Breakout of PG Electroplast Ltd.PG Electroplast Limited is the flagship company of the PG Group, and is one of the leading players in India in Electronics Manufacturing Services. It is a diversified EMS providing OEM and ODM solutions for complete product and component manufacturing.
Market Cap
₹ 3,759 Cr.
Current Price
₹ 1,653
High / Low
₹ 1,716 / 821
Stock P/E
39.6
Book Value
₹ 174
Dividend Yield
0.00 %
ROCE
17.3 %
ROE
21.9 %
Face Value
₹ 10.0
Debt
₹ 577 Cr.
EPS
₹ 41.9
PEG Ratio
Promoter holding
61.2 %
Intrinsic Value
₹ 999
Pledged percentage
0.00 %
EVEBITDA
20.5
Guy's we have seen neat and clean Falling Trendline Breakout in PG Electroplast. Now this can become Rocket as buyers going to enter here to ride the rally. This Breakout getting support of Volumes. Volumes is an important indicator that can often confirm whether a Stock has given a valid Breakout or a false Breakout from a support or resistance trendline. A valid or genuine Breakout occurs on high volumes while a false breakout occurs on low Volume. Hence in case of a Breakout, it is a very important to look at Volumes.
Some Positive Technical Factor about this Ticker:-
Price is above 200 EMA
We have seen Proper Falling Trendline breakout
with Good Volume
Price is sustaining above breakout trendline
MACD and RSI has given bullish crossover (I have not placed RSI here as i want chart neat and clean but i have analysed already)
Disclaimer:- Please always do your own analysis or consult with your financial advisor before taking any kind of trades.
Dear traders, If you like my work then do not forget to hit like and follow me, and guy's let me know what do you think about this idea in comment box, i would be love to reply all of you guy's.
Thankyou.

Long Position Opportunity In PGELCMP : 1401
Target : 1465
Stoploss : 1364
This is not a buy or sell call, this analysis is shared for educational purpose.

PGELPGEL:- Cup and handle pattern has formed, breakout has given, keep an eye
Hello traders,
As always, simple and neat charts so everyone can understand and not make it too complicated.
rest details mentioned in the chart.
will be posting more such ideas like this. Until that, like share and follow :)
check my other ideas to get to know about all the successful trades based on price action.
Thanks,
Ajay.
keep learning and keep earning.

#PGEL long trade #PGEL look good for upside
1. Stock is forming Ascending triangle pattern
2.Breakout with Huge volume candle
3. Stock is above 200- EMA

PG Electroplast LimitedPGEL:- Rounding bottom pattern has formed, wait for the breakout on the hourly chart, till then keep an eye on the stock.
Hello traders,
As always, simple and neat charts so everyone can understand and not make it too complicated.
rest details mentioned in the chart.
will be posting more such ideas like this. Until that, like share and follow :)
check my other ideas to get to know about all the successful trades based on price action.
Thanks,
Ajay.
keep learning and keep earning.

PGEL - Flag Breakout1. Flag Pattern & All Time High Brokeout.
2. Quarter & Annual growth are increasing.

PGEL-Symmetrical Pattern Breakout Daily Time FrameSwing Trade-PGEL-Symmetrical Pattern Breakout Daily Time Frame. Only Education Purpose.

PGELCMP: 768
- Volatility contraction has been seen in this stock.
- Downside looks protected.
New All Time High?!

#PGEL: STRONG UPMOVEPG ELECTROPLAST LTD. is a strong stock.
It witnessed a breakout above 600 and
breached 620 resistance level too.
Closing near day high - increases upside move chance.
Above 655 more upside expected.
RELATIVE STRENGTH POSITIVE
Note: This is for Educational Purposes only and
not a buy recommendation.
Consult your financial advisor before
entering into trade.
I AM NOT SEBI REGISTERED

PG ELECTROPLAST LTD DOORSTEP OF CUP AND HANDLEWE CAN observe PG ELECTROPLAST as it may form cup and handle this week


