PG ELECTROPLAST – Volume Breakout from Tight Base________________________________________________________________________________
📈 PG ELECTROPLAST – Volume Breakout from Tight Base | Bullish Momentum Brewing
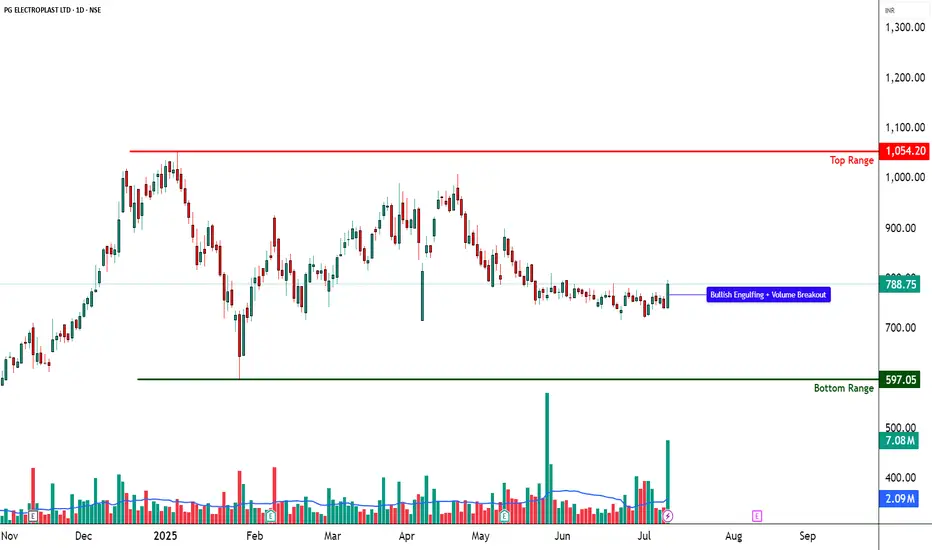
🕒 Chart Type: Daily Chart
📆 Date: July 9, 2025
________________________________________________________________________________
📌 Price Action:
PG ELECTROPLAST LTD has shown an impressive breakout from a tight base, rising from the 735–755 congestion zone with a wide-range bullish candle on July 9. The candle had an open = low structure, closed near the high, and was backed by massive volume. This signals clear buying strength and suggests that bulls are stepping in after a period of low volatility and sideways movement. The stock had been trading in a narrow band and has now broken out with strong conviction, hinting at the beginning of a possible trend reversal or a short-term momentum rally.
________________________________________________________________________________
📊 Chart Pattern:
The chart displays a tight base breakout from a multi-week compression zone. While not a textbook wedge or flag, the narrowing range combined with flat moving averages suggested the stock was coiling up for a move. The breakout candle pierced the upper end of the range, with volume confirming that it wasn't a false push. This kind of price behaviour often leads to trend expansion — especially when confirmed by broader volume activity.
________________________________________________________________________________
🕯️ Candlestick Pattern:
Bullish Engulfing Candle
Open = Low Structure
Strong Bullish Range Candle
This combination, particularly when seen after a base, is a strong signal of fresh buying interest. It also fits the “Buy Today, Sell Tomorrow” short-term momentum logic, especially for educational model trades.
________________________________________________________________________________
🔊 Volume Analysis:
The breakout was supported by a 10-day volume breakout, with volumes spiking over 3x the average. This is not just intraday noise — it reflects strong delivery participation and genuine interest. Volume spike at breakout is a key sign of smart money involvement. Moreover, the spike occurred from a compressed base, which adds further weight to the strength of the breakout.
________________________________________________________________________________
📈 Technical Indicators:
RSI (Daily): 56 — rising from neutral territory, not yet overbought
MACD: Bullish crossover active on Daily & Monthly
Stochastic: 90 on Daily – indicates strong upward momentum
CCI: 155 – overbought but in a bullish continuation zone
Bollinger Bands: Price broke out of a tight squeeze zone — start of volatility expansion phase
BB Squeeze + Bullish VWAP: Adds confirmation that the trend is beginning to expand
________________________________________________________________________________
🧱 Support & Resistance:
🔺 Resistance Levels:
810.43 – First resistance to watch above current price
832.12 – Prior swing level; price may pause or consolidate here if momentum continues
867.33 – Longer-term resistance zone, marked as a level of interest
Top Range: 1054.2 – Long-term weak resistance zone that triggered the previous major selloff
🔻 Support Levels:
753.53 – Closest support below breakout
718.32 – Well-tested swing level; acted as floor in recent range
696.63 – Important structural support
Bottom Range (Demand Zone): 597.05 – Major long-term support, last zone from where price rallied strongly
________________________________________________________________________________
👀 What’s Catching Our Eye:
The combination of price compression, bullish engulfing breakout, and high volume participation makes this setup stand out. Volume is not just high — it’s clean and backed by structure. The candle formation, RSI breakout, and BB squeeze all come together, creating a powerful setup for momentum continuation. This kind of alignment is rare and usually signals smart money entry.
________________________________________________________________________________
🔍 What We’re Watching For:
The most critical zone is the 796.90 breakout level. If price sustains above it for the next couple of sessions, the structure remains intact. We’re also watching for a possible retest toward the 753–755 zone — if the stock pulls back there on low volume and bounces again, it may offer a low-risk entry setup. Continuation beyond 810 could build momentum, but we will rely on risk-reward and price behaviour — not predictions.
________________________________________________________________________________
✅ Best Buy Level for Equity (Low Risk Idea):
Breakout Entry: Above 796.90, only on follow-through or sustained closing above breakout zone
Pullback Entry: Into the 753.53–755 support zone if the price stabilizes and shows a bullish reversal
Stop Loss: Structure-based, below 736.95 (on closing basis)
Risk-Reward Thinking: Look for 1:1 initially, then trail the stop as the move develops; no fixed projections — price action will guide the outcome
________________________________________________________________________________
💼 Sector Tailwinds:
PG ELECTROPLAST operates in the electronics and contract manufacturing sector — two spaces getting a major boost from PLI schemes, China+1 shift, and rising domestic demand. India’s push toward import substitution, rising middle-class consumption, and government incentives are all helping businesses like PG scale up. This provides a strong macro tailwind to any technical strength seen on charts.
________________________________________________________________________________
⚠️ Risk to Watch:
If price slips back below 753, the breakout weakens
A close below 736.95 negates the breakout setup and could invite selling pressure
Indicators are showing strength, but slightly stretched — so expect volatility and avoid over positioning
Never trade based only on breakout excitement — always wait for confirmation and manage risk first
________________________________________________________________________________
🔮 What to Expect Next:
If the price holds above 796.90, the path toward 810.43 may open up quickly. Sustained volume and consolidation near highs would indicate strength, while sharp rejection could signal a trap. A minor pullback to support zones (753–755) could offer a second opportunity if structure holds. The next few candles will tell us whether this breakout becomes a trend or just a temporary spike.
________________________________________________________________________________
🧠 How to Trade PG ELECTROPLAST (For Educational Use Only):
Breakout Plan (Hypothetical):
🔹 Entry: Above 796.90 (only if price sustains)
🔹 Stop Loss: 736.95 (closing basis; risk-controlled)
🔹 Trade Logic: Use position sizing as per capital and SL distance
🔹 Risk-Reward: Look for 1:1 minimum, trail for 1:2+ if structure expands — don’t fix targets, let the chart lead
🔹 Pullback Buy: Into 753–755 zone with same SL (if structure supports)
________________________________________________________________________________
⚠️ Disclaimer (Please Read):
• This chart is shared for educational purposes only and is not investment advice.
• I am not a SEBI-registered advisor.
• The information provided here is based on personal market observation.
• No buy/sell recommendations are being made.
• Please do your own research or consult a registered financial advisor before making any trading decisions.
• Trading involves risk. Always use proper risk management.
________________________________________________________________________________
💬 Found this helpful?
Where would you look for a trade in PG — breakout follow-through or pullback into the support zone?
Share your thoughts or questions in the comments ⬇️
🔁 Share this with your trading community
✅ Follow STWP for clean technical setups backed by price action and volume
🚀 Let’s trade with patience, logic, and clarity!
Be Self-Reliant | Trade with Patience | Learn with Logic
________________________________________________________________________________