Glenmark - Strong Buy - Technical Analysis# Glenmark Pharmaceuticals Technical Analysis Report
**Stock:** Glenmark Pharmaceuticals Limited (NSE)
**Current Price:** ₹2,038.20
**Date:** December 23, 2024
**Timeframe:** Weekly Chart
## Price Action Overview
Glenmark Pharmaceuticals is currently trading at ₹2,038.20, showing strong momentum with a 2.31% gain. The stock has demonstrated significant recovery from its mid-2024 lows and is currently testing critical resistance levels.
## Technical Structure
The chart reveals a well-defined technical pattern with the following characteristics:
**Support and Resistance Levels:**
- Strong horizontal support at ₹1,790.65 (marked in black) has held multiple times
- Target 1 (Tgt 1) at ₹2,132.50 represents immediate resistance
- Target 2 (Tgt 2) at ₹2,225.50 marks the next major resistance zone
**Trend Analysis:**
The stock exhibits a clear recovery pattern from the March-April 2025 lows around ₹1,400-1,500. After testing support near ₹1,790, the price has bounced strongly and is now approaching the first target level. The presence of multiple moving averages (likely including 20, 50, and 200-period) suggests the stock is in a recovery phase, with shorter-term averages crossing above longer-term ones.
**Pattern Recognition:**
The descending trendline (shown in black) from the September 2024 peak has been broken to the upside, which is a bullish technical signal. This breakout suggests potential continuation of the upward momentum.
## Key Observations
**Bullish Factors:**
- Recent breakout above the descending trendline
- Price holding above the ₹1,790 support zone
- Positive price action with higher lows being formed
- Current momentum showing +2.31% gain
**Resistance Zones:**
- Immediate resistance at ₹2,132.50 (Target 1)
- Major resistance at ₹2,225.50 (Target 2)
- Historical resistance zone around ₹2,300-2,400 from earlier in 2024
**Critical Levels to Watch:**
- Support: ₹1,790.65 (crucial support level)
- Current: ₹2,038.20
- Resistance: ₹2,132.50 and ₹2,225.50
## Outlook
The technical setup suggests a bullish bias as long as the stock maintains above the ₹1,790 support level. The breakout from the descending trendline and the current price position indicate potential for further upside toward the marked targets. However, traders should watch for potential resistance at the Target 1 level around ₹2,132.50.
A sustained move above ₹2,132.50 could open the path toward ₹2,225.50, while a failure to break through this level might lead to consolidation or a pullback toward the ₹1,900-2,000 zone.
---
*This analysis is based on technical chart patterns and should not be considered as financial advice. Please conduct your own research and consult with a financial advisor before making investment decisions.*
Pharmastocks

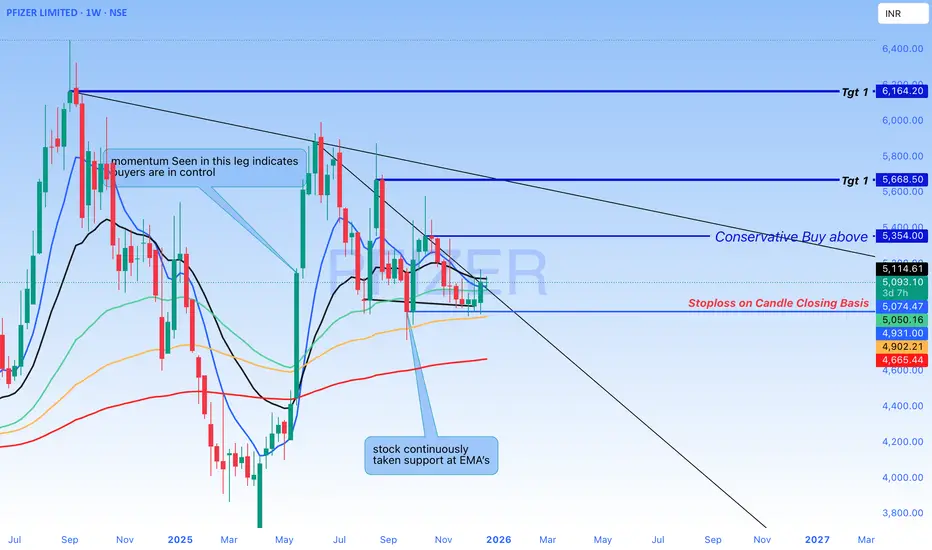
Buy Pfizer - Technical reasons- Short to Swing TradeExplained the strong technical reasons for the Bullish set up in the Charts
#Cipla - #ShortTerm #Inveatment IdeaCipla Ltd - Technical Analysis
Current Price: 1,639.10
Timeframe: Monthly Chart Analysis
This analysis utilizes:
- Monthly and Weekly timeframe analysis
- Fibonacci extension and retracement levels
- Support/resistance identification
- RSI momentum analysis
- Price action patterns
Technical Structure Overview
1. Monthly Consolidation Phase
After making a higher high, Cipla is currently in a consolidation phase on the monthly chart, forming a strong base. This consolidation suggests preparation for a potential significant move higher.
2. Breakout Level to Watch
The critical level to monitor for breakout confirmation is around the recent high zone. A decisive break above this level could trigger the next leg of the uptrend.
3. Weekly Timeframe Confirmation
For higher probability setups, confirmation should be sought on the weekly timeframe before taking any positions. This multi-timeframe approach reduces false signals.
4. Fibonacci Extension Targets
Based on Fibonacci patterns, the following extension levels have been identified as potential targets for future price movement.
5. Risk Management Strategy
Following a risk-reward approach is essential for this setup given the consolidation phase and potential for significant moves in either direction.
Fibonacci Extension Target Levels
Based on technical projections:
- Target 1: 1,872.70 (1.272 Extension at 1,878.05)
- Target 2: 1,986.95 (1.414 Extension at 1,987.15)
- Target 3: 2,145.45 (1.618 Extension at 2,143.95)
Key Support Levels
Primary Support: 1,345.75 (0.5 Fibonacci level)
Critical Support: 900.50 (0 level - invalidation zone)
Trading Considerations
Bullish Scenario:
- Wait for monthly candle close above consolidation range
- Confirm momentum on weekly timeframe
- Enter on weekly pullback for optimal risk-reward
Invalidation:
- Break and close below ₹1,345.75 would weaken the bullish structure
- RSI showing divergence patterns to monitor
DISCLOSURE & RISK WARNING:
This analysis is provided for educational and informational purposes only and should not be construed as financial advice, investment recommendation, or an offer to buy or sell securities. Past performance is not indicative of future results.

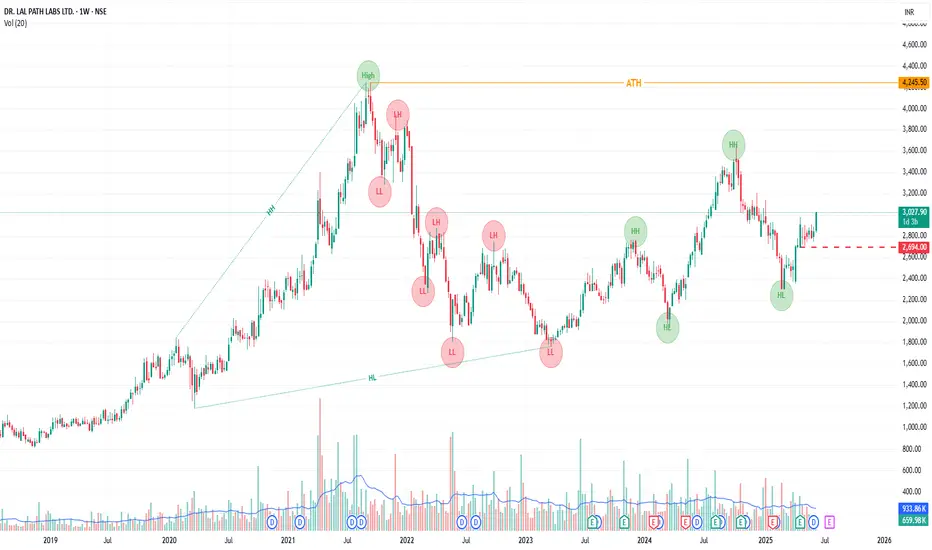
LALPATHLAB By KRS Charts12th June 2025 / 12:44
Why LALPATHLAB?
1. Fundamentals are good company's figures are stable and giving Dividends too.
2. Technically, All Time Bullish Stock making Higher Highs and H.Low.
3. Today in 1D timeframe it broke neckline of invt. Head & Shoulder chart pattern.
4. NSE:CNXPHARMA is also looking good which is one more reason to be bullish on one of a good company.
Targets will be New High Point 3750+ Rs.
SL is mentioned in Chart.
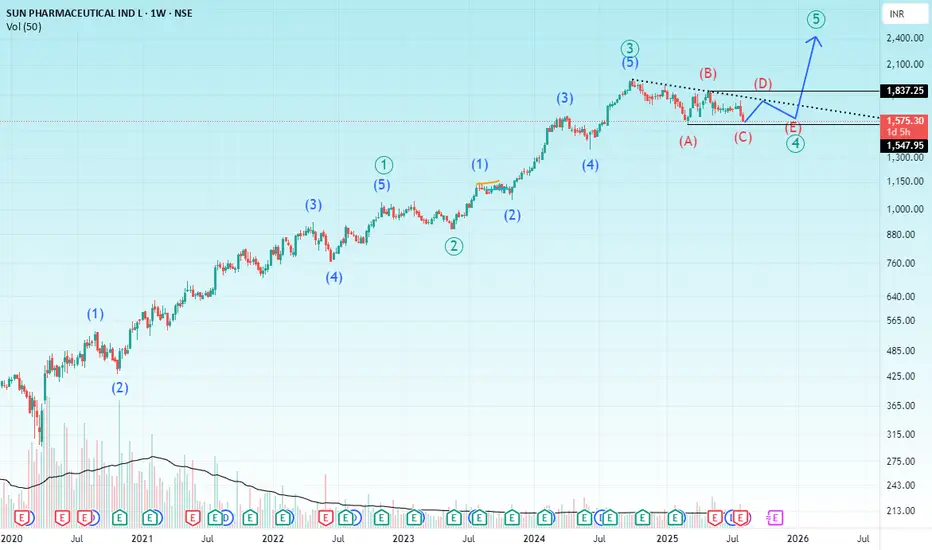
SUN PHARMAHello & welcome to this analysis
From the pandemic lows made in March 2020 till date it has likely completed Wave 1, 2 & 3 and is doing a time wise (TRIANGLE) corrective wave 4.
The sub waves of 4 are suggesting "c" is ending with "d" and "e" pending before it resumes the terminal wave 5 impulse.
This is suggesting that for quite a bit of time the stock could remain range bound.
This wave count of a triangle will be invalid if current decline goes below 1547 and/or the expected bounce in wave "d" goes above 1857.
Wave 5 target could be anywhere between 2400-2500
All the best
U.S. Inhaler Play and Strong Earnings Fuel Long-Term UpsideTicker: NSE: CIPLA
Sector: Pharmaceuticals
Market Cap: ₹1.26 lakh crore+
Current Price: ₹1,572 (as of July 28, 2025)
Technical Rating: ⭐⭐⭐⭐⭐ (Strong Buy across platforms)
________________________________________________________________________________
🔍 Strong Fundamentals Back the Bullish Momentum
CIPLA has delivered an encouraging performance in Q1 FY26, reinforcing its long-term bullish narrative. The company posted a 10% year-on-year growth in profit after tax (PAT), reaching ₹1,298 crore, while revenues climbed 4% to ₹6,957 crore. These gains were driven largely by robust performance across its domestic Indian market and continued traction in Africa. The earnings beat estimates and demonstrate management's ability to maintain profitability despite sector-wide margin pressures.
Brokerages have taken note. Antique Broking has issued a bullish price target of ₹1,875, citing confidence in CIPLA’s U.S. respiratory pipeline. Meanwhile, Nuvama has pegged a more conservative target of ₹1,651, emphasizing margin resilience. Both reflect a broader positive sentiment from the street, bolstered by the company’s continued strategic execution.
Perhaps most importantly, CIPLA's U.S. growth roadmap is gaining clarity. With a stated goal of achieving $1 billion in U.S. revenue by FY27, the company is betting big on its inhalation portfolio. The upcoming launches of generic Advair and Symbicort are expected to cushion the impact from the anticipated decline in Revlimid revenues. This pipeline visibility is a key factor that differentiates CIPLA from its peers in the pharma space.
________________________________________________________________________________
📊 Technical Structure Signals Bullish Breakout
From a technical standpoint, CIPLA has just confirmed a breakout from an ascending triangle pattern, typically viewed as a continuation setup in an uptrend. On July 28th, the stock surged above the key breakout zone of ₹1,575–₹1,580, backed by a substantial increase in volume (3.84M vs 1.68M avg), signaling institutional participation. The daily close at ₹1,572 marks a technical inflection point, with the price now firmly above its 20, 50, 100, and 200 EMAs, indicating strong trend alignment.
The momentum indicators are also supportive, though cautionary. The Relative Strength Index (RSI) hovers around 71, suggesting overbought conditions, while the MACD has given a fresh bullish crossover. Additionally, the ADX (above 25) confirms trend strength. However, traders should be prepared for short-term volatility or pullbacks, as these indicators often cool off before further upside continues.
Key support levels to watch include ₹1,536, followed by ₹1,500 and ₹1,479.5. On the upside, immediate resistances lie at ₹1,592.5, then ₹1,613 and ₹1,649. A sustained close above ₹1,580–1,592 may unlock the next bullish leg toward ₹1,650+ levels.
________________________________________________________________________________
⚠️ Risks Remain – Pricing Pressure and Valuation a Concern
Despite the bullish setup, there are risks that could temper upside momentum. CIPLA’s U.S. Revlimid portfolio is facing pricing pressure, a trend impacting the broader generics market. Any further compression could drag margins in upcoming quarters. Additionally, while the company has posted solid profits, its EBITDA margin has seen a slight dip to 25.6%, suggesting limited operating leverage.
On the valuation front, CIPLA now trades at nearly 27× P/E, pricing in much of the future growth optimism. This elevates the bar for quarterly execution. From a technical lens, the RSI and stochastic indicators remain in overbought territory, raising the possibility of near-term consolidation or minor pullbacks before the next move higher.
________________________________________________________________________________
⏳ Tactical & Strategic View – Trade the Momentum, Invest in the Vision
In the short term, momentum traders should monitor how the stock behaves around the ₹1,575–₹1,580 breakout level. If the price sustains above this zone with continued volume, it signals strength and potential for a rapid move toward ₹1,600–₹1,650. However, any retracement to the ₹1,540–₹1,550 support range could present an ideal buying opportunity, especially for swing traders looking for a defined risk-reward setup.
For long-term investors, the bullish thesis rests on execution of the U.S. strategy and maintaining growth in high-margin geographies. With brokerages projecting upside toward ₹1,650–₹1,875, and a strategic focus on inhalation therapies, CIPLA is well-positioned for structural growth. That said, investors must remain patient and allow the multi-year thesis to unfold.
________________________________________________________________________________
🧠 Market Sentiment – Cautious Optimism
Overall market sentiment remains decisively positive, supported by strong earnings, a visible product pipeline, and favorable technical alignment. Yet, caution stems from the overbought technicals and valuation concerns. A prudent approach would be to accumulate on dips near ₹1,540–₹1,550, while watching for a decisive breakout and close above ₹1,580 to confirm trend continuation.
________________________________________________________________________________
📍 Investment Thesis: Accumulate with Conviction
CIPLA’s combination of strong fundamentals, a defined U.S. strategy, technical momentum, and institutional interest makes it a compelling long-term investment. Traders and investors alike can look to accumulate on dips, while treating a breakout above ₹1,580 as a confirmation trigger for further upside. Execution risk remains, but the broader setup favors a bullish bias heading into the next quarter.
For traders looking to capitalize on Cipla’s potential breakout, two entry strategies stand out. An aggressive entry can be considered in the ₹1,572–₹1,577 range, with a stop loss placed at ₹1,558. This suits momentum traders aiming to ride an early breakout, targeting ₹1,590 as an initial objective and ₹1,610+ for extended gains, offering a risk-reward ratio of 1:1 to 1:2+. Alternatively, a low-cost entry is ideal near ₹1,564 for those seeking a better cushion against volatility, with a tighter stop loss at ₹1,542. This setup also offers attractive upside toward ₹1,580–₹1,605+, maintaining similar or better risk-reward dynamics. In both cases, a decisive breakout above ₹1,580 on strong volume would confirm the bullish structure. Traders are advised to follow strict stop-loss discipline and avoid chasing if the price stretches sharply.
________________________________________________________________________________
⚠ Disclaimer (Please Read):
• These Trades are shared for educational purposes only and is not investment advice.
• I am not a SEBI-registered advisor.
• The information provided here is based on personal market observation.
• No buy/sell recommendations are being made.
• Please do your own research or consult a registered financial advisor before making any trading decisions.
• Trading involves risk. Always use proper risk management.
• I am not responsible for trading decisions based on this post.
________________________________________________________________________________
💬 Found this helpful?
Drop your thoughts or questions in the comments below ⬇️
🔁 Share this post with your trading community – let them benefit from clean charts, structured setups, and zone-based learning.
✅ Follow simpletradewithpatience for charts, clean setups, and educational content based on price action, zones, and risk-managed trades.
🚀 Trade with patience, trust your charts, and stay clear-headed!
Be Self-Reliant | Trade with Patience | Learn with Charts & Zones 📊________________________________________________________________________________

Lauruslabs-It can fly towards ATH again!Lauruslabs has given a good breakout of trendline and horizontal resistance with volume.
Stock is looking strong for a reversal and can fly towards ATH if market supports.
Keep in watchlist.

Elliott Wave Insights: Clearly indicates the Analytical approachHello friends,
Welcome to RK_Chaarts,
Today we're going to attempt to analyze the chart of Biocon Limited. Clearly, on the monthly timeframe, we can see that we've completed wave ((3)) and wave ((4)), which are of primary degree, marked on chart in Black color. We're currently unfolding wave ((5)), which will have five sub-divisions on the weekly timeframe. The weekly chart also shows that we've completed wave (1) and wave (2) of intermediate degree which we've marked in Blue, and wave (3) has begun, possibly indicating a breakout on the weekly chart. This breakout, having good intensity of Volumes.
Similarly, on the daily chart, we can see that we've completed sub-divisions red 1 and red 2 within wave (3), and possibly started red 3 of (3).
So, based on wave analysis, the outlook appears highly bullish, snapshots are shared below.
Possible Wave counts on Monthly
Possible wave counts on Weekly
Possible wave counts on Daily
The breakout is also accompanied by excellent volume. If we see a dip on lower timeframes, such as Hourly chart, and the price reaches a reliable moving average like the 50-EMA or 200-EMA, it could be a great opportunity to enter. Additionally, friends, we can see on the daily timeframe that a reversal chart pattern has formed and is on the verge of a breakout, with the price standing at the neckline. As soon as this breakout occurs, we can expect further additions. Snapshots are shared below.
Reversal and Bullish Chart Pattern: Inverted Head n Shoulder
Furthermore, we can see that the RSI on the weekly chart has also broken out and is above 60, indicating a strong bullish momentum. Even the MACD has shown a bullish positive crossover and is moving above the zero line on the weekly chart. Additionally, the monthly MACD is also displaying a strong bullish trend, having given a positive crossover and remaining above the zero line. These are all very positive signs. Snapshots are shared below.
RSI Breakout & above 60 on Weekly
MACD on Weekly
MACD on Monthly
We can see that on the weekly chart, the price has crossed above the major EMAs, including the 50, 100, and 200-period EMAs. Now, as the price moves towards its target, these three major moving averages are not obstacles, but rather support levels below. The fact that the price is moving above all these moving averages is a sign in itself.
Looking at the monthly timeframe, we can see that the price has also crossed above the 50, 100, and 200-period EMAs and is moving above them. This is a strong indication of the trend's strength and direction. Snapshots are shared below.
Ema monthly
Ema weekly
So, friends, if our Elliott Wave analysis is correct, and our roadmap is accurate, then as we can see, the monthly chart's wave ((3)), which is of primary degree, marked as rounded three in black, has completed its rounded ((4)) correction or retracement. Now, we're moving upwards towards wave ((5)).
If our wave count is correct, and the structure is right, then according to the theory, wave ((4))'s low, which is around 192, should not be breached. This level will serve as an invalidation level. If the price breaches the invalidation level of 192, which seems unlikely given the positive signs, our wave count will be invalidated, and we'll need to reanalyze it.
On the other hand, based on Elliott Wave theory, the projected target for wave ((5)) is typically between 123.6% and 161.8% of the length of wave ((4)). So, the price may reach or consolidate between the levels of 559 and 672, which are the projected targets based on wave theory, marking the end of wave ((5)) on the monthly chart.
This post is shared purely for educational purpose & it’s Not a trading advice.
I am not Sebi registered analyst.
My studies are for educational purpose only.
Please Consult your financial advisor before trading or investing.
I am not responsible for any kinds of your profits and your losses.
Most investors treat trading as a hobby because they have a full-time job doing something else.
However, If you treat trading like a business, it will pay you like a business.
If you treat like a hobby, hobbies don't pay, they cost you...!
Hope this post is helpful to community
Thanks
RK💕
Disclaimer and Risk Warning.
The analysis and discussion provided on in.tradingview.com/u/RK_Chaarts/ is intended for educational purposes only and should not be relied upon for trading decisions. RK_Chaarts is not an investment adviser, and the information provided here should not be taken as professional investment advice. Before buying or selling any investments, securities, or precious metals, it is recommended that you conduct your own due diligence. RK_Chaarts does not share in your profits and will not take responsibility for any losses you may incur. So Please Consult your financial advisor before trading or investing.

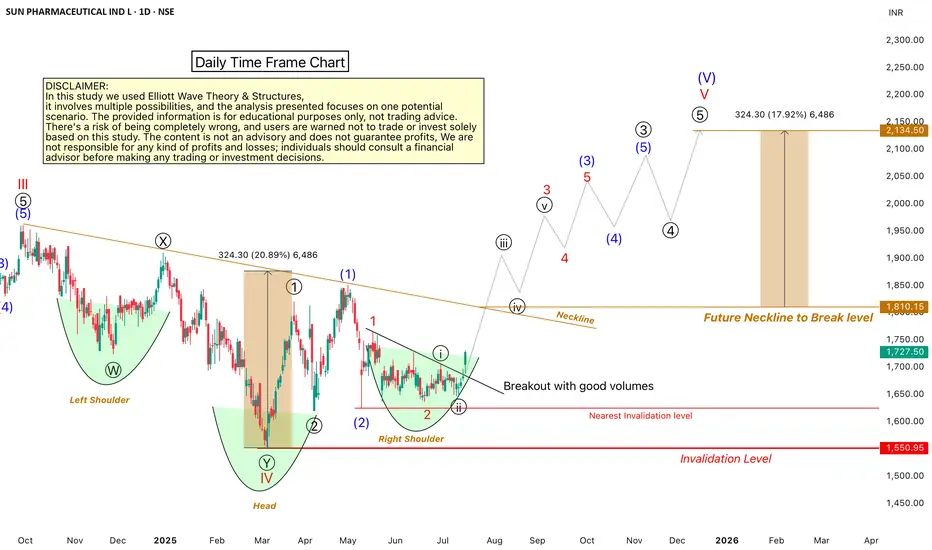
Sun Pharma: A Bullish OutlookHello Friends,
Welcome to RK_Chaarts,
Let's analyze the Sun Pharmaceuticals chart using technical analysis, specifically the Elliott Wave Theory. According to this theory, the September 2024 top marked the end of Wave III cycle degree in red, and the March 2025 bottom marked the end of Wave IV cycle degree in red Now, Wave V of cycle degree in red has begun, which will move upward.
Within Wave V, we should have five sub-divisions of Primary degree in black, with Wave ((1)) & Wave ((2)) already completed. Wave ((3)) has started, with five further sub-divisions of one lower degree intermediate degree, We've marked these in blue, with Wave (1) and Wave (2) completed, and Wave (3) started. Within Wave (3), we have minor degree waves in red, with Wave 1 and Wave 2 completed, and Wave 3 breaking out today with good intensity of volumes.
We can see that the wave counts are super bullish, and so is the RSI, which is above 60. The MACD is also positive, and the price is above the 50-day and 200-day EMAs on the daily and weekly time frames. There's no moving average hurdle, which is another super bullish sign.
We can also see a higher high and higher low formation, which is a bullish sign according to Dow Theory. Additionally, an inverted head and shoulders pattern is forming, with the right shoulder being made. When it breaks out above the neckline, it will give us a target, which aligns with the Elliott Wave Target projection.
All these indicators – technical analysis, price action, and Elliott Wave – point to a bullish trend. However, there's an invalidation level at 1550; if the price falls below this level, our wave counts will be invalidated.
We're projecting targets between 2000-2200 based on Elliott Wave theory projections. Please note that this analysis is for educational purposes only and should not be considered as investment advice.
This post is shared purely for educational purpose & it’s Not a trading advice.
I am not Sebi registered analyst.
My studies are for educational purpose only.
Please Consult your financial advisor before trading or investing.
I am not responsible for any kinds of your profits and your losses.
Most investors treat trading as a hobby because they have a full-time job doing something else.
However, If you treat trading like a business, it will pay you like a business.
If you treat like a hobby, hobbies don't pay, they cost you...!
Hope this post is helpful to community
Thanks
RK💕
Disclaimer and Risk Warning.
The analysis and discussion provided on in.tradingview.com is intended for educational purposes only and should not be relied upon for trading decisions. RK_Chaarts is not an investment adviser and the information provided here should not be taken as professional investment advice. Before buying or selling any investments, securities, or precious metals, it is recommended that you conduct your own due diligence. RK_Chaarts does not share in your profits and will not take responsibility for any losses you may incur. So Please Consult your financial advisor before trading or investing.
SEQUENT SCIENTIFIC By KRS Charts8th May 2025 / 10:30 AM
Why SEQUENT SCIENTIFIC?
1. Technically it is showing Potential for movement.
2. In Past Already Got More than 50% Returns but important thing is as per Dow Theory it is making Higher Low.
3. In 1D TF multiple Breakouts with Above avg Volume is visible.
4. This is 1M Time Frame , so View is Medium to Long term.
T1 is already Achieved in Past but again after Retracement T1 & T2 will be same as before from current price.

ZYDUS LIFE SCIENCEHello & welcome to this analysis
The co gets 50% of its revenue from USA where new policies appear to be hurting the top and bottom line of the stock.
Narrow range 840 - 950, wider range 650 - 1025.
Idea is to buy either after it sustains above 950 or near 650
Happy Investing and all the best with your trading

ALKEM IN BEARS PRESCRIPTION????YES!!!! Chart patterns implies a downward possible move in ALKEM LABS.
1. Every detail given in the chart.....highs and lower highs...lows and lower lows forming a evergreat trading pattern
2. Adding to that, 3 Black crows with good volumes adds probability to the trade.
3. Its been travelling in descending channel pattern...now at the resistance....
Let the Market decide!!!! Let's wait and watch!!!!
This is just my opinion....not a tip nor advice!!!!!
Thankyou!!!!
mmjimm.

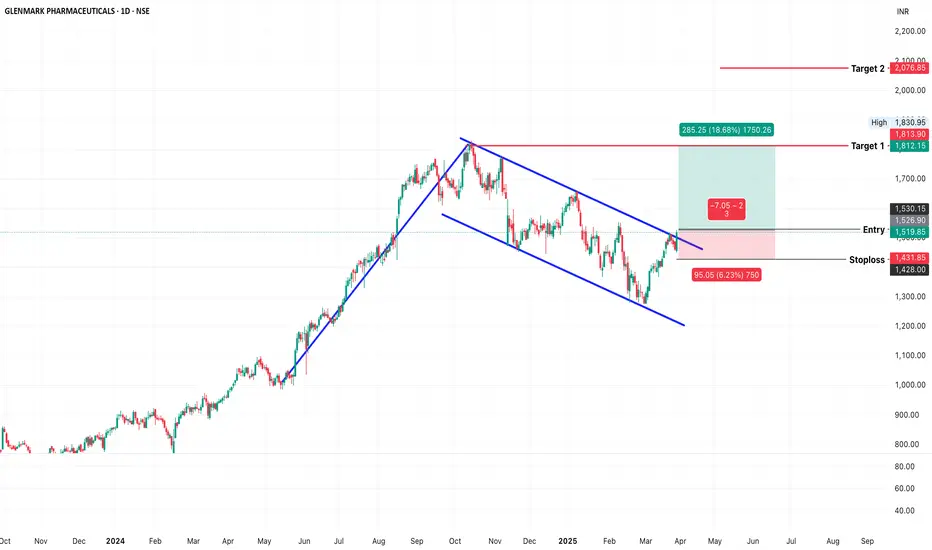
GLENMARK PHARMA (NSE: GLENMARK) – Confirmed Channel BreakoutGlenmark Pharma has confirmed a breakout from a falling wedge and flag & pole pattern , supported by strong volume and a bounce from the 200 EMA . Price structure and momentum suggest bullish continuation.
Key Observations:
Pattern Formation: Falling wedge + flag & pole since September 2024
Breakout Confirmation: Closed above upper trendline at ₹1,519.85 on March 27, 2025
200 EMA Support: Price took support at 200 EMA and reclaimed both key moving averages
Volume Spike: High volume on breakout candle validates the move
Support & Resistance Levels:
Immediate Support: ₹1,432
Breakout Level (Entry): ₹1,520
Target 1: ₹1,813
Target 2: ₹2,076
Major Resistance: ₹2,100
Indicators & Risk-Reward:
✅ RSI: 64.92 – showing strong bullish momentum
✅ Volume: Significant volume surge during breakout
✅ Risk-to-Reward: ~1:3 – ideal for swing setup
Verdict: Bullish
With pattern breakout, volume confirmation, and RSI strength, Glenmark is poised for a potential up-move.
Plan of Action:
BUY: ₹1,520
Stop Loss: ₹1,432
Target 1: ₹1,813
Target 2: ₹2,076
Trailing SL: Start trailing above ₹1,650 to protect profits
Suven Pharma Swing Trade (Long)Suven Pharma is in Uptrend in Daily TF.
On 2h timeframe, it is in uptrend and has grabbed liquidity from Weekly low and daily low.
If Nifty holds current levels ie 22400, then there are high chances Suven Pharma will touch ATH soon.
The Risk Reward is more than 1:8
Do like and follow for more Trading ideas like this regularly. Comment your views on this analysis.

#ASTRAZEN - Potential All Time High BreakOut / Feb'25📊 Script: ASTRAZEN
Key highlights: 💡⚡
📈 Stock is in a Stage 2 Up Trend
📈 VCP under formation in DTF
📈 Wait for more consolidation
📈 BO with volume spike, then only enter
📈 MACD can give a Bounce
📈 RS Line is making 52WH
📈 EMA Rule in place
📈 Price consolidated for 73Days
📈 One can go for Swing Trade
⚠️ Over All Market condition is bad, Practice paper trading
🟢 If you have any questions regarding the setup, please feel free to leave your inquiries in the comments, and I will respond promptly.
BUY ONLY ABOVE 7955 DCB
⏱️ C.M.P 📑💰- 7498
🟢 Target 🎯🏆 – NA%
⚠️ Stoploss ☠️🚫 – NA%
⚠️ Important: Always Exit the trade before any Event.
⚠️ Important: Always maintain your Risk & Reward Ratio.
✅#Boost, #Like & #Follow to never miss a new idea! ✅
Disclaimer: I am not SEBI Registered Advisor. My posts are purely for training and educational purposes.
Eat🍜 Sleep😴 TradingView📈 Repeat 🔁
Happy learning with MMT. Cheers!🥂

MARKSANS Pharma – Is the Pullback Over? Watch for the Next Move!Hello everyone! I hope you’re all doing great! 😊 Today, I’ve got an exciting setup for you – MARKSANS PHARMA! After a period of consolidation, MARKSANS Pharma is showing signs of a potential breakout! The stock has been trading in a range between 251 (support) and 279 (resistance), and it looks like we’re finally seeing the bulls take control.
Here’s what’s happening:
The stock has recently tested the 279 resistance multiple times, and this time, it managed to break out with decent volume, signaling that the buyers are gaining strength. If this momentum continues, we could be on the verge of a strong uptrend!
Key Levels to Watch:
Short-Term Target: 279
Second Target: 305
Third Target: 330
Final Target: 357
Best Entry Zone: 251-240 (a pullback to this level could be a golden opportunity!)
Stop Loss: 217 (always manage your risk!)
Fundamental View:
MARKSANS Pharma has been posting solid quarterly earnings, with steady revenue growth driven by strong demand in key segments. The company continues to expand and capture market share, especially in emerging markets. While risks like raw material costs and competition exist, the company's financial health and growth trajectory suggest it has strong upside potential from here.
What’s Next?
As long as the price holds above the 251-240 range, the bullish momentum should continue. If we see a pullback towards this zone, it could provide another entry point before the stock moves higher.
What do you think? Will MARKSANS Pharma hit 357 soon? Drop your thoughts in the comments below!
Disclaimer: This analysis is for educational purposes only. Please trade responsibly and consult a financial advisor before making any decisions.
If you found this analysis helpful, don’t forget to like, follow, and share your thoughts in the comments below! Your support keeps me motivated to share more insights. Let’s grow and learn together—happy trading!

BLISSGVS Long Idea...BLISSGVS is consolidating in monthly chart. Taking trade after monthly confirmation (close above resistance) is good for safe trader
Personally I'm following it in daily charts to get a good early entry with some risk.
Lets see how it turns.
NOTE: NO idea of comapny Fundamentals. Just a technical take. Should plan trade with proper risk management.

ALIVUS - Breakout in Daily timeframeALIVUS (Alivus Life Sciences Limited, formerly Glenmark Life Sciences) - Breakout
Breakout observed in daily timeframe of Alivus, the company has a very good chart pattern and is in a good uptrend and recently broke out with good volumes. The breakout has also been retested and sustained. There could be a good upside in this stock. The company also has good fundamentals as written below.
Fundamentals.
MCap 14,299Cr
Stock P/E 32.4
Industry P/E 31.6
ROCE 28.1%
ROE 21.1%
NPM 20.6%
PEG Ratio 1.69
Debt 16Cr
Reserves 2,514Cr
EPS 36.05
Promoter holding 75%
API contribution 9MFY24
Chronic : 69%
Acute : 31%
Key Therapeutic areas contribution 9MFY24
Diabetes : 4%
CVS : 41%
CNS : 17%
Pain Management : 6%
Others : 32%
Business segments
The company has two key segments - Generics and Complex APIs (92% of FY23 revenue) and Contract Development and Manufacturing Operations (CDMO) (8% of FY23 revenue)

SYNCOMF FOR 3-6 MONTHSFor 3-6 Months
Fundamentally,
> Revenue Growth over 60% Quarterly
> Net Income Growth over 70% Quarterly
> EPS over 40% Yearly
Technically,
> Trading at the point of historically tested demand zone.
> Rising relative strength.
> Market Profile also suggesting an upmove.
> Current levels suggests buyer's entry with volumes.
Risk to Reward is 1:2.5 or more
Profit Targets: 22-28, Can book some profits at first target and then trail SL further.
Stop Loss: Below the current support, 19

Aurobindo Pharma - Long Trade SetupHello, Auropharma near the resistance level of 1275 . You can enter long when price is crossed above 1275.
*Confirmation of Trend Strength: A breakout above resistance indicates strong upward momentum and confirms the existing uptrend. This increases the likelihood of further price appreciation.
* Reduced Risk: Trading with the trend minimizes the risk of opposing a large number of market participants who are also betting on the continuation of the uptrend.
* Momentum: Breakouts often trigger a surge in buying pressure as traders rush to capitalize on the upward move, further propelling prices higher.
* Clear Entry Signal: The breakout provides a well-defined entry point, allowing traders to enter the market with precision and confidence.

Pharma Sector Shines Amidst Market WeaknessOn December 19, 2024, the pharmaceutical sector in India experienced a notable uptrend, with the Nifty Pharma index rising over 1.8%, making it the only sector to gain in an otherwise weak market.
The significant surge in delivery volume indicates a substantial influx of foreign capital into the sector.
◉ Several factors contributed to this positive movement:
1. Defensive Nature of the Sector: Amidst economic uncertainties, investors often turn to defensive sectors like pharma, which offer relatively lower risk compared to cyclical sectors.
2. Positive Market Sentiment: The overall sentiment for the pharma sector was buoyed by expectations of strong growth in the Indian pharmaceutical market, projected to reach $130 billion by 2030 and $450 billion by 2047.
3. Resilient to US Tariffs: India is a major supplier of generic drugs to the US, which could help shield this sector from tariffs due to its critical role in healthcare and the ongoing demand for affordable medications.
◉ Specific Stock Performances:
1. Ipca Laboratories NSE:IPCALAB : Up 5.4%
➖ The stock has formed a Bullish Pole & Flag pattern, and following a breakout, it is set to continue its upward movement.
2. Dr. Reddy's Laboratories NSE:DRREDDY : Up 4.3%
➖ The price has broken out of a falling trendline, signalling strong bullish momentum.
➖ This breakout, supported by a significant rise in trading volume, indicates growing investor interest.
3. Abbott India NSE:ABBOTINDIA : Up 3.4%
➖ The stock is currently in a consolidation phase within a parallel channel.
➖ After rebounding from the lower boundary, the price is now on an upward trend.
◉ Conclusion
The Pharma sector's strong performance is driven by key players' impressive gains, contrasting with the broader market's decline. This divergence makes the sector an attractive investment opportunity. With a promising outlook and strong fundamentals, the Pharma sector is well-positioned for continued growth.

MINDKIND PHARMA#MANKIND Pharma Limited
TF: 30 min
Pattern: Inverted head and shoulder
Buying range: in between 2680-2708 Targets: 2770, 2840, 2910
SL: 30 min candle closing below 2645
