USDCHF – M15 | Sell-Side Purge → Mitigation Rally → ContinuationPrice completed a textbook sell-side liquidity sweep, flushing weak longs below the range. The impulsive push down was real displacement. What followed is a forced bounce, driven by short covering and mitigation, not fresh demand.
Current price is retracing into a discounted supply / imbalance zone, where previous bearish orderflow originated. Structure remains bearish unless proven otherwise.
Market Narrative
Range highs → distribution
Sharp sell-side run = intent revealed
Bounce = mitigation into prior inefficiency
Execution Bias
Shorts favored into the marked retracement zone
Ideal entries on signs of rejection / bearish shift
Invalidation only on clean M15 acceptance above the green level
Targets
Recent sell-side lows
External liquidity below the range
Deeper discount expansion if momentum accelerates
Pitchforks

ETHUSD · 15M · SMC NarrativePrice has rallied cleanly into a premium HTF supply zone, tapping into a pool of resting buy-side liquidity above prior highs.
HTF Context
Previous range high clearly defined and respected.
Liquidity engineered above equal highs.
Current price trading in premium, far from value.
LTF Structure
Strong impulsive move up, low-quality pullbacks.
Final leg shows momentum expansion, typical of a liquidity run.
High probability this move is exit liquidity, not continuation.
Expectation
Brief push or reaction at highs to fully sweep buy-side.
Sharp bearish displacement post sweep.
Price to rotate lower toward:
Internal range low
Prior demand imbalance
HTF discount zone below
Execution Plan
No longs at these levels.
Patience for:
Liquidity sweep above highs
Bearish displacement
LTF MSS confirmation
Shorts favored after confirmation.
Scale partials at internal lows, runners into deep discount.

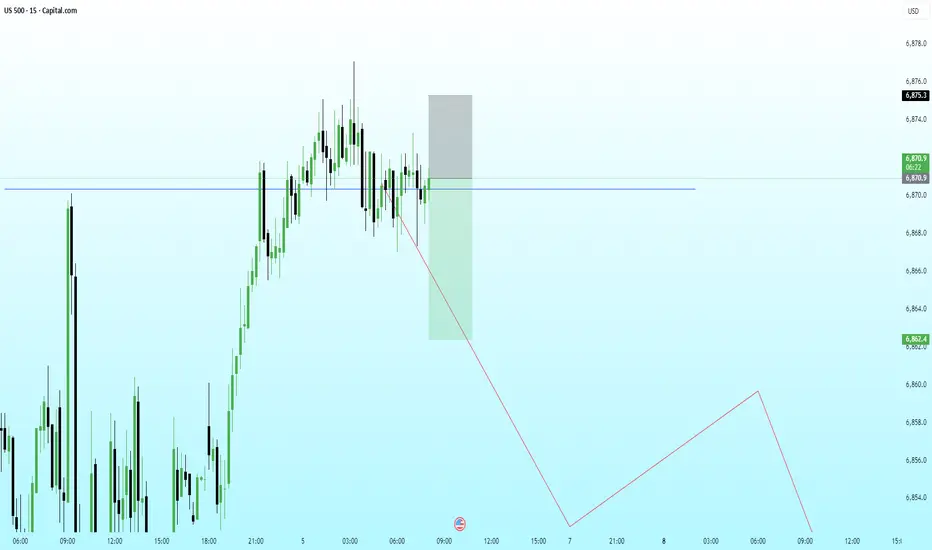
US500 – Clean Retest of Broken Structure With Bearish ContinuatiPrice has retested the broken structure level (blue line) and is now reacting inside a premium zone, suggesting sellers may re-enter the market from this region. The consolidation and repeated rejections indicate absorption of buy-side pressure.
With HTF context still pointing toward a deeper correction, this LTF retest offers a potential distribution setup before a continuation lower toward the next major liquidity pocket.
Bearish Path:
• Retest of the broken structure
• Reaction from premium supply zone
• LTF breakdown and structure shift
• Continuation toward downside liquidity + inefficiencies below
TATA communications - retest at demand zoneboth major and minor pitchforks showing the least resistance path of price is to go up.
1880 to 1900 appears to be a minor resistance
bullish price action is valid even if bars go along lower line of minor pitch fork.
but expecting a good bullish bar soon towards minor resistance
price closing below the lower line of minor pitch fork - SL can be taken

Bank Nifty for 2nd August 2023Bank nifty 2nd August predictions. Expecting the BNf to go down tomorrow. Levels are marked. Please enter below 45230.

Bank Nifty for 28th July 2023Bank Nifty demand and supply zones and future non-linear support-resistance

BankNify Levels for 27th July 2023 and much more.....Bank nifty Levels for 27th July 2023. Completion Start of the 3rd elliot wave and the path of the wave using pitch fork projection.

SOLANA - Schiff Pitchfork PatternSOL 1-hr. Chart Analysis
Basically, Schiff's Pitchfork have three lines, and each line starts from one of the pivot points. The lines are called the UPPER LINE (UL), the LOWER LINE (LL) and the MEDIAN LINE (ML). The pitchfork is intended as a quick and easy way for traders to identify possible levels of SUPPORT & RESISTANCE for an asset price RANGE.
This cycle of Trend-Line i check out from 1st july to 10 july for CRYPTOCAP:SOL Supoort and Resistance signals of 18, 19 20 to 22 dollar price ranges. It indicates that soon it will be reach out again their lowest support mark of $18 price range within next 24hrs.
Always #DYOR & Trade wisely by using #StopLoss
MUST LIKE & SHARE it..
SShort

DJI Range Breakdown DJI has broken down of a range consolidation and as per range the downside targets are marked on the charts.
Most of the other details are clearly marked on the charts and overall weakness is visible in post today's candle close in US Market
Previous DJI analysis are linked in related idea section

MAZDOCK is a buy at 466 levelbe ready to buy this stock when it reaches the confluence support LM of pitchfork, trend line, 38.2% fib., and AVWAP

PAGEIND...........get ready to buy this gem around 33.5/34.5k buy this gem of a stock when it reaches the confluence support of yellow channel median, white PF median, 61.8% fib and S2 PP......33.5/34.5 K range

DIVISLAB becomes a BUY at 2760 approxi will think of buying this stock when it reaches the confluence support of yellow trend line, UM of white pitchfork and AVWAP........2760 approx

JCHAC becomes a BUY at 950 approxi will buy this stock when it reaches the confluence support of PF median, S<>R and AVWAP.......950 approx..
JLong

BAJAJ FINSERV could slide down to 1162I am seeing the stock heading down to 1162....confluence support of white PF median, yellow PF median and 88.6%

BAJAJFINANCE is an excellent buy at 5525 levelbe ready to buy this blue chip when it reaches the red dot level....approx.5525....
red dot is the confluence of S1 PP, blue channel base, white PF median, yellow PF warning line, AVWAP and 88.6% fib.level

ZENTEC has a target of 250the confluence resistance of white PF median, 1/4 GANN fan line and 127.2%..............250 approx....is my target

YESBANK has a target of 41.5Stock has a crystal clear target of 41.5.....notice the confluence of S<>R, AVWAP and UM

KILPEST has a target of 641stock has a CYPHER pattern target of 641....which is also confluence of two medians

Looks to be a potential short #DAX40Current level can be a short entry point will a small position size. But 14600 looks to be a better zone as 14800 is the nearby resistance.

Not expecting price to cross 61.8% retracement (33520) of the enNot expecting price to cross 61.8% retracement (33520) of the entire fall
U

Not expecting price to cross 61.8% retracement (33534)Not expecting price to cross 61.8% retracement (33534) of the entire fall

XAUUSD Market Prediction for the next week i.e. from 12th Sep'22
For Education purpose only.
Looks like the Sellers are assuming higher and higher positions only to crash the Gold Market down. This idea can further be layered with the intersection of Price with the median of the Pitchfork drawn with the major edges of the Market. The upward line of Blue modified pitchfork can suggest the next possible short entry.
Points to indicate that pivot 4 may be the Market edge for Short entry.
Price respecting the below classes of information simultaneously.
1. Frequency shift line in Red horizontal line.
2. Median of Pitchfork drawn with respect to vectors 1,2 & 3 (at pivot 4).
3. Divergence of Price w.r.t RSI between pivots 2 & 4.
4. Steep fall immediately after touching pivot 4.
Entry: 1715 (Now)
Stop Loss: 1745
Target: 1655

CRUDEOIL(USOIL) Intraday Levels 11-15-Jul-22(Weekly)Try to find best entry levels for based on market struture and pa.
Important levels Marked in chart, wait to price reach that levels and check for rejection
from upside/downside in smaller time frames then only take trade.
Can comment or ping me for any query.
All views for Educational purpose, Trade at your own risk
