PNB: Buy on Retest Level1. PNB has been an underperformer for a long time.
2. Looking at the strength at the current price, the buying opportunity appears attractive with a very small stop-loss.
3. This is not a very high-conviction setup since there is an overhead trendline resistance.
4. Since the risk is minimal, it is worth taking the opportunity. If it reverses, we accept the stop-loss and move on.
⚠️ Disclaimer: This is NOT a buy/sell recommendation for learning ONLY. Views are personal. Please, do your due diligence before investing. ⚠️
🔥 Happy Trading! 🚀
Pnb

Punjab National Bank: A Technical Setup Worth WatchingPunjab National Bank is trading at ₹122.80 and nearing a test of its long-term downtrend line on the monthly chart. With RSI climbing back above 60, the stock is showing signs of renewed bullish momentum.
Punjab National Bank (PNB), one of India’s leading public sector banks, is currently presenting an intriguing technical setup that could serve as a valuable case study for traders and investors. As of early November 2025, the stock is trading around ₹122.80 and is approaching a critical juncture on its monthly line chart—a potential test of its long-term downtrend line.
🔹 The Downtrend Line: A Barrier to Watch
In technical analysis, a downtrend line connects a series of lower highs and acts as a dynamic resistance level. When a stock approaches this line, it often faces selling pressure. However, if the stock manages to break above and sustain beyond this line, it signals a potential reversal in trend—from bearish to bullish.
PNB’s current price action suggests it is close to challenging this long-term resistance, which has historically capped upward movement. A successful breakout would not only mark a technical victory but could also shift investor sentiment in favor of the stock.
🔹 RSI Momentum: Strength Rebuilding
The Relative Strength Index (RSI) is a momentum indicator that helps gauge the strength of price movements. PNB’s RSI has already traded above 70 once, indicating strong bullish momentum in the recent past. Although it pulled back, it has now rebounded above 60, suggesting that buying interest is returning.
This RSI behavior is significant. A move above 50 typically signals bullish territory, and a climb toward 70 reflects increasing strength. In the context of a potential trendline breakout, this momentum could provide the necessary fuel for a sustained upward move.
🧠 Educational Insights
Trendline Tests on Higher Timeframes: Monthly charts offer a broader view of market sentiment. A breakout on this timeframe carries more weight than short-term fluctuations.
Momentum Confirmation: RSI above 60, especially after a prior move above 70, indicates that the stock is regaining strength. This supports the case for a breakout rather than a rejection.
Price-Action Focus: Watching how the stock behaves around the downtrend line—whether it consolidates, spikes, or pulls back—can offer clues about the next move.
📌 Learners Takeaway
Punjab National Bank’s current setup is a classic example of a stock approaching a technical inflection point. With the price near ₹122.80 and RSI showing renewed strength, traders should monitor the monthly chart closely. A confirmed breakout above the long-term downtrend line could signal a major trend reversal, offering potential upside for those positioned early.
Live chart Example to keep Track

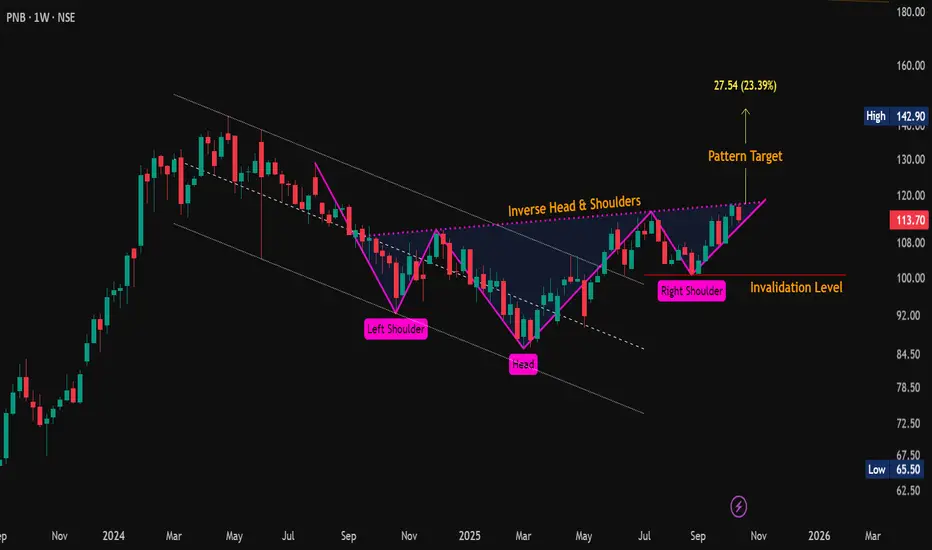
#PNB | Inverse Head & Shoulders Bullish SetupCMP: 113.70
🔼 Key Resistance Levels: 118 / 120 / 143
🔽 Key Support Levels: 113.30 - 110.50 / 107.30
❌ Invalidation Level: 100.60 (Weekly Close Below)
✴️ Breakout Point: Weekly close above the neckline (Pink dotted line) 👀
🎯 Pattern Target: 145 (+27% from CMP)
#PNB | #InverseHeadAndShoulders | #ChartPatterns | #PriceAction | #SwingTrading
📌 Disclaimer: This analysis is shared for educational purposes only. It is not a buy/sell recommendation. Please do your own research before making any trading decisions.
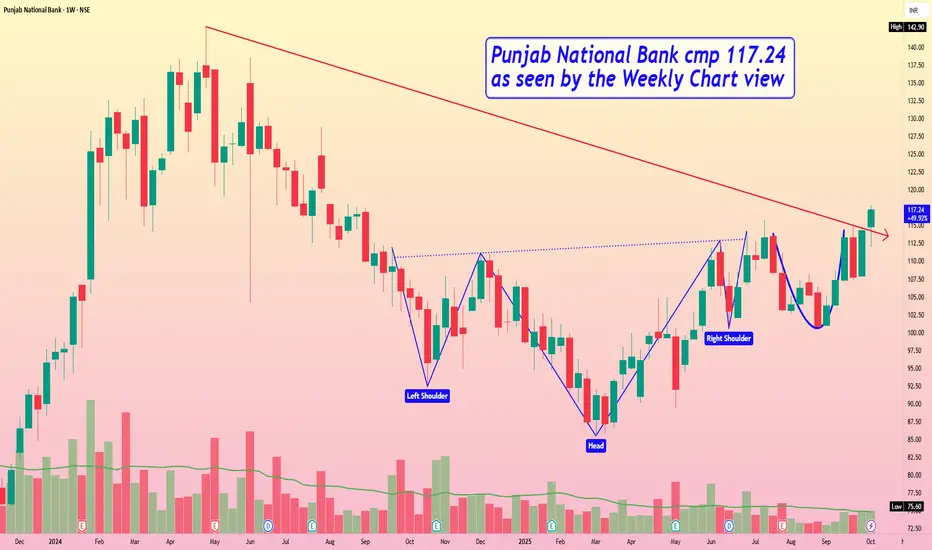
Punjab National Bank cmp 117.24 by Weekly Chart viewPunjab National Bank cmp 117.24 by Weekly Chart view
- Weekly basis Support levels seen at 107 > 98 > 87
- Weekly basis Resistance levels at 124 > 133 > ATH 142.90
- Bullish Head & Shoulders followed by Rounding Bottoms formed
- Volumes seen getting in close sync with the average traded quantity
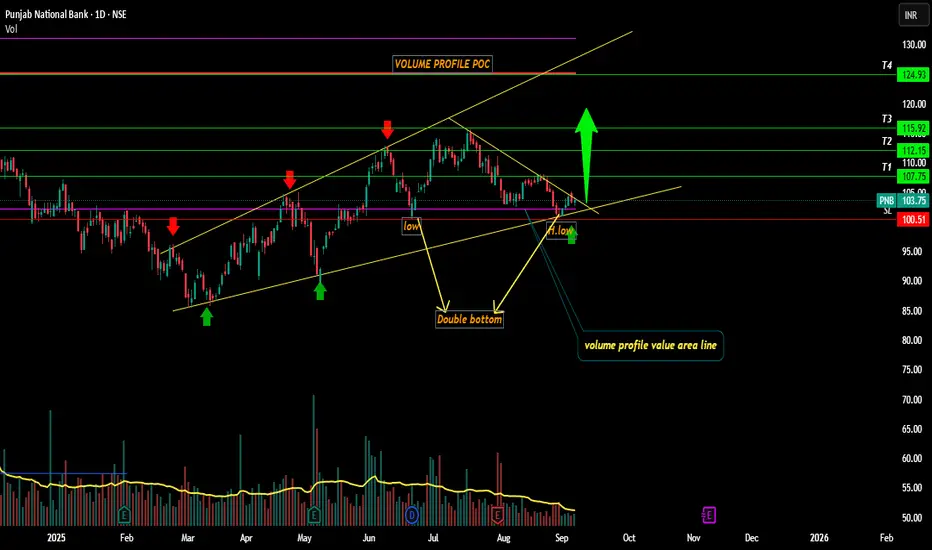
PNB looking Bullish ahead??!!Kindly check out the chart for the explanation.
Reasons-
1. Trendline Support
2. Double bottom
3. Fixed volume profile value area support
4. Low and lower low
5. PSU BANK index too looking bullish , check out idea below
Close below 100.52 - invalidation level
Targets mentioned @ chart.
Just my view ...not a tip nor advice!!!!
Thank you!!!
Public sector banks ready for the rally soon??!!!Reasons for my view-
1.Rounding bottom,
2.Inverted Head and Shoulders pattern,
3.High and higher high formation
PSU bank index -
72.57% Constituted by
SBIN(33.44%),
BANKBARODA(14.79%),
PNB(12.2%),
CANBK(12.14%)
Mark these 4 stocks and add to watch list!!!
Just my view ...not a tip nor advice!!!!

Thematic TradingIntroduction
In an age of rapid technological advancement, shifting demographics, and evolving economic paradigms, thematic trading has emerged as a powerful investment strategy. Rather than focusing solely on short-term earnings, cyclical sectors, or market timing, thematic trading taps into long-term megatrends—powerful, structural shifts that shape the global economy and society over decades.
Whether it’s the green energy revolution, the rise of artificial intelligence (AI), urbanization, aging populations, or the digitalization of finance, these themes are not fads. They are fundamental transformations, and thematic traders aim to capitalize early and ride the wave of these secular changes.
This article dives deep into the what, why, and how of thematic trading, exploring the key global megatrends, strategies to implement, risk considerations, and tools used by traders and investors alike.
1. What is Thematic Trading?
Definition
Thematic trading is an investment approach where capital is allocated based on long-term societal, environmental, economic, or technological themes, rather than conventional metrics like sector rotation or company fundamentals alone.
How It Works
Investors identify global or regional megatrends—broad, multi-year narratives—and invest in stocks, ETFs, or mutual funds expected to benefit from these themes. The strategy often involves:
Multi-sector exposure
High-growth companies
Emerging industries
Global diversification
Thematic vs Sectoral Investing
While sectoral investing focuses on performance within traditional sectors like energy or healthcare, thematic investing cuts across multiple sectors tied to a common theme (e.g., EVs include tech, metals, and auto sectors).
2. The Rise of Long-Term Megatrends
What Are Megatrends?
Megatrends are powerful, transformative forces shaping the world over the next several decades. These are not economic cycles; they are global structural shifts with far-reaching implications.
Examples of Megatrends:
Megatrend Description
Climate Change Push for decarbonization, clean energy
Digital Transformation Rise of AI, IoT, blockchain, cloud
Demographic Shifts Aging populations, rising middle class
Urbanization Mega-cities, infrastructure booms
Health & Wellness Biotechnology, personalized medicine
Financial Innovation Digital payments, DeFi, fintech
Geopolitical Realignment China’s rise, reshoring, defense
These megatrends are not mutually exclusive and often overlap, creating complex investment landscapes.
3. Why Thematic Trading Is Gaining Popularity
i. Structural Alpha
Unlike cyclical alpha (outperformance during a specific cycle), thematic trading offers structural alpha by investing in long-duration tailwinds.
ii. Democratized Access via ETFs
Thematic ETFs and mutual funds have made it easier for retail investors to access emerging megatrends without deep sectoral knowledge.
iii. Storytelling & Narrative Appeal
Themes are easier to grasp than abstract financial metrics. "Investing in EVs" or "AI revolution" appeals more than "mid-cap industrials."
iv. Millennial and Gen Z Influence
Younger investors prefer mission-driven, ESG-conscious investing and are more likely to favor themes like sustainability and innovation.
4. Key Thematic Megatrends (2025 and Beyond)
1. Clean Energy & Decarbonization
Solar, wind, hydrogen, and battery tech
Government policies: Net Zero by 2050
Beneficiaries: Tesla, Enphase Energy, Brookfield Renewables
2. Artificial Intelligence and Automation
Generative AI, robotics, computer vision
Used across healthcare, finance, defense
Beneficiaries: Nvidia, Palantir, UiPath
3. Cybersecurity & Data Privacy
Rising cyber threats in a connected world
Digital identity and zero-trust security
Beneficiaries: CrowdStrike, Fortinet, Zscaler
4. HealthTech & Biotechnology
Personalized medicine, gene editing (CRISPR)
Telemedicine, wearable health tech
Beneficiaries: Illumina, Teladoc, Moderna
5. EV Revolution and Mobility Tech
EV adoption, charging infra, autonomous vehicles
Raw materials (lithium, cobalt) play key roles
Beneficiaries: Tesla, BYD, Albemarle, ChargePoint
6. Space Economy
Satellite internet, asteroid mining, tourism
NASA, ISRO, and private players like SpaceX
Beneficiaries: Virgin Galactic, Rocket Lab
7. Fintech & Blockchain
Digital wallets, DeFi, crypto infrastructure
Rise of CBDCs (Central Bank Digital Currencies)
Beneficiaries: Coinbase, Block, Ripple Labs
8. India & Emerging Market Renaissance
Demographics, digital economy, infrastructure
India's stack (UPI, Aadhaar) is a global model
Beneficiaries: Infosys, Reliance, HDFC Bank
5. How to Trade Thematically
1. Direct Stock Picking
Choose individual companies that are leaders or disruptors within a theme.
Pros: High upside, control
Cons: High risk, requires deep research
2. Thematic ETFs
Invest in curated ETFs like:
iShares Global Clean Energy ETF (ICLN)
ARK Innovation ETF (ARKK)
Global X Robotics & AI ETF (BOTZ)
Pros: Diversified exposure, easy to trade
Cons: Fees, sometimes over-diversified
3. Mutual Funds or PMS (India)
Professional fund managers invest based on themes like ESG, innovation, or China+1.
Pros: Expert management
Cons: High minimum investment, fees
4. Options & Derivatives
Advanced traders can use LEAPS options (long-term options) on thematic stocks to leverage small capital.
Pros: High leverage
Cons: High risk, complex
6. Tools and Analysis for Thematic Trading
A. Trend Identification
Use:
News aggregators (Google Trends, Flipboard)
Social sentiment (X/Twitter, Reddit)
Research reports (McKinsey, BCG, ARK Invest)
B. Screening Tools
Screener.in (India)
Finviz (US)
ETF.com (for Thematic ETFs)
C. Volume Profile & Market Structure
Analyze volume-by-price, support/resistance zones, and institutional accumulation in thematic stocks.
D. Fundamental Ratios
While thematic plays are growth-focused, monitor:
Revenue growth rate
TAM (Total Addressable Market)
R&D spend
Debt levels
7. Risks of Thematic Trading
i. Overvaluation
Themes can lead to hype-driven rallies. E.g., 2021 EV stocks were overvalued before correcting heavily.
ii. Narrative Risk
The theme may not play out as expected (e.g., metaverse hype).
iii. Regulatory Shocks
Themes like crypto and biotech are sensitive to global regulations.
iv. Concentration Risk
Some thematic ETFs are heavily weighted toward a few large-cap stocks.
v. Liquidity Risk
Smaller thematic stocks might have low trading volumes, impacting exits.
8. Case Studies: Thematic Trading in Action
Case 1: EV Revolution (2019–2024)
Theme: Mass adoption of EVs
Key Drivers: Climate change, subsidies, Tesla’s success
Winners: Tesla (10x), BYD, lithium producers
Losers: Traditional automakers slow to adapt
Case 2: AI Boom (2023–2025)
Theme: Generative AI revolution post-ChatGPT
Winners: Nvidia (chips), Microsoft (OpenAI), AI ETFs
Risks: Hype cycles, data privacy issues
Case 3: China+1 in India
Theme: De-risking supply chains from China
Winners: Indian manufacturing (Dixon Tech, Tata Elxsi)
Boosters: PLI schemes, FDI inflow
Conclusion
Thematic trading offers a fascinating bridge between imagination and investment. By identifying and betting on structural megatrends early, traders can unlock outsized returns while aligning with broader societal shifts.
However, this strategy demands vigilance, adaptability, and discipline. Not every theme succeeds, and hype can distort fundamentals. But with the right tools, research, and conviction, thematic trading can be a transformative strategy in your portfolio.
Technical Analysis with AI ToolsWhat is Technical Analysis?
Technical Analysis (TA) is the study of price and volume data to forecast future market trends. It assumes that:
Price discounts everything – All information (news, sentiment, fundamentals) is already reflected in the price.
Prices move in trends – Uptrends, downtrends, and sideways trends persist.
History repeats itself – Price patterns and human psychology create repeatable patterns.
Traders use charts, indicators, and patterns like head and shoulders, triangles, trendlines, etc., to make trading decisions.
However, TA has limitations:
Subjectivity in pattern recognition
Reliance on lagging indicators
Difficulty adapting to real-time market shifts
That’s where AI-based tools step in.
💡 What is Artificial Intelligence in Trading?
Artificial Intelligence in trading refers to computer systems that can learn from data, identify patterns, and make trading decisions with minimal human intervention.
The key subfields of AI used in trading include:
Machine Learning (ML): Algorithms that improve through experience (e.g., linear regression, decision trees, neural networks)
Deep Learning (DL): Complex neural networks mimicking the human brain; used for advanced pattern recognition
Natural Language Processing (NLP): Used to analyze news sentiment, earnings reports, and social media
Reinforcement Learning: AI that learns through trial and error in dynamic environments (e.g., Q-learning in trading bots)
When applied to technical analysis, AI processes historical price, volume, and indicator data to detect hidden relationships and optimize trading signals in real time.
🤖 How AI Enhances Technical Analysis
1. Pattern Recognition at Scale
Traditional TA relies on human eyes or predefined rules to identify chart patterns.
AI, particularly deep learning (e.g., CNNs – Convolutional Neural Networks), can scan thousands of charts simultaneously and identify complex patterns (like cup-and-handle or flag patterns) faster and more accurately.
2. Backtesting with Intelligence
AI allows advanced backtesting of strategies using years of tick-by-tick or candle-by-candle data.
Unlike static rules, ML-based strategies can adapt their weights or parameters over time based on the evolving nature of the market.
3. Nonlinear Indicator Relationships
Classic TA uses indicators independently. But markets are nonlinear.
AI models learn nonlinear relationships among multiple indicators and create composite signals that outperform single-indicator strategies.
4. Sentiment-Infused Technical Models
AI tools can combine technical signals with NLP-based sentiment analysis from Twitter, Reddit, or news headlines.
This fusion helps predict breakouts or reversals that aren’t visible in price action alone.
5. Real-Time Decision Making
Traditional TA often suffers from lag.
AI-powered systems like algorithmic trading bots can respond to price movements in milliseconds, executing trades without delay.
🔧 AI Tools and Platforms for Technical Analysis
✅ 1. MetaTrader 5 with Python or MQL5 AI Modules
Integrates technical indicators with custom AI models
Python API allows users to run ML/DL models within MetaTrader
Widely used by forex and commodity traders
✅ 2. TradingView with AI-Based Scripts
Offers Pine Script for strategy development
Developers can integrate AI signals via webhook/API
Visual pattern recognition and crowd-shared AI scripts
✅ 3. QuantConnect / Lean Engine
Open-source algorithmic trading platform
Allows users to train ML models and backtest strategies
Supports data from equities, options, crypto, futures
✅ 4. Kaggle & Google Colab
Ideal for building AI-based technical analysis tools from scratch
You can train models using pandas, scikit-learn, TensorFlow, etc.
Excellent for custom strategies, like classifying candle patterns
✅ 5. Trade Ideas
Proprietary AI engine called “Holly” scans 60+ strategies daily
Uses ML to learn which trades worked yesterday and adjust accordingly
Includes real-time alerts, performance tracking, and automated trading
✅ 6. TrendSpider
AI-powered charting platform
Automatic trendline detection, dynamic Fibonacci levels, heat maps
Smart technical scanning and pattern recognition
🧠 AI Techniques Applied in Technical Analysis
1. Supervised Learning
Used when historical data is labeled with desired outcomes (e.g., up or down after a candle close).
Algorithms: Logistic Regression, Random Forest, Support Vector Machine (SVM)
Use Case: Predict next candle movement based on RSI, MACD, price, etc.
2. Unsupervised Learning
Used for pattern discovery in unlabeled data.
Algorithms: K-means, DBSCAN, Autoencoders
Use Case: Cluster similar stock behavior, detect anomalies, group market conditions
3. Reinforcement Learning
Learns from rewards/punishments in dynamic environments (e.g., financial markets).
Algorithms: Q-learning, Deep Q-Networks (DQN)
Use Case: Train bots to buy/sell based on profit performance in changing conditions
4. Deep Learning
Excellent for modeling time-series data and pattern recognition.
Algorithms: LSTM, GRU, CNN
Use Case: Predict future prices based on sequential price movements
🛠 How to Build an AI-Based Technical Analysis System (Simplified)
Step 1: Data Collection
Historical OHLCV data from sources like Yahoo Finance, Binance, Alpaca
Add technical indicators like RSI, MACD, ATR, etc.
Step 2: Feature Engineering
Normalize or scale features
Create additional features like percentage change, volatility
Step 3: Model Selection
Choose ML/DL models: Random Forest, XGBoost, LSTM
Train with price data labeled as “up”, “down”, or “flat”
Step 4: Backtesting
Simulate how the model would have performed in the past
Use performance metrics like Sharpe ratio, win rate, drawdown
🧾 Conclusion
Technical analysis has entered a new era, powered by Artificial Intelligence. Traders are no longer limited to static indicators or gut feeling. AI tools offer the ability to process vast amounts of data, detect patterns invisible to the human eye, and adapt strategies dynamically.
However, success doesn’t come automatically. To benefit from AI in technical analysis, traders must combine domain knowledge, data science skills, and market intuition. When used responsibly, AI can be an invaluable ally, not a replacement, in your trading journey.
Trading master class with experts ➤ Definition:
Trading is the act of buying and selling financial instruments (like stocks, commodities, currencies, or derivatives) with the intention of making a profit over short to medium timeframes. Traders do not necessarily hold positions for the long term. They react to price movements and market trends.
➤ Core Features of Trading:
Short-Term Focus: Hours to weeks.
Active Management: Constant monitoring of charts, news, and prices.
Profit from Price Movement: Traders capitalize on volatility and momentum.
Risk Management: Stop-loss and position sizing are vital.
Types: Intraday trading, swing trading, scalping, positional trading.
➤ Pros:
Quick returns possible.
Flexibility in strategy.
Can be automated (algo/quant trading).
Capitalize on both bullish and bearish markets.
➤ Cons:
High risk due to leverage and volatility.
Emotionally draining.
Requires high skill and market understanding.
Brokerage, slippage, and taxes eat profits if not careful.

Trade Like a Institutions Trading is the act of buying and selling financial instruments (like stocks, commodities, currencies, or derivatives) with the intention of making a profit over short to medium timeframes. Traders do not necessarily hold positions for the long term. They react to price movements and market trends.
➤ Core Features of Trading:
Short-Term Focus: Hours to weeks.
Active Management: Constant monitoring of charts, news, and prices.
Profit from Price Movement: Traders capitalize on volatility and momentum.
Risk Management: Stop-loss and position sizing are vital.
Types: Intraday trading, swing trading, scalping, positional trading.
➤ Pros:
Quick returns possible.
Flexibility in strategy.
Can be automated (algo/quant trading).
Capitalize on both bullish and bearish markets.
➤ Cons:
High risk due to leverage and volatility.
Emotionally draining.
Requires high skill and market understanding.
Brokerage, slippage, and taxes eat profits if not careful.

Punjab National Bank Flag Breakout Setup📈 Punjab National Bank (PNB) – Flag Breakout Setup
Observed a classic flag pattern on the daily chart after a strong pole move in 2023–24.
✅ Breakout above the channel confirmed with price action near 113.
✅ Entry plan: Watch for daily close >113 with volume.
✅ Stop-loss idea: Below 106.
✅ Target 1: 140 (first swing resistance).
✅ Measured move projection targets up to ~198 possible based on full flag pole.
Volume confirmation and broader market context will guide the actual trade trigger.

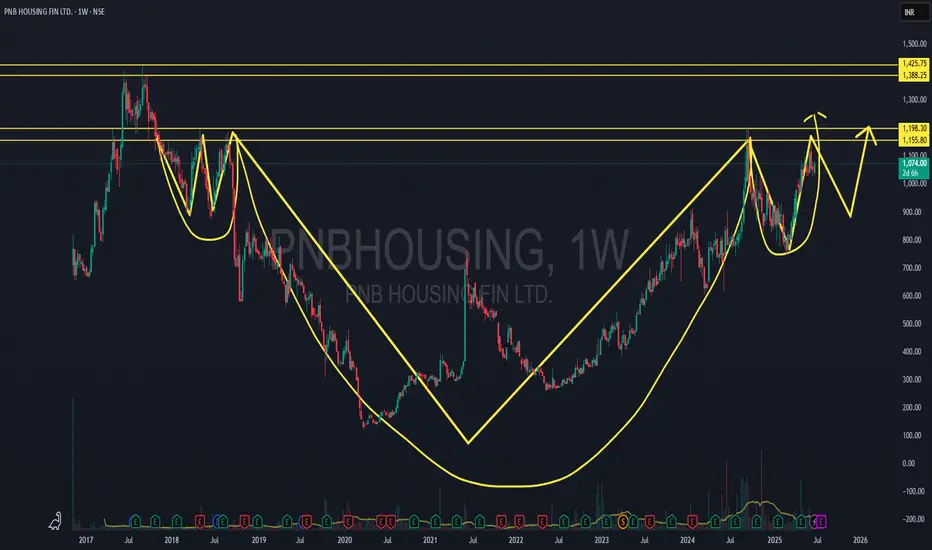
CUP in Making & H&S in PNB HOUSING FinanceGood to go Long as PNB in Making of CUP &
ready for give Breakout of Inverse H&S pattern
Safe Traders Enter after one Pattern Conformation @ 1200 on Daily Closing with Big Bull candle
CUP Pattern Breakout at 1430-1450 Range..
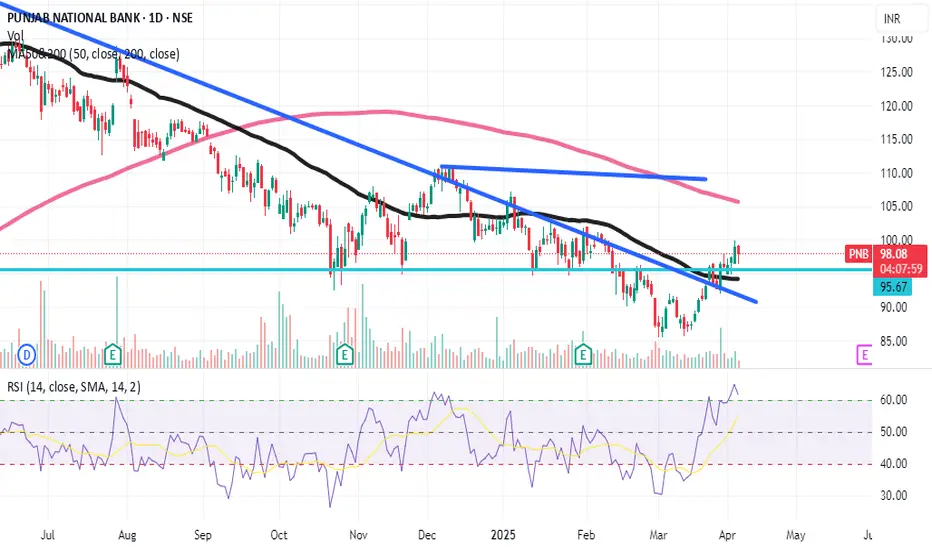
PNB is really Trend shifting?High probability that trend shifting can be seen in PNB bank. On daily chart high probability of trend reversing with the support of 50 EMA. Also stock is trading above the resistance area. Can take long entry above 99 for the first target between 112-115. later we can trail the SL .This is for your educational purpose only.
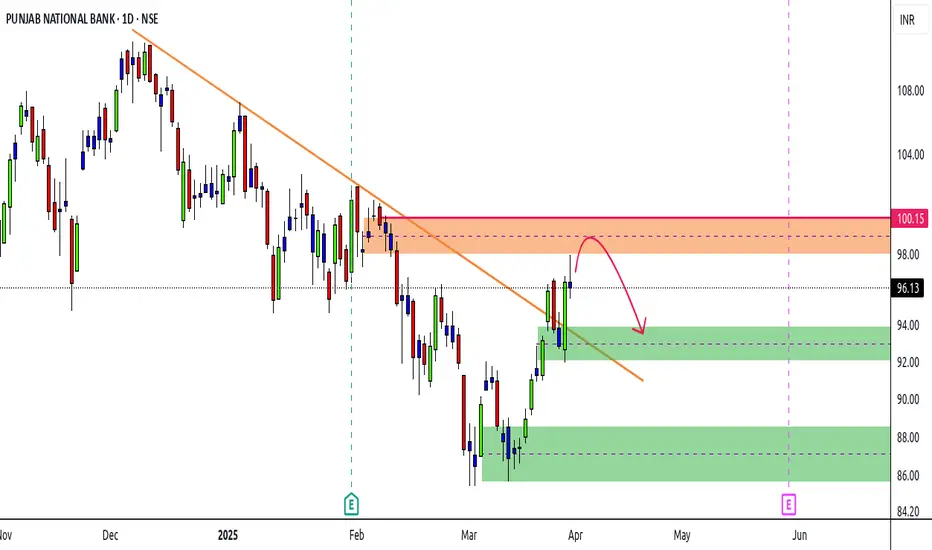
PNB | Possible PullbackStock making Higher Highs / Higher Lows in daily
Currently in DBD supply zone
Supply area from 98 - 100
Opportunity for a bearish move
Confirmation required on a lower TF
Downside 1st Target 93
Upside SL 101
PNB - PatternSelf Explanatory chart
Getting ready to reach a strong resistance area of 108
Possible fall from this trend line and supply zone till 101 - 102
Then again a trend up

CUB: 5 year trendline breakout? 4. CUB
➡️had been adding since September
➡️5 year trendline breakout possible
➡️ highest ever turnover and sales
➡️may move like PNB as NPA is reducing as well and has a similar structure
➡️may benefit from the impending RBI rate cut

Punjab National Bank#pnb Punjab National Bank is making higher highs formation on chart,
Upside possible till 112-115. EMA Making Gloden Crossover
I have attached the chart for your reference.

NSE PNB is Preparing for a Corrective BreakoutTimeframe: Daily
NSE PNB is currently facing strong resistance at the 200 EMA on the daily timeframe. The price has completed a corrective W-X-Y formation on the daily chart, and the ATR has increased to 2.91.
The stock has reached the final wave V of C of (Y) at 103.62 and has started moving upward. If this marks the end of the correction, the price needs to break and sustain above wave iv at 112 . Upon holding above this level, traders can aim for targets of 117 – 126 – 137+. Even if the price falls below wave (Y), traders can only buy after the breakout of 112.
Stay tuned for further updates!

PNB - The End could be a New Beginning.Punjab National Bank is in a bullish structure from June 2022 & now have completed wave 4 which has meet with reverse parallel channel drawn from connecting wave 1 high with wave 3 high (usually the best point for wave 4 to end) & this low of wave 4 is exactly 0.382% retracement of Wave 3 so now we looks all set for wave 5 impulse to begin a close above 112 will be 1st confirmation & breaking above this red channel around 120 will be bigger confirmation which could take us to 230 which is (Wave 1 is equal to Wave 5 measurement) & channel top.
Everyone in market is trying to find top in Index whereas stocks are just getting started so the market can stay irrational longer than you can stay solvent.


PNB - LONG BUYPANJAB NATIONAL BANK - LONG @ 128 - PSU sectors are also moving high.
Technically also bulling view
fundamentally also company very strong
new investments like mutual funds investors increasing.

PNB, Intraday View for 22-MayAfter a strong break of structure, the price has been trapped in the compression zone. Also today the price is rejected by the resistance level of 128. The probability of a negative candle is more than 65%. For Intraday the level of 128 and 124 is important for trade decisions.
Intraday 5m | Trend Negative
Disclaimer: This is my pre market analysis and my trading journal. Not a suggestion to buy or sell.

PNBHOUSING may break up move after Consolidation a rangeThis stock consolidating from couple of days and respect a level of758.40 .If it cross 780 level with good volume then we can see a good up trend .
