Is PNB on a new support line? Swing Trade opportunity!!!PNB is retesting the previous resistance level, if it sustains and marches upward it will become the support!!!
Good volumes.
Can enter at current market price.
Target - 55/60/70
SL - 35
Above 70 it will be a delight!!!
Need greater patience, since it is a PSU banking stock it will rise on a gradual basis!!!(Maybe more than 3 months)
Note: All levels are only for educational purpose.
Follow and show your support!!! _/\_
Pnb

Punjab National Bank - Long Setup, Move is ON...#PNB trading above Resistance of 130
Next Resistance is at 153
Support is at 104
Here are previous charts:
Chart is self explanatory. Levels of breakout, possible up-moves (where stock may find resistances) and support (close below which, setup will be invalidated) are clearly defined.
Disclaimer: This is for demonstration and educational purpose only. This is not buying or selling recommendations. I am not SEBI registered. Please consult your financial advisor before taking any trade.

Punjab National Bank - Long Setup, Move is ON...#PNB trading above Resistance of 104
Next Resistance is at 130
Support is at 86
Here are previous charts:
Chart is self explanatory. Levels of breakout, possible up-moves (where stock may find resistances) and support (close below which, setup will be invalidated) are clearly defined.
Disclaimer: This is for demonstration and educational purpose only. This is not buying or selling recommendations. I am not SEBI registered. Please consult your financial advisor before taking any trade.

PNB F&P BREAKOUTPNB is breaking flag pattern
good volume building up
trading above 20 ema
EDUCATIONAL IDEA

PNB At Major Make or Breakout levels.PNB at Major levels, with momentum and with little support from Sectors.
Conservative Traders can enter after Breakout and Retest.
Anyway stock is towards Monthly Supply which is on TOP.
Have your own Analysis too.
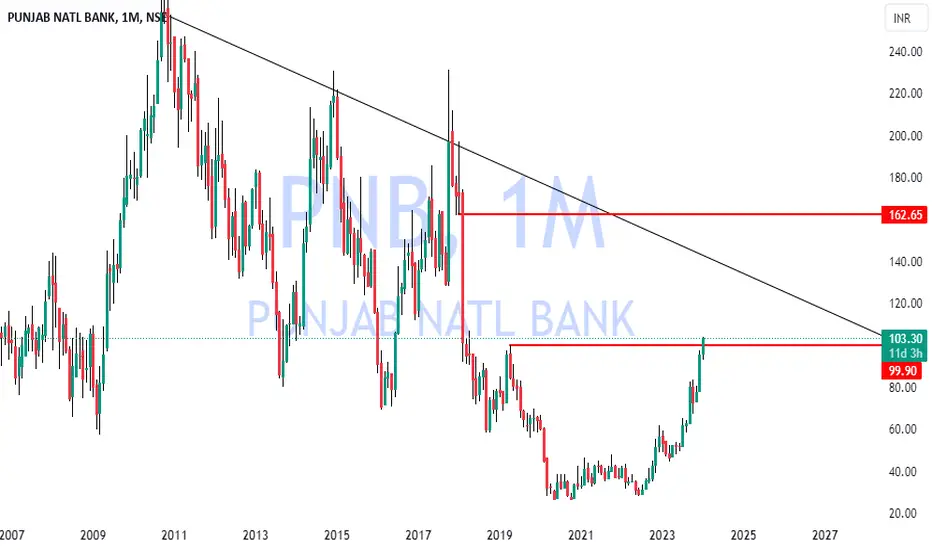
PNBPNB-EQ
-Strong Breakout Candidate
-Round Bottom Structure Breakout
-Strong Range Accumulation
-Massive Volume Buildup
-Performing Good but had Bad Reputation
-Just for Trading & Swing not for Investment
Entry 🟢: Above 129
Target 🎯: 164, 197, 220 ++
Stop loss 🔴: 105 WCB
Remark: Short Term
⚠️ Disclaimer : Chart & Levels are for educational purposes. Trade according to your Risk or consult with your Finance Advisor.

20 Jan ’24 — Probably the first working Saturday for a TraderNifty Analysis - Stance Neutral ➡️
Recap from yesterday: “The last 3 candles almost gave away the clue that bearishness was ending. We would still like to see how Nifty will open tomorrow. Ideally, it should open above 21698 i.e. within the channel to cement the idea that Bears are thrown out of control.”
4mts chart
Open was right at the trendline and it acted as a resistance. Nifty was unable to breach it and it meant we would have either a flat or negative day. A lot of interesting things happened today.
NiftyIT moved down and ended with -371pts ~ 1.00%. Most of them would not have noticed IT falling.
The banks outperformed today, Kotak +2.41%, AUBANK +2.32%, CANBK +2.22%, PNB +2.74% & ICICI +0.95%. If not for these, Nifty would have had a serious fall today
Nifty’s low today was lower than yesterday’s low and it has closed the gap from 18th Jan.
The OTMs of both Nifty and BankNifty were trading in green and sometimes had unusual spikes often seen during low liquidity. Despite the quick announcement to have a working day today - the actual traded volumes or contracts were not that bad either.
Initially, we thought DII and FII would not participate, but they ended up selling 719 & 545 crores today
63mts chart
Nifty was unable to get into the ascending channel despite results from RELIANCE and major banks. We suspect some weakness is haunting N50. It could completely be news/event-driven or related to the build-up for the budget session. The selling figures from the institutions may be because of this. From a technical analysis perspective, Nifty looks range bound between 21913 and 21491. Falling below 21491 could auto-trigger further shorts and it could even be an avalanche. Our stance remains neutral for Tuesday, also note that Monday will be a holiday for the consecration of Ram Mandir in Ayodhya.

PNB C&H BREAKOUTPNB breaking c&hpattern
with huge volume and good rsi
MACD crossover done
educational idea only

#PNB LONG TRADE IDEA SETUPGreetings Folks,
today I have prepared a setup of PNB on NSE
the analysis is as follows-
-the price recently broke out of a bullish pattern
- The price is kinda stretched right now, can use some temporary support for more momentum
- i have marked the most immediate strong support zone
- this trade setup might play in 2-3 days as the support zone is not in reach of price right now
don't play with fire, always use a predefined stoploss

DON'T MISS PNB Bad Time Is Over For PNB
Huge Breakout
Buy At Cmp 76.75
Add Till 67/69
Add More In Panic To 60/62
SL - 44 ( Monthly Closing Basis )
Target - 220/300
Highest Monthly Volumes, Big Up Move Is Coming.

PNB next Potential Target according to Fibonaaci Chart Type : Candlestick
Time frame : Daily
Tool Used: Fibonacci Extension
Please note that this analysis is based on the geometry of the chart, it is not a data based analysis.
From March 2023 the price has moved 85%. But for analysis we consider a strong swing of 65% which is from July2023 to today's candle and the Fibonacci extension is not drawn on the log scale.
According to this setup the next potential target is at 89.85 which is a 23.60% level of Fib extension.
Thanks
Er. Simranjit Singh Virdi

PNB - Ichimoku BreakoutStock Name - Punjab National Bank
Ichimoku Cloud Setup :
1). Today's close is above the Conversion Line
2). Future Kumo is Turning Bullish
3). Chikou span is slanting upwards
All these parameters are showing bullishness at Current Market Price
and more bullishness AFTER crossing 82
#This is not Buy and Sell recommendation to any one. This is for education purpose and a helping hand to learn trading in Market.
#CloudTrading
#IchimokuCloud
#IchimokuFollowers
#Ichimokuexpert
I hope you all like my analysis.
Please do share your thoughts into comment section.
Please give a like, share & subscribe for daily analysis.

PNBcanbk has been sideways since Jan 2023.
closing above 315 could be very good. for move upto 355
275 needs to be saved on closing basis

PNB - Punjab National Bank🔹 Technicals:
▸ Stock is in confirmed uptrend in the mid-term.
▸ Strong breakout in July supported by good volumes.
▸ Price is still above the key moving averages indicating a strong control of buyers.
▸ There is a demand zone near 20 EMA
▸ Previous swing high level near the 50 EMA
▸ A flip zone is present at 57-60 zone.
▸ This means there are plenty of support zones that can act as cushion and prevent the fall.
▸ Buyers will try to push the price higher once the overall market cools down.
Disclaimer: I am NOT a SEBI Registered Analyst and the information provided here is NOT investment advice. This post is intended solely for educational purposes.

PNB - Ichimoku BreakoutStock Name - Punjab National Bank
Ichimoku Cloud Setup :
1). Today's close is above the Conversion Line
2). Future Kumo is Turning Bullish
3). Chikou span is slanting upwards
All these parameters are showing bullishness at Current Market Price
and more bullishness AFTER crossing 73
#This is not Buy and Sell recommendation to any one. This is for education purpose and a helping hand to learn trading in Market.
#CloudTrading
#IchimokuCloud
#IchimokuFollowers
#Ichimokuexpert
I hope you all like my analysis.
Please do share your thoughts into comment section.
Please give a like, share & subscribe for daily analysis.

PNB - 73% RETURNS!!!BUY - PNB
CMP - Rs. 51
Target - 1: Rs. 60
Target - 2: Rs. 68
Target - 3: Rs. 89
.
.
Technicals - Bullish Flag BO
.
This is just a view by an expert analyst, please trade at your own risk.
.
Follow me for more!

PNB H&S BREAKOUTPNB giving H&S breakout
with huge volume and strong
trding above 20 ema
educational idea only

Punjab National Bank (PNB) - Looking good on weekly chartOn a weekly chart, the stock emerging out of the base could be an ideal buy zone (65-68).
Maintain a strict stop loss between 5-8% incase the trade goes wrong.
PS: Not a buy/sell recommendation. Do consult your financial advisor.

PNB Hourly chart looking bullishPNB Hourly looking bullish. It has trendline breakout/flag and pole breakout. Good to buy at 62.60 for target of 69 with sl below 61
*******************************
This is purely for training and educational purposes. We shall not be responsible for your profit or loss.
The stocks discussed or recommended here, may not be suitable for all investors. Investors must make their own investment decisions based on their specific investment objectives and financial position.


Pnb new entry and patternpnb is in a double bottom pattern and at strong support so you can make entry according to the chart
note:- only for education purpose not and we are not responsible for any losses.

PNB about to Channel Breakout @53.90PNB is about to Channel Breakout above @53.90 after a long period (Six Months)
Breakout Level: 53.90
Target Price: 62.00
Stoploss Price: 49.00
Key Factor:
PNB traded above EMA 200 (47.92)
About to break strong resistance level @53.50
If PNB close above @53.90 its should be Bullish run till @62.00
PNB negative run possible if it breaks downside channel approx. @51.00

banking index important levelsthe banking index looks set to show further higher zones
with ups and downs
dont feel it is difficult for it to kiss 50 k mark in months to come
