PNB 1 Day Time Frame 📊 Daily Support & Resistance Levels
These are common pivot-style levels based on recent price action — good for short-term intraday/next-day reference:
Pivot (Daily Reference Zone): ~₹123.5-₹124 range (approximate)
Resistance Levels (Upside Targets)
R1: ~₹124.9–₹125.0 — first resistance zone near recent pivot upside.
R2: ~₹127.1–₹127.2 — higher resistance zone on daily.
R3: ~₹128.4–₹128.5 — extended resistance near recent highs.
Support Levels (Downside Barriers)
S1: ~₹121.5–₹121.8 — immediate support close below pivot.
S2: ~₹120.2–₹120.7 — secondary support zone.
S3: ~₹118.0–₹118.0+ — deeper support if price weakens.
📉 Other Short-Term Levels From Recent Technical Tools
Pivot-based support (Choice India): ~₹101.7, ~₹100.5, ~₹98.4 — longer-range levels (not daily but multi-session reference).
Bollinger bands (approx high/low daily bands): ~₹124.6 upper, ~₹115.0 lower.
🧠 Context from Indicators
RSI around mid-range (~50–65), suggests no extreme in daily momentum right now.
Moving average support around 50/100-day range (₹120–₹117) can act as dynamic support zones.
📌 How to Use These Levels
Bulls watch: Break above R1 (~₹125) for continuation toward R2/R3 (~₹127-128).
Bears watch: If price breaks below S1 (~₹121.5), next support comes around S2/S3 (~₹120 / ~₹118).
Pivot levels near ₹123-124 act as a short-term sentiment line — above is bullish, below is cautious.
Pnbanalysis

Commodities & Currency Trading1. Introduction
Trading is not just about stocks and indices — the global financial ecosystem runs on multiple asset classes, two of the most important being commodities and currencies (forex).
Both markets are deeply interconnected:
Commodities (like crude oil, gold, silver, agricultural products) are the raw materials that power economies.
Currencies represent the financial backbone that facilitates trade in those commodities.
Understanding how these markets work, how they affect each other, and how to trade them effectively is key to building a diversified and resilient trading strategy.
2. Commodities Trading
2.1 What are Commodities?
A commodity is a basic, interchangeable good used in commerce. Unlike branded products, commodities are largely fungible — meaning one unit is identical to another (e.g., one barrel of crude oil is essentially the same as another of the same grade).
2.2 Types of Commodities
They’re broadly divided into four categories:
Energy Commodities
Crude Oil (WTI, Brent)
Natural Gas
Heating Oil
Gasoline
Metals
Precious Metals: Gold, Silver, Platinum, Palladium
Industrial Metals: Copper, Aluminum, Nickel, Zinc
Agricultural Commodities
Grains: Wheat, Corn, Soybeans
Softs: Coffee, Cocoa, Sugar, Cotton
Livestock and Meat
Live Cattle, Feeder Cattle
Lean Hogs, Pork Bellies
2.3 Commodity Exchanges
Trading in commodities often happens on specialized exchanges:
CME Group (Chicago Mercantile Exchange) – Largest commodities marketplace
NYMEX (New York Mercantile Exchange) – Energy contracts
ICE (Intercontinental Exchange) – Agricultural & energy
MCX (Multi Commodity Exchange of India) – India’s main commodities market
2.4 Why Trade Commodities?
Diversification: Often move independently from stocks & bonds.
Inflation Hedge: Commodities, especially gold, hold value in inflationary times.
Geopolitical Plays: Energy prices rise in conflicts; agricultural prices rise in shortages.
Leverage Opportunities: Futures contracts allow large exposure with smaller capital.
2.5 How Commodity Trading Works
Most commodity trading is done via derivatives (futures, options, CFDs) rather than physically handling goods.
Futures Contracts: Agreement to buy/sell at a predetermined price and date.
Options on Futures: The right, but not obligation, to trade at a set price.
Spot Market: Immediate delivery at current market price.
2.6 Key Factors Influencing Commodity Prices
Supply and Demand Dynamics
Crop yields, mining output, energy production
Weather Conditions
Droughts affect agricultural prices
Geopolitical Events
Wars, sanctions, OPEC decisions
Currency Movements
Commodities priced in USD — weaker USD often boosts prices
Global Economic Health
Economic booms increase demand for raw materials
2.7 Commodity Trading Strategies
A. Trend Following
Uses technical indicators (moving averages, MACD) to ride long-term price moves.
Example: Buying crude oil when it breaks above resistance with strong volume.
B. Mean Reversion
Prices oscillate around an average value; traders buy undervalued & sell overvalued points.
Works well in range-bound markets like agricultural products.
C. Seasonal Trading
Many commodities have predictable seasonal patterns.
Example: Natural gas often rises before winter due to heating demand.
D. Spread Trading
Simultaneously buying one contract and selling another to profit from price differences.
2.8 Risks in Commodity Trading
High Volatility: Sharp price swings due to news, weather, geopolitics.
Leverage Risk: Futures amplify both gains and losses.
Liquidity Risk: Some contracts have low trading volume.
Risk Management Tip: Always use stop-loss orders and never over-leverage positions.
3. Currency (Forex) Trading
3.1 What is Forex?
Forex (Foreign Exchange) is the world’s largest financial market, trading over $7.5 trillion daily. It’s where currencies are bought and sold in pairs (e.g., EUR/USD, USD/JPY).
3.2 Major Currency Pairs
Majors: Most traded, involving USD
EUR/USD, GBP/USD, USD/JPY, USD/CHF, AUD/USD, USD/CAD
Crosses: No USD, e.g., EUR/GBP, AUD/JPY
Exotics: One major + one emerging currency, e.g., USD/INR, USD/TRY
3.3 Why Trade Currencies?
High Liquidity: Easy to enter & exit trades
24-Hour Market: Open Mon–Fri, covering all time zones
Low Costs: Narrow spreads, no commissions in many cases
Leverage: Small capital can control large positions
3.4 How Forex Trading Works
Currencies are traded in pairs, meaning you buy one currency while selling another.
Example:
EUR/USD = 1.1000 → 1 Euro = 1.10 USD
If you believe Euro will strengthen, you buy EUR/USD.
3.5 Factors Influencing Currency Prices
Interest Rates
Higher rates attract investors → stronger currency.
Economic Indicators
GDP, employment data, inflation numbers.
Political Stability
Stable governments attract investment.
Trade Balances
Countries exporting more than importing see stronger currencies.
Risk Sentiment
Safe-haven currencies (USD, JPY, CHF) strengthen in crises.
3.6 Forex Trading Strategies
A. Scalping
Ultra-short trades, seconds to minutes long.
Requires high liquidity pairs like EUR/USD.
B. Day Trading
Multiple trades within a day, no overnight positions.
C. Swing Trading
Holding for days/weeks to ride medium-term trends.
D. Carry Trade
Borrowing in low-interest currency and investing in high-interest currency.
3.7 Forex Risk Management
Use Stop Loss: Limit potential losses per trade.
Position Sizing: Risk only 1–2% of capital per trade.
Avoid Over-Leverage: High leverage magnifies losses quickly.
4. Relationship Between Commodities & Currencies
Commodities and currencies are tightly linked:
Commodity Currencies:
Some currencies move closely with specific commodity prices:
CAD ↔ Crude Oil
AUD ↔ Gold, Iron Ore
NZD ↔ Dairy, Agricultural Products
Inflation & Commodities:
Rising commodity prices often push inflation up, affecting currency value.
USD & Commodities:
Since most commodities are priced in USD, a weaker USD generally boosts commodity prices.
5. Technical & Fundamental Analysis in Both Markets
Technical Analysis Tools
Moving Averages
RSI & MACD
Fibonacci Retracement
Volume Profile (for commodities)
Fundamental Analysis
Economic reports (forex)
Supply-demand reports (commodities)
Geopolitical tracking
6. Practical Tips for Traders
Track Economic Calendars: For major releases affecting currencies & commodities.
Watch Correlations: Know which assets move together or in opposite directions.
Start Small: Paper trade before risking capital.
Stay Informed: Follow OPEC meetings, central bank decisions, and weather reports.
7. Conclusion
Trading commodities and currencies opens up opportunities beyond stocks, offering diversification, leverage, and global exposure. But these markets also come with high volatility and risk, making education, discipline, and strong risk management essential.
The successful trader learns not just to predict price movements, but also to understand the economic forces driving them.
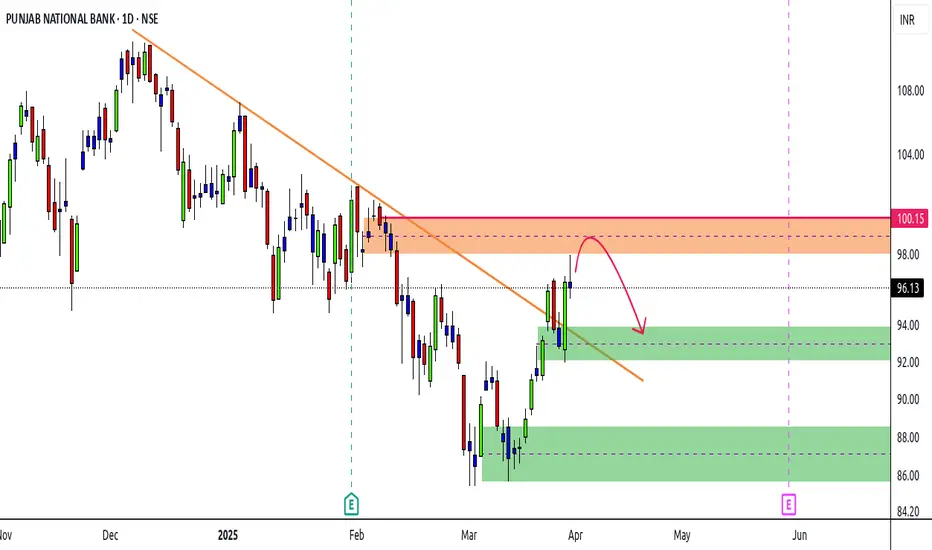
PNB | Possible PullbackStock making Higher Highs / Higher Lows in daily
Currently in DBD supply zone
Supply area from 98 - 100
Opportunity for a bearish move
Confirmation required on a lower TF
Downside 1st Target 93
Upside SL 101
PNB - PatternSelf Explanatory chart
Getting ready to reach a strong resistance area of 108
Possible fall from this trend line and supply zone till 101 - 102
Then again a trend up

PNB Bank | LONG TERM INVESTMENTHi Traders,
This is PNB Monthly Chart.
This Best time to invest for long term with small
SL which is 7 Rupees. Only
S trategy - This Power Of Stock 5 EMA Monthly Candle
Note - This is only for education purpose

Punjab National Bank#pnb Punjab National Bank is making higher highs formation on chart,
Upside possible till 112-115. EMA Making Gloden Crossover
I have attached the chart for your reference.

PNB - LONG BUYPANJAB NATIONAL BANK - LONG @ 128 - PSU sectors are also moving high.
Technically also bulling view
fundamentally also company very strong
new investments like mutual funds investors increasing.

#PNB LONG TRADE IDEA SETUPGreetings Folks,
today I have prepared a setup of PNB on NSE
the analysis is as follows-
-the price recently broke out of a bullish pattern
- The price is kinda stretched right now, can use some temporary support for more momentum
- i have marked the most immediate strong support zone
- this trade setup might play in 2-3 days as the support zone is not in reach of price right now
don't play with fire, always use a predefined stoploss

DON'T MISS PNB Bad Time Is Over For PNB
Huge Breakout
Buy At Cmp 76.75
Add Till 67/69
Add More In Panic To 60/62
SL - 44 ( Monthly Closing Basis )
Target - 220/300
Highest Monthly Volumes, Big Up Move Is Coming.

PNB - Ichimoku BreakoutStock Name - Punjab National Bank
Ichimoku Cloud Setup :
1). Today's close is above the Conversion Line
2). Future Kumo is Turning Bullish
3). Chikou span is slanting upwards
All these parameters are showing bullishness at Current Market Price
and more bullishness AFTER crossing 82
#This is not Buy and Sell recommendation to any one. This is for education purpose and a helping hand to learn trading in Market.
#CloudTrading
#IchimokuCloud
#IchimokuFollowers
#Ichimokuexpert
I hope you all like my analysis.
Please do share your thoughts into comment section.
Please give a like, share & subscribe for daily analysis.

PNB about to Channel Breakout @53.90PNB is about to Channel Breakout above @53.90 after a long period (Six Months)
Breakout Level: 53.90
Target Price: 62.00
Stoploss Price: 49.00
Key Factor:
PNB traded above EMA 200 (47.92)
About to break strong resistance level @53.50
If PNB close above @53.90 its should be Bullish run till @62.00
PNB negative run possible if it breaks downside channel approx. @51.00

PNB Housing Monthly Investment AnalysisPNB Housing Monthly Analysis
PNB Housing Monthly Investment Analysis Based On Technical Analysis and Completely Based On My Knowledge and It's My Personal View
As Per the Analysis for PNB Housing For Monthly Chart, I am expecting that PNB Housing Share is on very important levels as per monthly charts, 500-620 is a level where it will trade as zero line zone means we will initiate any buying until it is rangebound under these levels, if it will go above the 620 levels then we can expect
3 Months Target as 750 - 760,
7 Months Target as 1000-1020,
15 Months Target as 1150 - 1250
and If PNB Housing wouldn't sustained above 620 levels then we can expect these below levels, if it will came below 500 levels
5 to 6 months target would be 330-350
11 to 12 months target would be 150-170
Disclaimer : These analysis are purely based on Technical Analysis, I Don't Recommend You to Buy or Trade or Make Any Investment Based On Above Levels.
I Always Request You to Please Do Your Own Analysis Before Taking Any Trade or Starting Investment or Consult Your Financial Advisor To Take Investment Related Decisions

PNB Bank Breakout Soon!PNB Share soon taking a Breakout because its bottom trendline is very strong.
if you see it takes the support on Trendline then there is an opportunity of buying
Let's wait and watch!!!

pnb reverse head and shoulder reverse head and shoulder and breakout is forming on daily charts which give targets near rs 40 so trade wisely

PNB - Swing Candidate For 20%PNB
Buy-Above 38
Sl-35
T- 43 47 50+
All banking stocks have almost the same structure after 35500 in banknifty was taken out.
The stock is good in terms of risk and reward.

Punjab National Bank: High Probability TradingOne of the nice set up here on the charts of Punjab National Bank. This looks like a great trade with perfect risk to reward ratio.
Rough Set up.
Buy Price - Around 40-41
Stop loss - Around 38.5-38
1st Target - 43 🎯
2nd Target - 47 🔥
This is not a buy recommendation from our side. Just showing how to plan a trade and be ready to take calculated risk against good profit.

PNBFibonacci Levels..............................................................................................................................................................................

Simple Trade Setup | PNB NSE:PNB
I am posting this on request from a follower on Twitter.
Observations:
1) On 1 Day time frame, we can see that it has support at 44 level and resistance at 46 level.
And it closed just below the resistance level. If it gives sustainable breakout of 46 level and sustain above 46 then we can see further up move till 48 and 50 level.
But if it faces resistance from 46 level then we can see a downfall till 44 level.
My personal opinion is that better to trade with equity in this at this moment with positional trade.
Please refer below chart : 1day Time Frame.


PNB IMP LEVELS Trade PNB by considering the important level as demand and supply zone .
DO like and share .
Subscribe for more in future .
Happy investing for better future .

PNB - Punjab National Bank - Technical AnalysisPNB - Punjab National Bank
NSE:PNB
This is a pure technical analysis call backed by the banking theme.
> The stock has taken support at 25 levels and after consolidating for 1 and 3 months it is ready to give breakout with huge volume , accumulation in the stock can be seen since December 2020.
> The stoch has also crossed 100 and 200 DMAs very recently, strong upmove is around the corner.
> A lot of movement can be seen in almost all PSU banks.
> NIFTY PSU Bank index chart is in massive UPTREND. When entire sector is performing individual stocks are most likely to run along.
> I have selected PNB and BOB because of it's wonderful chart pattern.
> One more very important thing is that government is about to setup a BAD BANK. Which will help all PSU banks tremendously clean their balance sheet , consequently valuations of these PSU banks will automatically improve.
What is BAD BANK?
A bad bank is a bank set up to buy the bad loans and other illiquid holdings of another financial institution. The entity holding significant nonperforming assets will sell these holdings to the bad bank at market price. By transferring such assets to the bad bank, the original institution may clear its balance sheet—although it will still be forced to take write-downs. This will help all PSU banks to get rid of their NPAs.
FRESH BUY - AT CMP 41
OLD BUY - HOLD
TARGET 1 - 100 (+150% aprx)
TARGET 2 - 135 (+225% aprx)
Risk Management Tip: Never invest more than 5% of your capital in any single stock.
Happy Investing!
Team ShareMktSchool

Punjab National Bank BreakoutPunjab National bank has tested the resistance zone/ supply zone multiple times. Hence the sellers are becoming weak now and buyers are getting stronger. If the buyers are able to close the price above the supply zone, the stock may show a good upmove.
