PNB 1 Day Time Frame 📊 Daily Support & Resistance Levels
These are common pivot-style levels based on recent price action — good for short-term intraday/next-day reference:
Pivot (Daily Reference Zone): ~₹123.5-₹124 range (approximate)
Resistance Levels (Upside Targets)
R1: ~₹124.9–₹125.0 — first resistance zone near recent pivot upside.
R2: ~₹127.1–₹127.2 — higher resistance zone on daily.
R3: ~₹128.4–₹128.5 — extended resistance near recent highs.
Support Levels (Downside Barriers)
S1: ~₹121.5–₹121.8 — immediate support close below pivot.
S2: ~₹120.2–₹120.7 — secondary support zone.
S3: ~₹118.0–₹118.0+ — deeper support if price weakens.
📉 Other Short-Term Levels From Recent Technical Tools
Pivot-based support (Choice India): ~₹101.7, ~₹100.5, ~₹98.4 — longer-range levels (not daily but multi-session reference).
Bollinger bands (approx high/low daily bands): ~₹124.6 upper, ~₹115.0 lower.
🧠 Context from Indicators
RSI around mid-range (~50–65), suggests no extreme in daily momentum right now.
Moving average support around 50/100-day range (₹120–₹117) can act as dynamic support zones.
📌 How to Use These Levels
Bulls watch: Break above R1 (~₹125) for continuation toward R2/R3 (~₹127-128).
Bears watch: If price breaks below S1 (~₹121.5), next support comes around S2/S3 (~₹120 / ~₹118).
Pivot levels near ₹123-124 act as a short-term sentiment line — above is bullish, below is cautious.
Pnbbank

Punjab National Bank: A Technical Setup Worth WatchingPunjab National Bank is trading at ₹122.80 and nearing a test of its long-term downtrend line on the monthly chart. With RSI climbing back above 60, the stock is showing signs of renewed bullish momentum.
Punjab National Bank (PNB), one of India’s leading public sector banks, is currently presenting an intriguing technical setup that could serve as a valuable case study for traders and investors. As of early November 2025, the stock is trading around ₹122.80 and is approaching a critical juncture on its monthly line chart—a potential test of its long-term downtrend line.
🔹 The Downtrend Line: A Barrier to Watch
In technical analysis, a downtrend line connects a series of lower highs and acts as a dynamic resistance level. When a stock approaches this line, it often faces selling pressure. However, if the stock manages to break above and sustain beyond this line, it signals a potential reversal in trend—from bearish to bullish.
PNB’s current price action suggests it is close to challenging this long-term resistance, which has historically capped upward movement. A successful breakout would not only mark a technical victory but could also shift investor sentiment in favor of the stock.
🔹 RSI Momentum: Strength Rebuilding
The Relative Strength Index (RSI) is a momentum indicator that helps gauge the strength of price movements. PNB’s RSI has already traded above 70 once, indicating strong bullish momentum in the recent past. Although it pulled back, it has now rebounded above 60, suggesting that buying interest is returning.
This RSI behavior is significant. A move above 50 typically signals bullish territory, and a climb toward 70 reflects increasing strength. In the context of a potential trendline breakout, this momentum could provide the necessary fuel for a sustained upward move.
🧠 Educational Insights
Trendline Tests on Higher Timeframes: Monthly charts offer a broader view of market sentiment. A breakout on this timeframe carries more weight than short-term fluctuations.
Momentum Confirmation: RSI above 60, especially after a prior move above 70, indicates that the stock is regaining strength. This supports the case for a breakout rather than a rejection.
Price-Action Focus: Watching how the stock behaves around the downtrend line—whether it consolidates, spikes, or pulls back—can offer clues about the next move.
📌 Learners Takeaway
Punjab National Bank’s current setup is a classic example of a stock approaching a technical inflection point. With the price near ₹122.80 and RSI showing renewed strength, traders should monitor the monthly chart closely. A confirmed breakout above the long-term downtrend line could signal a major trend reversal, offering potential upside for those positioned early.
Live chart Example to keep Track

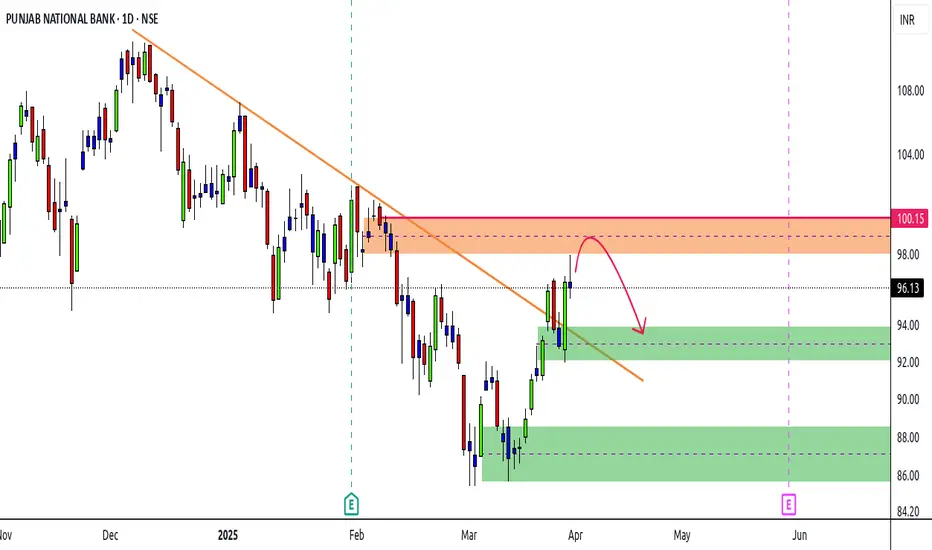
PNB | Possible PullbackStock making Higher Highs / Higher Lows in daily
Currently in DBD supply zone
Supply area from 98 - 100
Opportunity for a bearish move
Confirmation required on a lower TF
Downside 1st Target 93
Upside SL 101
PNB - PatternSelf Explanatory chart
Getting ready to reach a strong resistance area of 108
Possible fall from this trend line and supply zone till 101 - 102
Then again a trend up

PNB Bank | LONG TERM INVESTMENTHi Traders,
This is PNB Monthly Chart.
This Best time to invest for long term with small
SL which is 7 Rupees. Only
S trategy - This Power Of Stock 5 EMA Monthly Candle
Note - This is only for education purpose

Punjab National Bank#pnb Punjab National Bank is making higher highs formation on chart,
Upside possible till 112-115. EMA Making Gloden Crossover
I have attached the chart for your reference.

#PNB LONG TRADE IDEA SETUPGreetings Folks,
today I have prepared a setup of PNB on NSE
the analysis is as follows-
-the price recently broke out of a bullish pattern
- The price is kinda stretched right now, can use some temporary support for more momentum
- i have marked the most immediate strong support zone
- this trade setup might play in 2-3 days as the support zone is not in reach of price right now
don't play with fire, always use a predefined stoploss

DON'T MISS PNB Bad Time Is Over For PNB
Huge Breakout
Buy At Cmp 76.75
Add Till 67/69
Add More In Panic To 60/62
SL - 44 ( Monthly Closing Basis )
Target - 220/300
Highest Monthly Volumes, Big Up Move Is Coming.

PNB confirm Targets 2023
Punjab National Bank Stock Targets 2023
PBN Stock 94 % up in Last One Year
PBN Stock 17 % up in Last One Month
Punjab National Bank upgraded from mid-cap to large-cap
Breakout indicates a potential upward trend in the stock
Future Targets
Up Side First Target as per Analysis is = 69
Up Side First Target as per Analysis is = 75
Up Side Third Target as per Analysis is = 100
Please Share our Idea

PNB - Swing Candidate For 20%PNB
Buy-Above 38
Sl-35
T- 43 47 50+
All banking stocks have almost the same structure after 35500 in banknifty was taken out.
The stock is good in terms of risk and reward.

Simple Trade Setup | PNB NSE:PNB
I am posting this on request from a follower on Twitter.
Observations:
1) On 1 Day time frame, we can see that it has support at 44 level and resistance at 46 level.
And it closed just below the resistance level. If it gives sustainable breakout of 46 level and sustain above 46 then we can see further up move till 48 and 50 level.
But if it faces resistance from 46 level then we can see a downfall till 44 level.
My personal opinion is that better to trade with equity in this at this moment with positional trade.
Please refer below chart : 1day Time Frame.

PNB forms a symmetric triangle patternPNB on a daily time frame has formed a symmetric triangle pattern and also gave breakout with 52 weeks high of 48.20 rupees. The next target would be around 53 based on the width of the triangle.

PNB IMP LEVELS Trade PNB by considering the important level as demand and supply zone .
DO like and share .
Subscribe for more in future .
Happy investing for better future .

PNB: HIGH POTENTIAL BUT GREATLY UNDERVALUED STOCK!Punjab National Bank is a very good stock, on the verge of breakout. I recommend this stock for the long term, as it has very high potential but has been severely beaten down due to the Nirav Modi fraud and a few other incidents.
1. Volumes are at all time high, suggesting market interest in the stock.
2. VERY undervalued for the sort of company it is, and business it does.
3. Mehul Choksi could get deported to India any time soon. The ensuing trial could help PNB realize a portion (if not all) of the bad debts written off immediately after the fraud took place.
4. Look for weekly candle closing above 44-46 range for targets of 60/110/160/200+

PNB - Ready For 50% Upmove ??? VOLUME SHOCKER
Buy Pnb
Closing Price - 42.05
SL - 32 (Monthly Closing Basis)
Target - 96/128


PNB @ KISS - 36.25The stock is in an uptrend and was consolidating for a SHORT TIME and thereby forming an Ascending triangle.
Stop-loss is placed according to personal risk management.
ITC @ BUY ABOVE 35.75
TGT 01 - 36.05
TGT 02 - 36.25
SL - 35.50


PNB Long Term TradeThe stock is looking good at this price for the long term, safe traders can keep SL for 3 points (29.5) and refer to the chart for the targets.
Happy Trading!
InvestPro India Team
