PNCINFRA Bullish Trend AlertPNCINFRA:-
flug pattern breakout right buy entry and u can expecty T1 and T2
PNCINFRA

PNC INFRATECH- Weekly Chart
- Positional/ Investment idea
- ATH WEEKLY Breakout, Increasing volumes
- Strong Numbers & Fundamentals

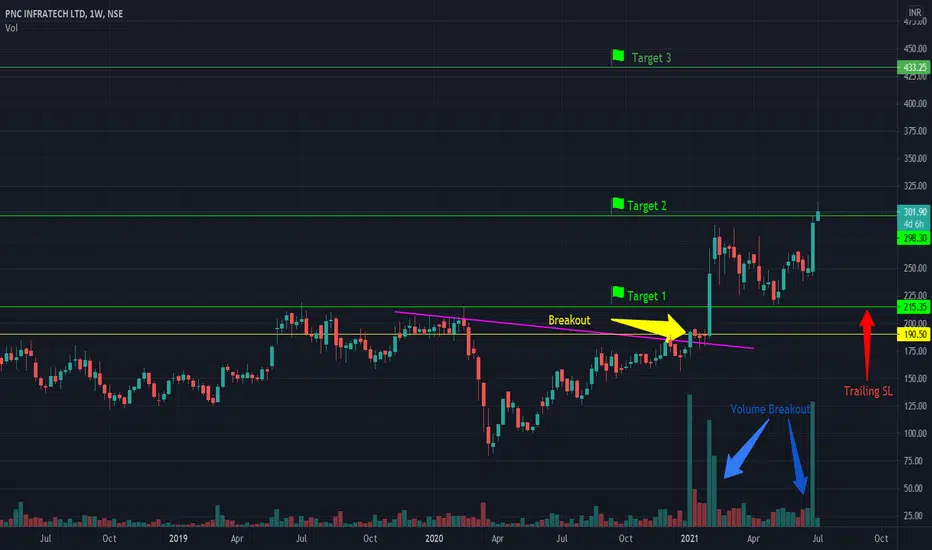
Target 2 (61%) achieved in PNCInfra. Target 3 is ON...This is follow-up on PNCInfra. Can check link to related ideas.
Target 2 achieved. More than 61%. Target 3 is ON.
Chart is self explanatory. Entry, Targets and Trailing Stop Loss are mentioned on the chart.
Disclaimer: This is for demonstration and educational purpose only. This is not buying or selling recommendations. I am not SEBI registered. Please consult your financial advisor before taking any trade.
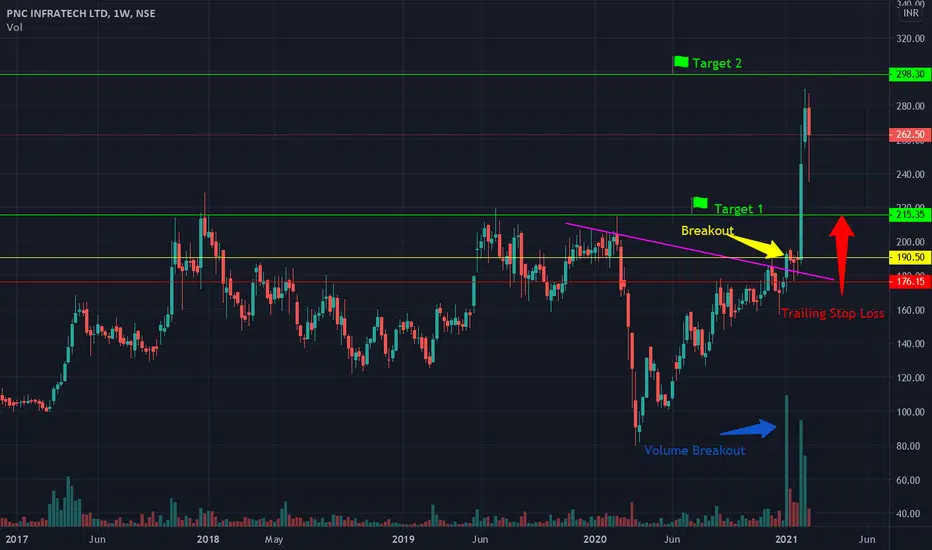
Target 2 is ON but with Trailing Stop Loss...This is follow-up on PNC Infra. Can check link to related ideas.
Target 1 achieved. Target 2 is ON but with Trailing Stop Loss...
Chart is self explanatory. Entry, Targets and Trailing Stop Loss are mentioned on the chart.
Disclaimer: This is for demonstration and educational purpose only.
Possible breakout in PNCInfra...Chart is self explanatory. Entry, Targets and Stop Loss are mentioned on the chart.

Intraday Trade: watch for resistance breakoutbuy above 267 in intraday
keep sl at 260 or use 5 minute chart for nearest support.
Note: this is only intraday trade. for swing and positional trade length of pattern must be big
for intraday we need only momentum so that we can grab few quick points.
for target use 5 min chart and fibonacci pivots as i don't keep predefined target.
try to book partially and trail.
Note: this is not a prediction for LONG/SHORT, trade will trigger only on given level as per technical analysis
NOTE: For Gapup or bo before 9:20
If gapup is more than 1% from bo level than avoid completely.
if less than 1% or gives bo before 9:20 than wait for
first 5 minute candle and entry above 5 minute candle
and revised SL below candle Low.


PNCINFRA: VCP PATTERN FORMATION
NSE:PNCINFRA
Levels mentioned in Chart.
Note: Not a SEBI Registered analyst.
Trade at your own discretion.

PNC Infratech will Blast to Rs400 and more in years to come!NSE:PNCINFRA has taken multiple support of the trendline drawn in the chart.
It has given huge breakout from Multi year Channel it was trading in. Past 4-5months it has retested and remained stable above the large channel forming good consolidation to more upside continuation.
The time frame is monthly and weekly on which i have observed everything, expect things to shape up in weekly/monthly time.

PNC InfratechFlag and pole pattern breakout!
Looks good to buy with targets marked in the chart. Set stop-loss according to your risk appetite.
Also, MACD further supports the breakout.
Please do your own analysis before making any decisions and also let me know if I missed something.
Let's learn together.

BUY PNC INFRATECH - BULL FLAG BREAKOUT ON THE WEEKLY CHART Buy for near term (8-12 trading sessions) targets mentioned on the chart. Fundamentally strong stock - can hold longer for bigger targets.
The stock has closed above the parallel channel. Also, it had closed above its 50 DMA on Thursday 20th May 2021 and pushed higher the next day on the daily chart.
Disclaimer:
The analyses that I publish are solely for informational & educational purposes.
Do your own analysis before making any investment. You should take independent financial advice from a professional in connection with, or independently research and verify, any information that you find on the internet and wish to rely upon, whether to make an investment decision or otherwise.


PNC infratech looks a good buyPNC infratech looking good on charts
Made a rounding bottom on support it could touch 240 if sustain above 230
Keep an eye on it
DISCLAIMER
( Educational Purpose )
All investments involve risk.
Please Do your analysis before initiating Any trade
Good luck !

#PNCInfraDisclaimer: I am not a SEBI registered or authorized analyst. The charts/levels/stocks posted will be only for educational purpose and not a buy/sell recommendation. I will not be responsible for your any losses & profit. No any kind of legal actions will be entertained for the same.


sell on rally (short term )structure weak with slTrade setup dlf weak temporary chart for target of previous support and moving avaerage

PNC InfratechPlease trail stop as always. Respect the market and the analyst. Do your own research before trading.

PNCINFRA for day trading and short termWatch PNCINFRA today for the trendline BO for the immediate target of 289.
If moves above 290(watch for DCB) it can further give a good move for the short term.
