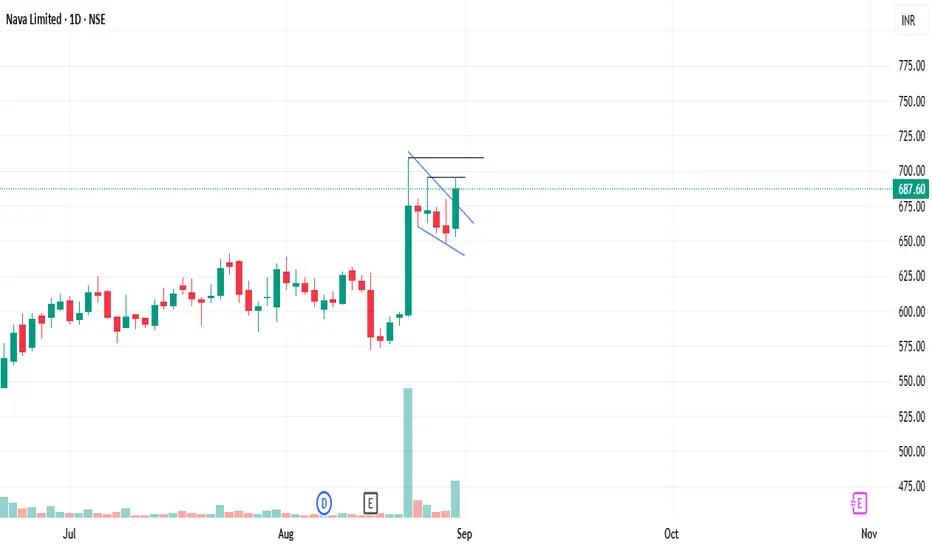
"NAVA" A Pole & Flag pattern breakout on 1day chart Stock name:- Nava on 1day chart price formed a pole and flag pattern and on 29-aug-2025 price breakout and sustained above and closed which simply means price is ready to move up but there's a immediate resistance at "696" once price breaks it then 710 is our next resistance and there's possibility of 3 scenarios 1.price breaking high and going up till 740-765 level. 2.price breaking high and then take resistance and fall below 700 level & stay in a range then decide the move. 3.price taking resistance at 710 then fall till 660.
for Monday i.e. 1-sep-2025 if price opens gap up wait till 10:15am then on hourly chart see candle then take trade, if flat opens then wait for price to cross 696 level then trade but with less quantity as 700 is psychological round level and 710 a previous high so price can form a big candle & break previous high then fall & retest then go up, so be cautious a little and once price goes up we can add quantity, if gap up price take resistance from 710 and closes below 675 then a fall till 660 can be seen.
for investment/swing trade once price goes above 710 then add up quantity as price can go up till 740-765 in 1st level then to 780 in next tgt level.
Disclaimer:- i'm not a sebi registered analyst and idea shared here is my personal view point which includes various technical indicators and i don't have any investment in this scrip nor do i have any contact with employees of the company the idea shared is for educational purpose so before taking any trade or investment pls consult with your financial advisor.
Poleandflagpattern
PERSISTENT | Pole and Flag Formation | Swing TradePERSISTENT | Pole and Flag Formation | Swing Trade
Chart Analysis
1) Pole and Flag formation
2) Flag Breakout
3) Volume breakout

TPLPLASTEH | Pole and Flag Breakout | Swing TradeTPLPLASTEH | Pole and Flag Breakout | Swing Trade
Chart Analysis
1) Pole and Flag Breakout after 5 month consolidation
2) Good Volume Breakout

Apollo Microsys | Pole and Flag Pattern | Swing TradeApollo Microsys | Pole and Flag Pattern | Swing Trade
Chart Analysis
1) Flag and Pole pattern
2) stock is already on bull run

Trendline BrekaoutHere is a Government Company. now started moving after making a base in a weekly time frame.
Its been in the range Since 2017 and has also passed the Covid Crash and even then respected the same levels. It started its rally back then in 2014 and continued till 2019 and since then it is consolidating at the same level.
It has started moving after taking its previous support i.e. 200, But was not giving breakout of its short term downtrend line since 2019. Now it has given a breakout with a bullish candle and hence can be traded.
Entry - At the same level i.e. 230
Stop Loss - At the last swing i.e. 210
Reward - there is ling term resistance at 270. (One can check the price action there as it may give a breakout this time.)
#keep learning
*This is a swing trade and can take 1 month to 3 month time.

TATAPOWER--> POLE & FLAG BREAKOUTNSE:TATAPOWER
TECHNICAL ANALYSIS
--> TATAPOWER had made a impulsive upmove earlier and was consolidating in Flag Pattern since 6 months.
--> TATAPOWER has given a breakout from a POLE & FLAG Pattern.
ENTRY
--> Take a postion when stock gives 1 HR closing above 280.
STOPLOSS
--> SL can be placed below the Breakout Candle which is 249.
TARGET
--> Target will be the height of the Pole.

long on tata powerThe stock is moving within range of 200-250 since last 4 months
a breakout and a retest is been done at 1 day timeframe
do check its delivery by searching - security wise delivery position
confirmations-1- bullish engulfing at after breakout
2- huge jump in volume
I'm not a SEBI registered person . Please ask your financial advisor before investing / trading

JSL - LongA classical pole & flag breakout with high volume on pole + low volume on pullback. Potential buy trade.


HAL POLE AND FLAG PATTERNStock did the breakout today expecting big move in this counter atleast 200 to 300 rs upside can go long with small SL as per chart pattern
Always do your own research before investing

BUY route mobileThis stock is making carious breakout pattern continuosly. people are trying to push this stock up very safely now currently its forming pole and flag as you can see buy at cmp target 2600 plus holding period 2-3 weeks


BURGER KING WITH A FLAG PATTERN - "BUY TAG"Flag Pattern in Burger King
Tine to cross Target < 2 months
Target - 170, 172, 175, 177
(if it crosses levels of 162)
Stop Loss = 159 if it crosses levels of 162
Burger King is a strong company with increasing sales.
It will become stronger as India is moving towards UNLOCK after covid.
Please Like my Idea
Thank YOU!!!
