POLYCAB - Breakdown From Distribution Range💹 Polycab India Ltd (NSE: POLYCAB)
Sector: Electricals / Cables | CMP: 7079.5
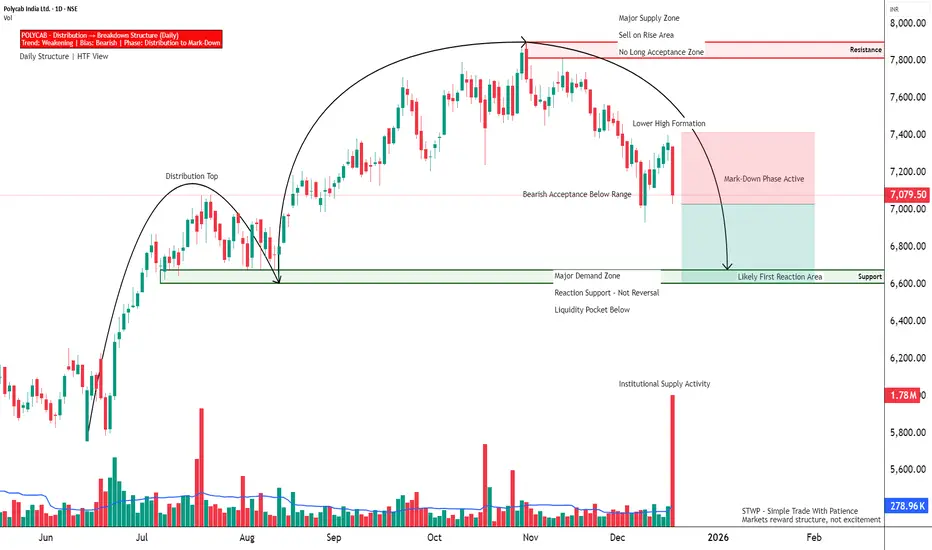
View: Bearish — Breakdown From Distribution Range
POLYCAB has decisively slipped below its short-term consolidation zone, following a failed attempt to sustain above the 7600–7800 supply region. The rejection from this upper band was sharp and volume-backed, confirming distribution at higher levels rather than healthy consolidation. Recent candles show downside continuation with expanding volatility, keeping the immediate bias tilted to the downside.
Structurally, the stock has transitioned from an uptrend into a lower-high formation, with price now trading below key short-term averages. RSI around 38 reflects weak but not oversold momentum, indicating that downside pressure still has room to play out. MACD remains in bearish territory, while ADX suggests the trend is developing rather than exhausted. This combination favours continuation moves over mean-reversion bounces.
Volume behaviour is a key tell. The recent sell-off has come with very high participation (Vol-X ~9+), signalling active institutional repositioning rather than retail-driven noise. Importantly, selling has not yet shown capitulation characteristics, implying that weakness may persist until a stronger demand pocket is tested.
Key Support & Resistance Zones (Chart-Based)
Resistance Zones:
• 7270 (near-term supply / pullback cap)
• 7460.5 (intermediate resistance)
• 7580 (major overhead resistance, prior distribution zone)
• 7800–7900 (weak but broad HTF supply band)
Support Zones:
• 6960 (Support 1 – immediate reaction level)
• 6840.5 (Support 2 – intermediate demand)
• 6650 (Support 3 – major structural demand zone)
The 6960 level may offer a temporary pause or short-lived bounce, but it is not a trend-defining support. A sustained break below this zone increases downside probability toward 6840.5 and 6650, where stronger demand is likely to emerge. Any pullback toward 7270–7460 is expected to face supply unless accompanied by clear volume contraction and structural improvement.
From a broader risk perspective, POLYCAB is now in a sell-on-rise environment, with trend strength favouring bears and volatility elevated. Long exposure remains high-risk until price reclaims and sustains above the lower resistance band with improving momentum metrics.
Options activity shows increasing alignment with the mark-down structure. Near-ATM PUTs are referenced purely for positioning insight, with balanced-to-negative delta indicating sensitivity to further downside. Rising open interest alongside strong volume points to fresh bearish participation rather than short-covering, while implied volatility remains in a controlled mid-range, suggesting measured risk pricing.
Derivatives participation broadly confirms the cash-market breakdown, with liquidity concentrated near ATM levels and behaviour consistent with informed repositioning. Directional structures remain sensitive to time decay and consolidation, making continued downside acceptance and momentum follow-through essential for validation.
Final Outlook (Educational Snapshot):
Momentum: Weak | Trend: Developing| Risk: High | Volume: Very High
⚠️ STWP Legal Disclaimer
This document is strictly for educational and informational purposes. All examples, charts, levels, and option structures discussed are illustrative and are not intended as buy, sell, or hold recommendations. STWP does not provide investment advice, trading tips, signals, or personalized financial guidance of any kind, nor is it a SEBI-registered intermediary or research analyst. The analyses, illustrations, and risk–reward structures included here are generic in nature and based on publicly available data and observed market behaviour, which may change without notice. Financial markets involve significant risk; derivatives in particular carry the potential for substantial losses. Option premiums, implied volatility, open interest, delta, and other market variables can fluctuate rapidly and unpredictably.
Readers are solely responsible for their trading decisions, capital management, and risk assessment. Before making any investment or trading decision, please consult a SEBI-registered investment advisor. STWP, its representatives, and affiliates shall not be liable for any direct or indirect loss arising from the use of this material. Historical patterns or past market behaviour do not guarantee future outcomes, nor should any part of this document be interpreted as a promise of performance, accuracy, or returns.
Position Status: No active position in this instrument at the time of analysis.
Data Source: TradingView & NSE India.
💬 Found this useful?
🔼 Boost this post to support structured learning
✍️ Share your thoughts or questions in the comments
🔁 Forward this to traders who value clean technical studies
👉 Follow for disciplined, structured, STWP-style analysis
🚀 Stay Calm. Stay Clean. Trade With Patience.
Trade Smart | Learn Zones | Be Self-Reliant 📊
POLYCAB
Polycab Short Setup: Targeting Sell-Side Liquidity at 7200Price around 7500 suggests premium pricing in a bearish distribution phase. Smart Money Concepts highlight an internal shift of structure, indicating potential downside delivery. Liquidity resting below recent swing lows at 7200 serves as the primary draw. A pullback into a bearish FVG or order block could offer optimal short entries as the market seeks to sweep the sell-side liquidity at 7200.

Options Watchlist — An Educational View of OI & Price Action________________________________________
📊 Options OI Trade Outlook — Bullish Setups Only
“This analysis is shared purely for educational purposes and market awareness — not a trading recommendation.”
(Educational Purpose | Not Financial Advice | SEBI Compliant)
Hello Traders 👋,
Here are 5 Bullish option setups based on today’s OI + Price Action + IV + Greeks study.
This is strictly for learning and educational purposes.
________________________________________
🟢 1. MARUTI 14800 CALL
LTP: 383.95
Sentiment: Bullish | Trend: Up | Strength: 5/5 (Strong)
IV: 20.5 | Delta: 0.53 | Theta: -8.64 | Vega: 17.6
Buildup: Long Build-up
Why?
This strike shows a Long Build-up with price rising 10.1% and OI up 38.2%, a textbook bullish confirmation.
Though volume dipped (-25.7%), IV rose 8.4% supporting premium expansion. Delta 0.53 signals strong ITM probability.
________________________________________
🟢 2. MARUTI 14700 CALL
LTP: 436.15
Sentiment: Bullish | Trend: Up | Strength: 5/5 (Strong)
IV: 20.5 | Delta: 0.56 | Theta: -8.66 | Vega: 17.4
Buildup: Long Build-up
Why?
14700 CE shows a Long Build-up with price up 9.8% and OI up 15.7%, confirming bullish sentiment.
Volume is lower (-33.5%), but IV rising 9.2% supports premiums. Delta 0.56 shows strong ITM odds.
________________________________________
🟢 3. ADANIENT 2300 CALL
LTP: 70.15
Sentiment: Bullish | Trend: Up | Strength: 5/5 (Strong)
IV: 27.6 | Delta: 0.52 | Theta: -2.35 | Vega: 2.7
Buildup: Long Build-up
Why?
2300 CE has a Long Build-up with price up 4.4% and OI soaring 81%, backed by a 219% volume surge.
IV rising 5.5% confirms premium expansion. Strong participation makes this a convincing bullish setup.
________________________________________
🟢 4. TITAN 3650 CALL
LTP: 77.4
Sentiment: Bullish | Trend: Up | Strength: 5/5 (Strong)
IV: 16.6 | Delta: 0.53 | Theta: -2.13 | Vega: 4.3
Buildup: Long Build-up
Why?
3650 CE shows a Long Build-up, with price rising 22.2% and OI up 46.2%, supported by strong volume (+89%).
IV is moderate at 16.6, and Delta at 0.53 signals strong ITM chances.
________________________________________
🟢 5. POLYCAB 7200 CALL
LTP: 184
Sentiment: Bullish | Trend: Up | Strength: 5/5 (Strong)
IV: 24.3 | Delta: 0.51 | Theta: -6.32 | Vega: 8.5
Buildup: Long Build-up
Why?
7200 CE has a powerful Long Build-up, with price up 5.8% and OI surging 364%, supported by a massive 1552% volume jump.
IV at 24.3 is stable but rising, confirming strength.
________________________________________
⚠️ Disclaimer – Please Read Carefully
The information shared here is meant purely for learning and awareness.
It is not a buy or sell recommendation and should not be taken as investment advice.
📌 I am not a SEBI-registered investment advisor.
📌 All views expressed are based on personal study, chart patterns, and publicly available data.
📌 Trading — whether in stocks or options — carries risk. Markets can move unexpectedly, and losses can exceed capital.
📌 Past setups do not guarantee future outcomes.
👉 Beginners: use this to learn market behavior, practice with paper trades before risking money.
👉 Experienced traders: apply your own risk management, sizing, and strategy filters.
👉 Always consult a SEBI-registered financial advisor before real trades.
By engaging with this content, you acknowledge full responsibility for your own trading and investments.
________________________________________
💬 Found this useful?
🔼 Boost this post to help more traders learn.
✍️ Share your thoughts/setups in comments — let’s grow together.
🔁 Share with fellow traders & learners.
👉 “Follow for more clean, structured breakdowns with discipline at the core.”
🚀 Stay Calm. Stay Clean. Trade With Patience.
Trade Smart | Learn Zones | Be Self-Reliant 📊
________________________________________
Polycab - Descending Broadening WedgeCables have good demand. Polycab making bullish breakout from descending broadening wedge pattern and the subsequent targets are 5528.50, 5929.85, 6403.60 and the weekly pivot is at 6494.00. Around this level is 61.8% fib level 6427.55 so there is more supply (selling) in this point.

POLYCAB RANGE BREAKOUTPOLYCAB breaking a range with good volume
RSI divergence ,RSI bullish
as soon as breaks 5750
will reach to #target 6000
NO BUY/ SELL RECOMENDATION

POLYCAB: Too Good To Miss!1. An amazing discount has been shown on the price for such a strong stock.
2. Perfect setup, bouncing from the support levels.
3. Candle formations are strong as well.
4. RRR is great too.
⚠️ Disclaimer: This is NOT a buy/sell recommendation. This post is meant for learning purposes only. Views are personal. Please, do your due diligence before investing.⚠️
💬 What are your thoughts on this share it in the comments below. ✌️
🔥 Happy Trading!✅🚀

Polycab India Ltd – A Strong Technical and Fundamental Setup!Hello Everyone, i hope you all will be doing good in your life and your trading as well. Today i have brough a stock which name is Polycab India Ltd and it is currently testing a crucial support zone after a sharp correction. The previous resistance has turned into support, and a Morning Star candlestick pattern is forming, indicating a potential reversal. This setup aligns well with the stock’s long-term growth story.
From a technical perspective, a breakout from this support zone could lead to strong upside momentum. The entry zone is 5850-5750, with targets at 6333, 6955, and 7550, while a stop-loss at 5450 ensures risk management.
On the fundamental side, Polycab remains a market leader in the wires & cables industry, backed by strong revenue growth, profitability, and a solid order book. With the government's focus on electrification and infrastructure development, the stock has promising long-term potential.
Fundamental Ratio:
Market Cap
₹ 87,699 Cr.
Current Price
₹ 5,830
High / Low
₹ 7,607 / 4,236
Stock P/E
47.7
Book Value
₹ 571
Dividend Yield
0.51 %
ROCE
31.3 %
ROE
23.2 %
Face Value
₹ 10.0
Industry PE
31.9
Debt
₹ 193 Cr.
EPS
₹ 122
Promoter holding
63.0 %
Intrinsic Value
₹ 2,329
Return over 5years
43.3 %
Debt to equity
0.02
Net profit
₹ 1,865 Cr.
Disclaimer:- This analysis is for educational purposes only. Please trade responsibly and consult a financial advisor before making any decisions.
If you found this analysis helpful, don’t forget to like, follow, and share your thoughts in the comments below! Your support keeps me motivated to share more insights. Let’s grow and learn together—happy trading!

Polycab - Reaching Resitance* Stock now getting ready to reach near its strongest resistance area of 6165 - 6300
* It also happens to be a flip zone so stock will surely try to get stuck and even turn bearish from the same level
* Lower Time Frame Confirmation is compulsory to enter
* Downside target near 5250 -5200 can be expected
* Right now it is in a wait n watch situation
* As market volatility is on the higher side trade cautiously

POLYCAB - At JunctionArea of importance (1985 - 2050)
Stock may possibly take support
If so, will go sideways for next few days, before approaching new Life Time High
If breaks, the same area will act as resistance, before heading lower near 1700s area

Dynamic cables Triangle Breakout RoaringTriangle pattern breakout. After hitting T2 1131.85, Will head to 1391.60 which is 261.8% Fib level

Waiting for the downside moveThis is the Updation of previous post. This is for educational purposes only.

Cables - Power Potential breakoutCables looking good. Huge demand in cables for next 5 years across multiple sectors. Every player in the industry will get a pie of that demand. RSI daily chart double bottom looking for breakout. Price chart made trendline breakout.

POLYCAB#POLYCAB
Recent Bullish Move: Polycab India stock gained around 3.88%, showing strong upward momentum.
Key Resistance: Approaching the 7,000 level, which may act as a significant resistance.
Volume Surge: Recent price increase accompanied by higher-than-average trading volume, indicating strong buying interest.
Short-Term Buy Range: Ideal entry could be around 6,800 to 6,900 if the stock consolidates or pulls back slightly.
Short-Term Target: Possible target range of 7,200-7,300 for quick profits.
Stop-Loss Recommendation: Set a stop-loss near 6,600 to limit downside risk. Trend Outlook: Likely to go up if it breaks 7,000; cautious approach recommended if it drops below 6,800.

POLYCAB INDIA#POLYCAB
stock is taking support and trying to go upside
support 6500
weak below 6380 level
upside targets 6650-6725 level
keep eye on it

Polycab - Positional SetupCMP 6420 on 04.11.24
All important levels are mentioned on the charts. A long parallel channel has been acting as a support level in the last weeks. If Sustains above 6300 levels, it may go to 6850/7000.
This is only for learning and sharing purposes, not buying or selling advice in any form.
All the best.

POLYCAB - Consolidation -Breakout -DailyThe chart for Polycab India Ltd. (POLYCAB) from October 2, 2024, reflects a strong breakout above resistance levels with significant momentum. Here's a breakdown of key observations:
Resistance Breakout: The stock has decisively broken above the resistance level around ₹6,905 with a strong bullish candle, closing at ₹7,326.55, marking a 5.34% gain for the day. The stock was previously consolidating within a range, but the breakout is accompanied by increased volume, which strengthens the move.
Potential Target: Based on the breakout, the stock could test higher levels, potentially reaching around ₹7,672 (upper green resistance zone), indicated by previous high zones or Fibonacci extensions.
Volume and Momentum: The volume bars indicate strong buying interest, confirming the breakout. The RSI (Relative Strength Index) shown at the bottom also supports bullish momentum as it is nearing the overbought zone, signaling strong upward momentum but also a potential caution for profit booking in the near term.
Support Levels: The immediate support is around ₹6,902. If the stock faces a pullback, this level might act as a key support zone. Below that, ₹6,146 would be the next significant support level.
The chart shows strong bullish sentiment, and the momentum might push the stock higher unless profit-booking or external market factors interfere.

POLYCAB ASCENDING TRIANGLE BREAKOUTPolycab breaking ascending triangle pattern
weekly basis after taking support of 20 ema
good volume macd crossover immenent
#target 7800 after 7500 only
EDUCATIONAL IDEA

POLYCAB: Connection Profit KaPolycab is ready to move ahead and continue the momentum it has.
India is growing as a consumption market; the most basic consumption is home buying and home decoration.
Cables and wires are essential and aggressive industries.
So as per momentum right now Polycab is priced at 7050 target would be of 7700-7900
with SL of 6750.
It does not constitute and cannot replace investment advice. We therefore recommend that you contact your personal financial advisor before carrying out specific transactions and investments.

POLYCAB - Consolidation Breakout - Daily Polycab India Ltd., and it shows a breakout from a sideways consolidation range between ₹6,146 and ₹6,905. The current price is ₹7,054.80, reflecting a strong move upward with a significant increase of +4.56%.
Key Insights:
Breakout Confirmation: The stock has broken out from its consolidation range between ₹6,146 and ₹6,905, showing bullish momentum.
Volume Spike: The breakout is supported by a surge in volume, signaling a higher probability of continuation in the current uptrend.
Target Levels:
Based on the previous range and measured move from this breakout, the immediate target is around ₹7,671.95, which is approximately 11% from the current price.
A potential intermediate target was at ₹7,331.45, which seems to be reached as per the chart's high at ₹7,054.
Support Levels:
The previous strong support at ₹6,146 now acts as a solid base, and the price action above this level suggests limited downside risk in the short term.
Conclusion:
The chart signals bullish potential for Polycab India Ltd. with upward targets around ₹7,331.45 and ₹7,671.95, while the breakout and volume spike suggest strong momentum continuation.

Inv H&S in polycab Since from many days polycab trading in range bound formed inverted head &shoulder in 1hr time frame.

Polycab & Concor | Post Your Findings in Comments ⭕ Price Action Structure similarity !!!⭕
======================================================
Technical Reasons to trade or Strategy applied :-
Polycab & Concor both show cast same structure
2 times V shaped recovery
Range bond Market
Bear Bo ( breakout ) give Pretty good momentum
Takes out 2nd V shaped Low as stop-loss Hunting
POST Your Findings in comment section any other stocks with some pattern you observed we can discuss as a community there !!! Happy To Learn here in TRADINGVIEW with charts
#ThankU For Checking Out Our IDEA , We Hope U Liked IT 📌
🙏FOLLOW for more !
👍LIKE if useful !
✍️COMMENT Below your view !

Cables next rallyIndustry is experiencing robust demand environment and Polycab is well-positioned to capitalize on this favourable market dynamics.
India Ratings has improved the outlook on Polycab's credit rating to “positive” from the earlier “on watch with negative implication”
Polycab's in the process of calibrating new mid-term guidance and will be releasing the new guidance during the course of this financial year
RDSS Govt scheme will give good orderbook
Polycab working on 4 areas
Improving our reach
Product development
Brand positioning
Influencer management
Every quarter, Polycab adding new geography to supply its inventory
Working on 1000 to 1100cr capex to cater increased demand in next few years. 280Cr capex already done.
Capacity utilization in Q1 70-75%
In power transmission distribution sector, component of cable supply is high than other sectors. Cables 75% and wires 25% contribution.
Wire contribution would increase in upcoming quarters between 4 to 8 as real estate projects are in progress.
Framed index with Kei, Polycab, RRkabel, Fincables. Fib target is double of current. Target 29987.45 of this index.

Keep An Eye - Gap Fill - POLYCAB📊 Script: POLYCAB
📊 Sector: Cables
📊 Industry: Cables - Power
Key highlights: 💡⚡
📈 Keep an Eye on Stock There was a gap down on 28th June we may see Gap Fill.
GAP RANGE - 6777 TO 6990
⚠️ Important: Always maintain your Risk & Reward Ratio.
✅Like and follow to never miss a new idea!✅
Disclaimer: I am not SEBI Registered Advisor. My posts are purely for training and educational purposes.
Eat🍜 Sleep😴 TradingView📈 Repeat 🔁
Happy learning with trading. Cheers!🥂
