POONAWALLA FINCORP LTD ANALYSISWhat happens when FIIs, DIIs, Mutual Funds, and even the company's own Promoters all start buying up shares of the same stock over the last year?
You get a potential explosive setup.
This week, we're analyzing a stock where the "smart money" has left a trail of footprints so large, they're impossible to ignore.
The Analysis- Poonawalla Fincorp is showing a rare convergence of technical strength and institutional accumulation. After a two-year period of quiet consolidation, this stock is showing clear signs of waking up.
Here is the professional thesis for this potential market leader.
1. The Technical Breakout: A Coiled Spring Unleashed
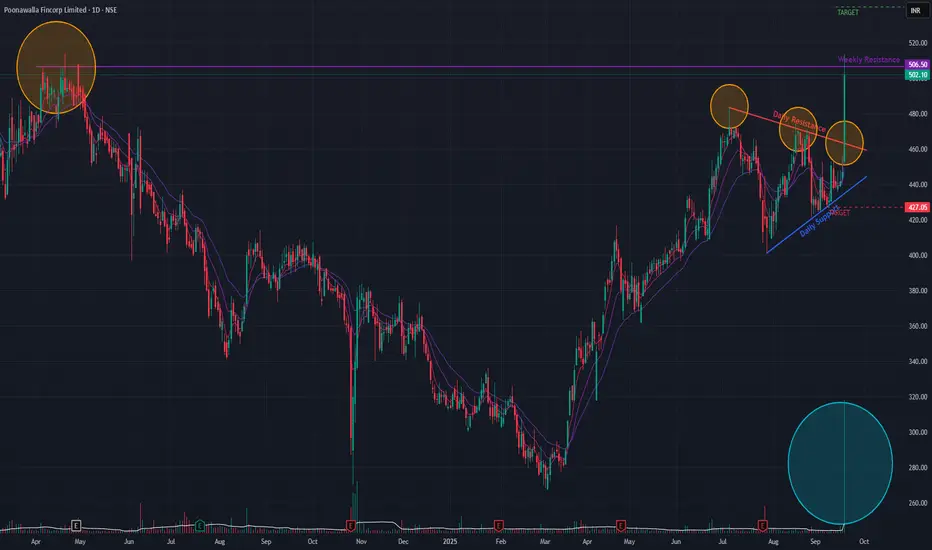
After a historic 3700%+ run from its COVID lows, the stock entered a necessary two-year period of price and time correction. This "hibernation" allowed it to build a massive consolidation base.
Now, it is breaking out of that base and challenging a resistance level that has held it back for nearly 1.5 years. A move to a new All-Time High is now in sight. This is a classic sign of a transition from consolidation to a new potential uptrend.
2. The Confirmation Signals: Strength & Volume
Two key factors confirm the strength of this breakout:
💠Relative Strength: In a volatile market, Poonawalla has been a clear outperformer. It held its ground firmly while weaker stocks faltered, proving it is a market leader, not a laggard.
💠Historic Volume Surge: Last week, the stock registered its highest weekly volume in history. This is not retail activity. This is the unmistakable footprint of large institutions accumulating shares, providing immense fuel for the potential move higher.
The Game Plan
This analysis is for educational purposes. Here is how a professional might structure a trade plan around this thesis:
Stock: Poonawalla Fincorp Ltd
Entry: Near current price of ₹500.25
Stop-Loss: ₹425.20 (Placed below a key structural pivot to invalidate the breakout thesis if hit)
Initial Target: 35-40% profit zone, with a plan to trail positions thereafter to capture a larger trend.
Key Concern: There is a minor resistance 3.5% above the current price. A decisive break above this level would add further confirmation and could lead to a rapid acceleration.
Disclaimer: This is not investment advice. It is a technical and fundamental analysis for educational purposes. Always manage your risk.
POONAWALLA

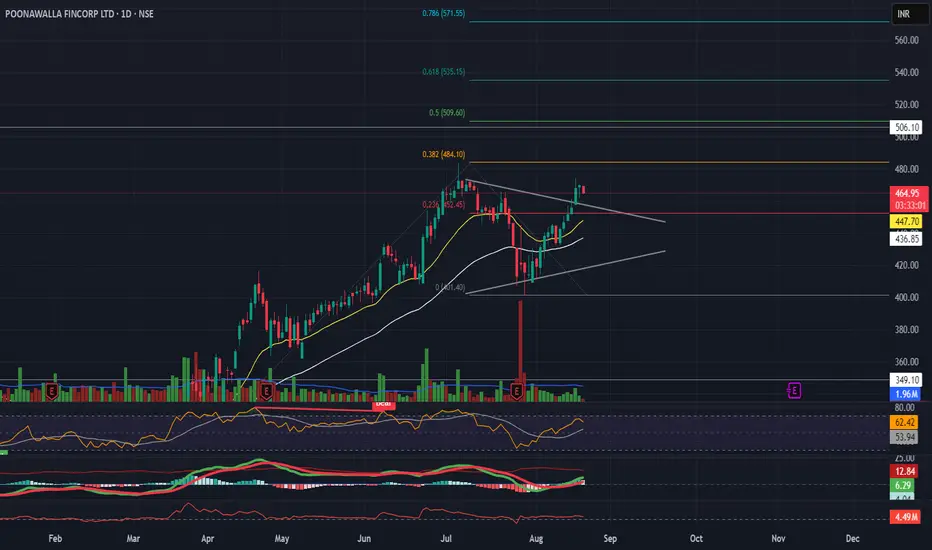
Poonawalla Fincorp (Daily) - Potential ATH ?Poonawalla Fincorp has shown a significant bullish development, decisively breaking out of a Triangle continuation pattern today. This breakout was marked by a substantial 12.30% surge in price , backed by exceptionally high trading volume.
This move signals a potential continuation of the bullish run that began in March 2025, which itself was a reversal of a downtrend initiated by a Double-Top bearish pattern in April 2024.
Bullish Confirmation Signals 👍
The positive outlook is supported by several key indicators:
- Breakout Volume: The price surge was accompanied by a massive spike in volume , indicating strong conviction and participation from buyers.
- Momentum: Short-term Exponential Moving Averages (EMAs) have formed a positive crossover , confirming the renewed bullish momentum in the immediate term.
Immediate Hurdle Ahead 🚧
Despite the strong breakout, the stock is now trading at a crucial long-term resistance level . Overcoming this barrier is essential for the upward trend to continue.
Future Outlook and Scenarios
- Bullish Case 📈: If the upward momentum is sustained and the stock successfully breaks through the current long-term resistance, it could clear the path to test its all-time high . An initial price target in this scenario would be the ₹539 level.
- Bearish Case 📉: Conversely, if the stock fails to breach this resistance, the momentum could fade, potentially leading to a price correction towards the ₹427 support level.
Watchout for the price-action in the next few sessions !!
Poonawalla Fincorp showing a symmetrical triangle breakout:
Setup: Clear breakout above trendline resistance on daily chart.
Indicators:
RSI at 62 → momentum strong, near overbought but not overheated.
MACD bullish crossover with positive histogram.
EMAs: 20 & 50 EMA slope positive; price sustaining above both.
Levels:
Stoploss: ₹445
Targets: ₹509 immediate, then ₹535
👉 Outlook: Strong bullish bias. Sustaining above ₹473 opens path towards ₹500–506 zone. Support at ₹445.
Poonawalla Fincorp | Probable Bullish Flag Breakout Candidate📊 Technical Analysis Overview:
Poonawalla Fincorp is showing strong bullish momentum and is currently a probable flag breakout candidate. The stock has crossed the 200-day EMA with high volume, indicating strong institutional participation. Additionally, RSI is above 70, confirming bullish strength.
📌 Trade Setup & Key Levels
✅ Buy Entry: ₹357
🚨 Stop Loss: ₹333
🎯 Target Levels:
🔹 Target 1: ₹399.10
🔹 Target 2: ₹414.20
🔹 Target 3: ₹429.85
🔹 Target 4: ₹570.50
🔹 Target 5: ₹584.55
📈 Technical Observations
🔹 Flag Breakout Formation: The stock is attempting a breakout from a bullish flag pattern, which often leads to strong uptrends.
🔹 Volume Confirmation: A surge in volume alongside the breakout increases the probability of sustained upside.
🔹 200 DEMA Crossover: The price has successfully crossed the 200-day EMA, a strong bullish signal.
🔹 RSI Above 70: Indicates strong momentum, though a short-term pullback cannot be ruled out.
⚠️ Risk Management & Final Thoughts
Always use proper risk management to protect capital. The stop loss at ₹333 ensures a controlled downside, while the upside targets provide a strong risk-reward ratio.
📢 Watch for Retest: If the price retests the ₹357 level after the breakout and holds, it could provide another buying opportunity.
📊 What do you think? Will Poonawalla Fincorp continue its rally? Share your thoughts in the comments! 👇

POONAWALLA FINCORP LIMITEDthis chart is very crusial support zone good rsi strength break resistance trandline then entry point clear view cmp 316 entry point above 338 stop loss 315 targate 356 , 372 ,408 431 , 510

POONAWALLA - Ready for next swing?POONAWALLA is currently sitting at a support level it has often returned to. For the past three years, the stock has stayed within this channel. Right now, it seems like there’s a good balance between risk and potential reward if you were to invest. The company itself is performing well based on its financials and seems like a promising option.
However, this is just a personal opinion. It's important to do your own research before making any investment decisions. This is not a suggestion to buy or sell the stock.

Technical Analysis for Poonawalla Fincorp:
Current Market Price (CMP): ₹387
Trade Type: Swing trade for 6-12 months
Stop Loss (SL): ₹330 for risk management
Targets:
Target 1: ₹500
Target 2: ₹600
Monitor the trade regularly and adjust the stop loss as the trade progresses. Evaluate price action for potential target achievements.
#PoonawallaFincorp #TechnicalAnalysis #SwingTrade #StockMarket #TradingStrategy #RiskRewardRatio

POONAWALLA reversed from a strong demand zoneApprox. 340-355 is a strong demand zone and from there the price took a reversal. Also MACD has given a positive crossover.
T1- 450, T2- 500 and T3- 568. Sl- 340 and trail as price goes up.
Safe traders can book profit on hitting T1 or T2 as per your risk appetite. Risk takers can go till T3 at max.
Note:- This is only for educational purpose and not a recommendation.

MULTIBAGGER AT WEEKLY SUPPORTSNSE:POONAWALLA proved out to be a multi-bagger with 4X returns in last 24-30 months. Stock has corrected and is now available at support. Strong promoters and growth can give more returns.

POONAWALLA Analysis & PredictionThis is the analysis of POONAWALLA in Daily Time Frame. Watch carefully. The chart explains itself.
There are some prediction levels. These Levels act as Support and Resistance according to position of price. You have to trade according to level breakout or breakdown.
Always maintain your risk management.
Book your profit according to your “STOMACH”.
Disclaimer:
This is not investment advice. I am not a SEBI Registered Analyst. Anything posted here is my own analysis and views. This is created for educational purposes only. Always consult your Financial Advisor before taking any decision or trade.
Happy trading.
About POONAWALLA:
Poonawalla Fincorp Ltd. is a non-banking finance company, which engages in the provision of asset, consumer, and MSME financing through its pan India branch network. It operates through the India and Outside India geographical segments. The company was founded by Mayank Poddar and Sanjay Chamria on December 18, 1978 and is headquartered in Pune, India.

POONAWALA FINCORPPOONAWALA FINCORP Showing Good Breakout on Major 1D ResistResistance Zone with Small Pullback. Best for further rally Long Term or Swing.
KEEP ON RADAR

Breakout in Poonawala after 2 years!The stock of Poonawala fincorp has been consolidating in an ascending triangle pattern since end of 2021.
Currently, the stock is trading above its previous all time high of around 343.8
Buying at the top is always risky so keep this stock in watchlist and enter at a retest of 320 levels or as per your own risk reward.
Idea is shared for educational purposes.

POONAWALA CAN GO BRESSSK!Classsic Base VCP.
Breakout above 340-350 will be a great opportunity.
SL Below this horizontal support.

POONAWALLA Triangle BreakoutPoonawalla attempting break out from triangle pattern on 1D timeframe. Wait for closing and enter after bullish confirmation.

POONAWALLA FINCORP - 50% RETURNS!!!BUY - POONAWALLA FINCORP LTD
CMP - Rs. 325
Target - 1: Rs. 400
Target - 2: Rs. 450
Target - 3: Rs. 490
.
.
Technicals - Cup and Handle Pattern
.
This is just a view by an expert analyst, please invest at your own risk.
.
Follow me for more!

POONAWALLA FINCORP : Inverse Head & Shoulder Breakout#POONAWALLA : Good Inverse H&S Breakout
>> Buy at cmp or in retracement till Safe entry levels
>> Good Strength in stock
>> Good Volumes in stock
Take 10% and keep trailling
Keep liking & sharing for more LEarning

POONAWALLA - Ichimoku Bullish Breakout Stock Name - Poonawalla Fincorp Ltd
Ichimoku Cloud Setup :
1). Today's close is above the Conversion Line
2). Future Kumo is Turning Bullish
3). Chikou span is slanting upwards
All these parameters are showing bullishness at Current Market Price
and more bullishness AFTER crossing 315
#This is not Buy and Sell recommendation to any one. This is for education purpose and a helping hand to learn trading in Market.
# Cloud Trading
# Ichimoku Cloud
# Ichimoku Followers
I hope you all like my analysis.
Please do share your thoughts into comment section.
Please give a like, share & subscribe for daily analysis.

POONAWALLA, Trend Reversal, Lifting From SupportPOONAWALLA, Trend Reversal, Lifting From Support NSE:POONAWALLA
Verdict Poonawalla
Lifting up From Support
Trend Reversal
High Quality Stock
Indicators Positive
T1 333
T2 343 Positional
Only For Educational Purpose

Poonawala long (03 Oct)Poonawala long (03 Oct)
RSI- 58
Buy at CMP- 315
SL- 301
Target- 335, 344
Join us, Learn more, Earn more
Disclaimer- We are not SEBI registered advisor.
Charts and views are only for educational purpose.

poonawalla fincorp limited trading planI have been invested in this company from 190 levels .
The trading plan and everything is mentioned already ..
I will buy it when it close above 345 or on retest after breakout above 345 !!
expecting nothing less than 420-500 here !!

POONAWALLA - Ichimoku Bullish Breakout Stock Name - Poonawalla Fincorp Ltd
Ichimoku Cloud Setup :
1). Today's close is above the Conversion Line
2). Future Kumo is Turning Bullish
3). Chikou span is slanting upwards
All these parameters are showing bullishness at Current Market Price
and more bullishness AFTER crossing 316
#This is not Buy and Sell recommendation to any one. This is for education purpose and a helping hand to learn trading in Market.
# Cloud Trading
# Ichimoku Cloud
# Ichimoku Followers
I hope you all like my analysis.
Please do share your thoughts into comment section.
Please give a like, it motivates me to do analysis.

#Poonawala Trying strongly to cross the channel, failed multiple times. Good quarterly result move is left.

POONAWALLA - Ichimoku Bullish Breakout Stock Name - Poonawalla Fincorp Ltd
Ichimoku Cloud Setup :
1). Today's close is above the Conversion Line
2). Future Kumo is Turning Bullish
3). Chikou span is slanting upwards
All these parameters are showing bullishness at Current Market Price
and more bullishness AFTER crossing 309
#This is not Buy and Sell recommendation to any one. This is for education purpose and a helping hand to learn trading in Market.
# Cloud Trading
# Ichimoku Cloud
# Ichimoku Followers
I hope you all like my analysis.
Please do share your thoughts into comment section.
Please give a like, it motivates me to do analysis.
