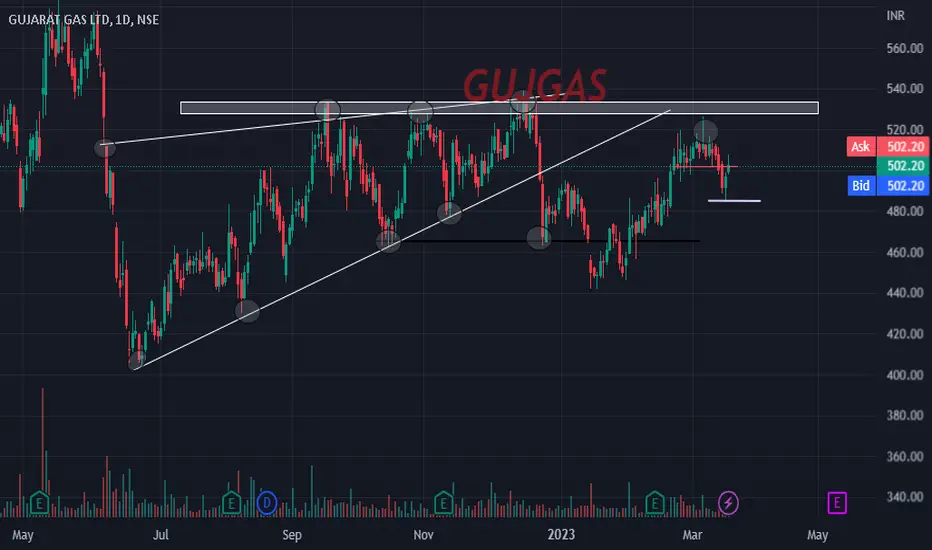
GUJGAS RISING WEDGE AFTER MAKING RISING WEDGE IN GUJGAS
A stock is in consolidation
a movement come in a stock in downword But
Again from the lower level there is buying in stock
stock still not complete the target of rising wedge
keep an eye on that
just a view
consult your advisor before any action
Positional
Trade Idea on Ambuja Cement with Price action notes In the above chart, the price action goes like this.
1) 50-60% Fibo retracement zone - Stock after a substantial fall getting lots and lots of demand from this zone
2) Its fibo retracement - Used from a swing low to swing High
3) Its called a counter trendline - stock currently getting demand on the extended CT, as a result of breakout and bigger time frame retest
4) It's called a trendline, made from a swing low point to another swing low, extended forward, giving a demand zone
5) Its called a Confluence zone, Candlestick pattern is bullish pressure, lower wick multiple rejection on W time frame and cluster of many other demand areas
6) 3 Yellow lines are potential Target zones from CMP.

ALKEM | Trendline breakout + Channel support | 25-30%ALKEM | Trendline breakout + Channel support - Trying to capture a 25-30%
CMP : 3155
SL : 2900
Target : 4000
1:3 risk reward setup

JSW ENERGY --POSITIONAL JSW ENERGY --DAILY CHART SETUP --POSITIONAL
1. Jsw energy seen on daily chart setup retest previous lower channnel breakout level around 250-255
2. currently stock trading above 21, 44, 50, 200 HMA
3. one can initiate Buy around 250-255 for current level target 270-280-300 positional (1-3 ) Month stop loss 220 bellow strong support line
4. CCI at above center line ( bullish )
5. RSI 55 level above 60 will be bullish zone
6. MACD above center and signal line bullish .
** THIS IDEA IS FOR EDUCATIONAL PURPOSE ..trade at own risk !!
HAPPY TRADING ,!!

A positional Long in BioconNSE:BIOCON
Hello everyone!
I noticed a trade in Biocon
Biocon is taking support at a long term trendline with a divergence in RSI
and stock is already corrected as well so I will prefer to buy in Biocon as a 1-year investment perspective.
My target will be 300 rs in biocon.
Let's see what happened.
Hope for the best!!
for more connections
follows us at insta handle @dhanrajmoney

PNBHousing looking bullishPNBHousing is in downtrend from 2017 and has been facing a weekly resistance near the trendline. It had given a breakout few weeks back but didn't sustain.
However, stock has bounced back from 0.5 Fib levels and gave a weekly closing above the trendline as well as the 200 EMA(weekly) which is a bullish closing.
630 is an immediate resistance above which it can test the 675-750 levels in short to medium term. So, you can keep the stock in watchlist.
Sharing this idea only for educational purposes and its my personal opinion.

GESHIP Long15Year BO
Positional view(HP of 3months+)
500-600 is accumulation range
Stop-loss: 435(0.618 of entire move)
Target: 800+

Piramal may be a good pickThe stock is trading in a price range for the last five months. This time again at the lower levels. If able to sustain above 780 levels, may be bullish in coming sessions. The buy scenario is open only above 780. Keep it on the radar.
Only for learning and sharing purposes, not a piece of trading advice in any form.
All the best.

copper positional sellMCX:COPPER1! Daily macd crossed below zero line with double top in price action. one bounce on 4 hrs chart timeframe near 760-765 is best selling zone the trg of upto 700 in month of March contract. do your own analysis before trade. This is my personal observation and not a trading recommendation.

VTL | Flag in 4H time frame - potential for 10% short termVTL | Flag in 4H time frame - potential for 10% short term
CMP : 319 (Dip : 310)
SL : 300
Target : 355
1:3+ risk reward setup
Weekly chart shows are strong reversal aswell.

CIGNITITECH near IVHS breakoutCIGNITITEC has been forming an inverted head and shoulder pattern from last 1.5 years and is currently near breakout of the neckline.
It can give a good upside move if a strong weekly closing above 639 levels is seen.
Idea shared just for educational purpose.

NIFTY | Multiple support zones in 1H time frameNIFTY (1H time frame)| 200 EMA + RSI support + Trendline support

#canfinhomes trade idea kindly see the information given on the chart
only for educational purpose kindly trade on your own risk

EICHERMOT | Trendline + 200 EMA - High probable setupEICHERMOT | Trendline + 200 EMA - High probable setup for trend reversal

NFL | Looks highly potential for doubling - InvestmentNFL | Looks highly potential for doubling - Investment

KPIGREEN - Positional tradeKPIGREEN - Positional trade
Long at 463 with SL at 440 and targets of 510, 540, 560
Follow strict SL.
Only for educational purposes ;)

JBMA stage analysisStage 1
Entry : 566-580
SL : swing low/ 7-12% / 481
Targets : 650, 703, 787,++, ride the trend.
3-9 months
Note: only for learning, trade at your own risk.

Carborundum Stage analysis.Stage 2A breakout
entry : 950-1015
SL : swing low/ 7-12% / 898
Targets : 1219,1383,1600++, ride the trend.
3-9 months
Note: only for learning, trade at your own risk.

Sunflag iron stage 1 breakout.Sunflag iron stage 1 breakout.
Stop loss 136.
Only for information. trade at your own risk

RAMCOCEM | Trendline breakout - Looks potential for 25%RAMCOCEM | Trendline breakout - Looks potential for 25%
CMP : 730
SL : 675
Target : 910, 1100
1:3 risk reward

NIIT LTD --POSITIONAL NIIT LTD-- DAILY CHART --POSITIONAL --TRADE SETUP
1. Daily chart seen trendline breakout at todays candle with good volume
2, Rounded bottom chart formation
3. currently strong pullback seen on oversold level
4. trix line bullish crossover seen on chart
5, one can enter at 325-335 level for target 350-375-400 POSITIONAL ( 1 month ) stop loss bellow trendline support at 275-280
6. stock has good quarter result at current quarter as fundamental back with technical pullback .
** THIS IDEA IS FOR EDUCATIONAL PURPOSE .. TRADE AT OWN RISK !!
HAPPY TRADING .!

Short termWe can see good up move soon.
Stock Corrected and reversed and retested its previous swing.

#ashokleyland trade idea kindly see the levels marked on the chart this can be good stock to trade
only for educational purpose
